. 2024 Sep;633(8028):207-215.
doi: 10.1038/s41586-024-07767-5. Epub 2024 Aug 7.

Neuronal substance P drives metastasis through an extracellular RNA-TLR7 axis

Affiliations

Neuronal substance P drives metastasis through an extracellular RNA-TLR7 axis

Veena Padmanaban et al. Nature. 2024 Sep.

Abstract

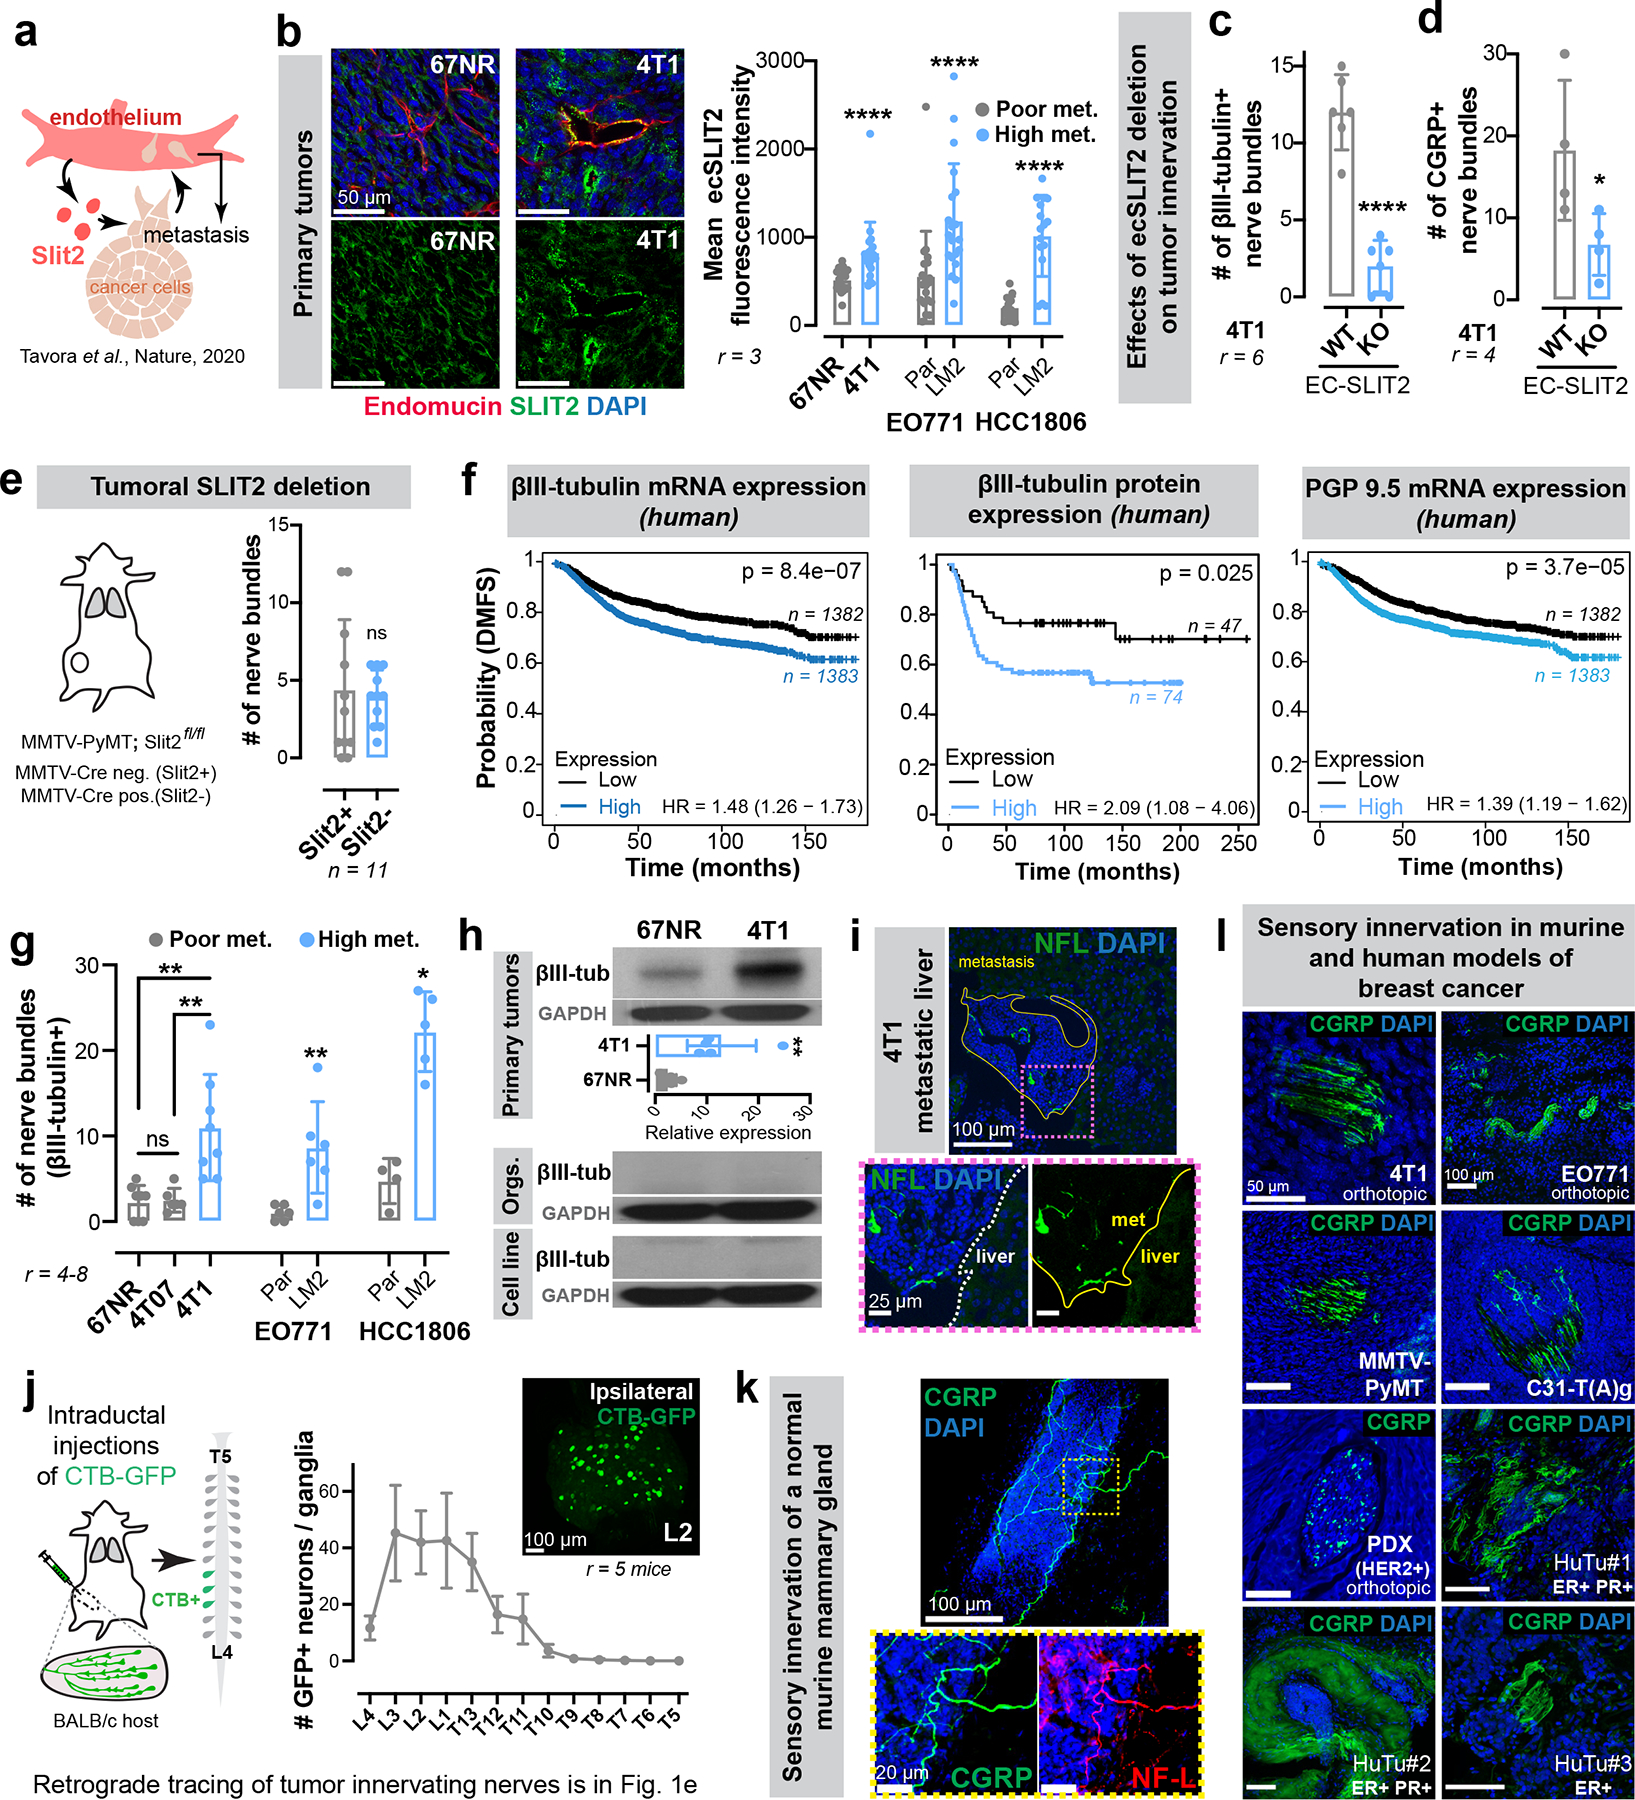
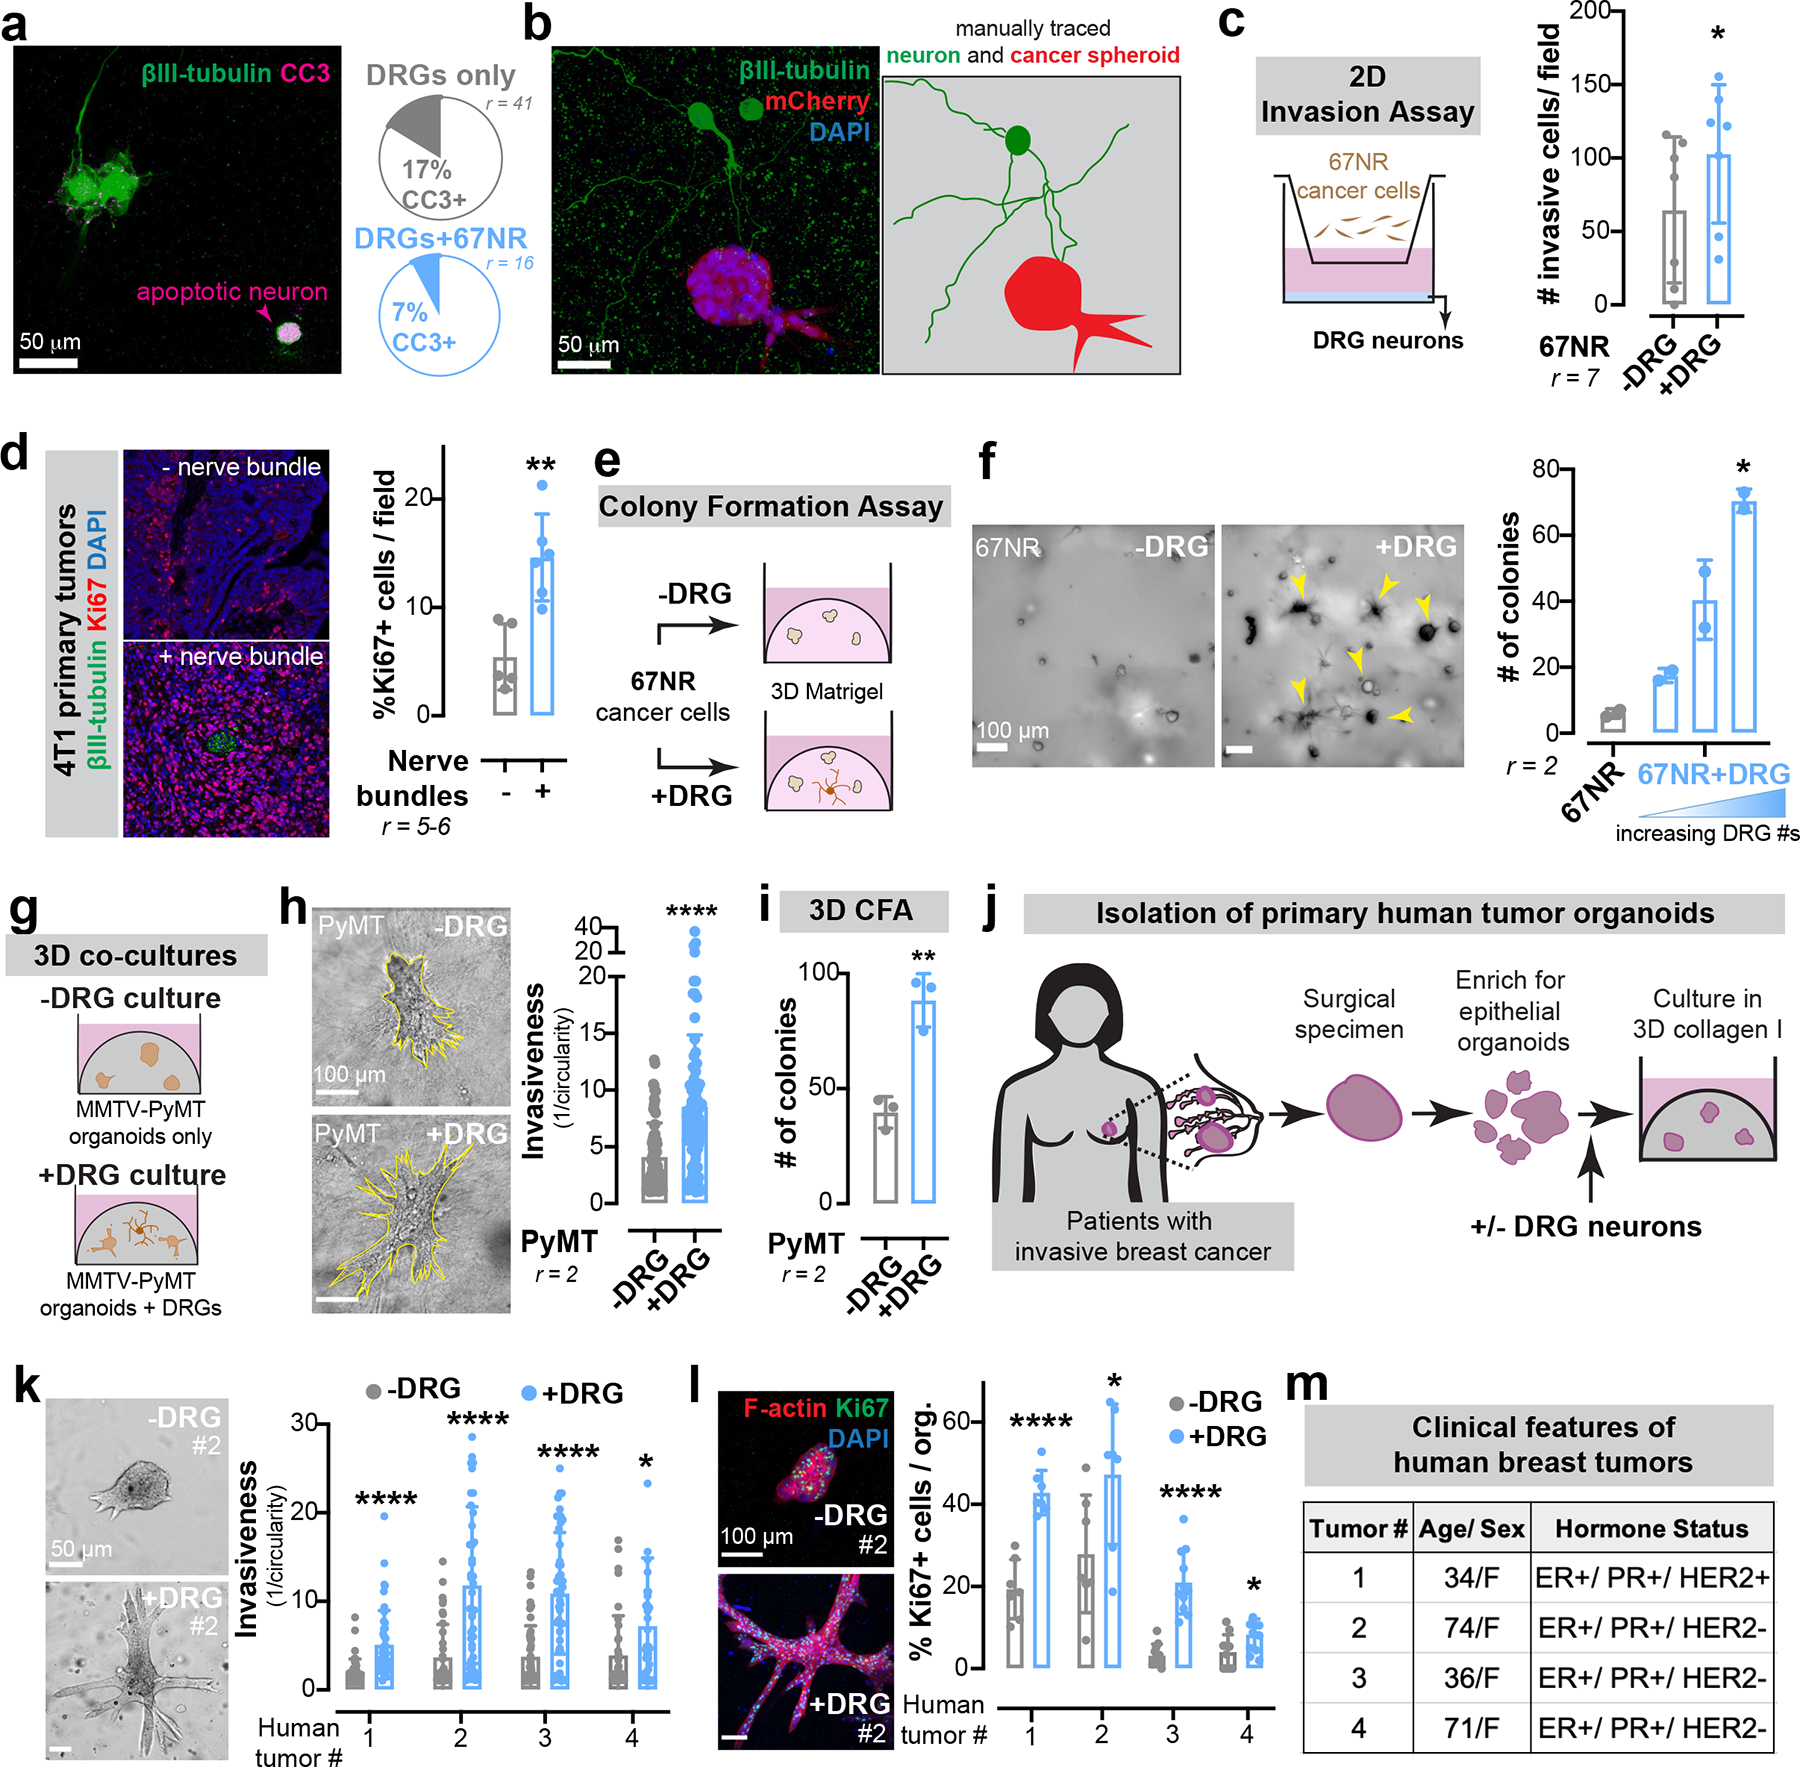
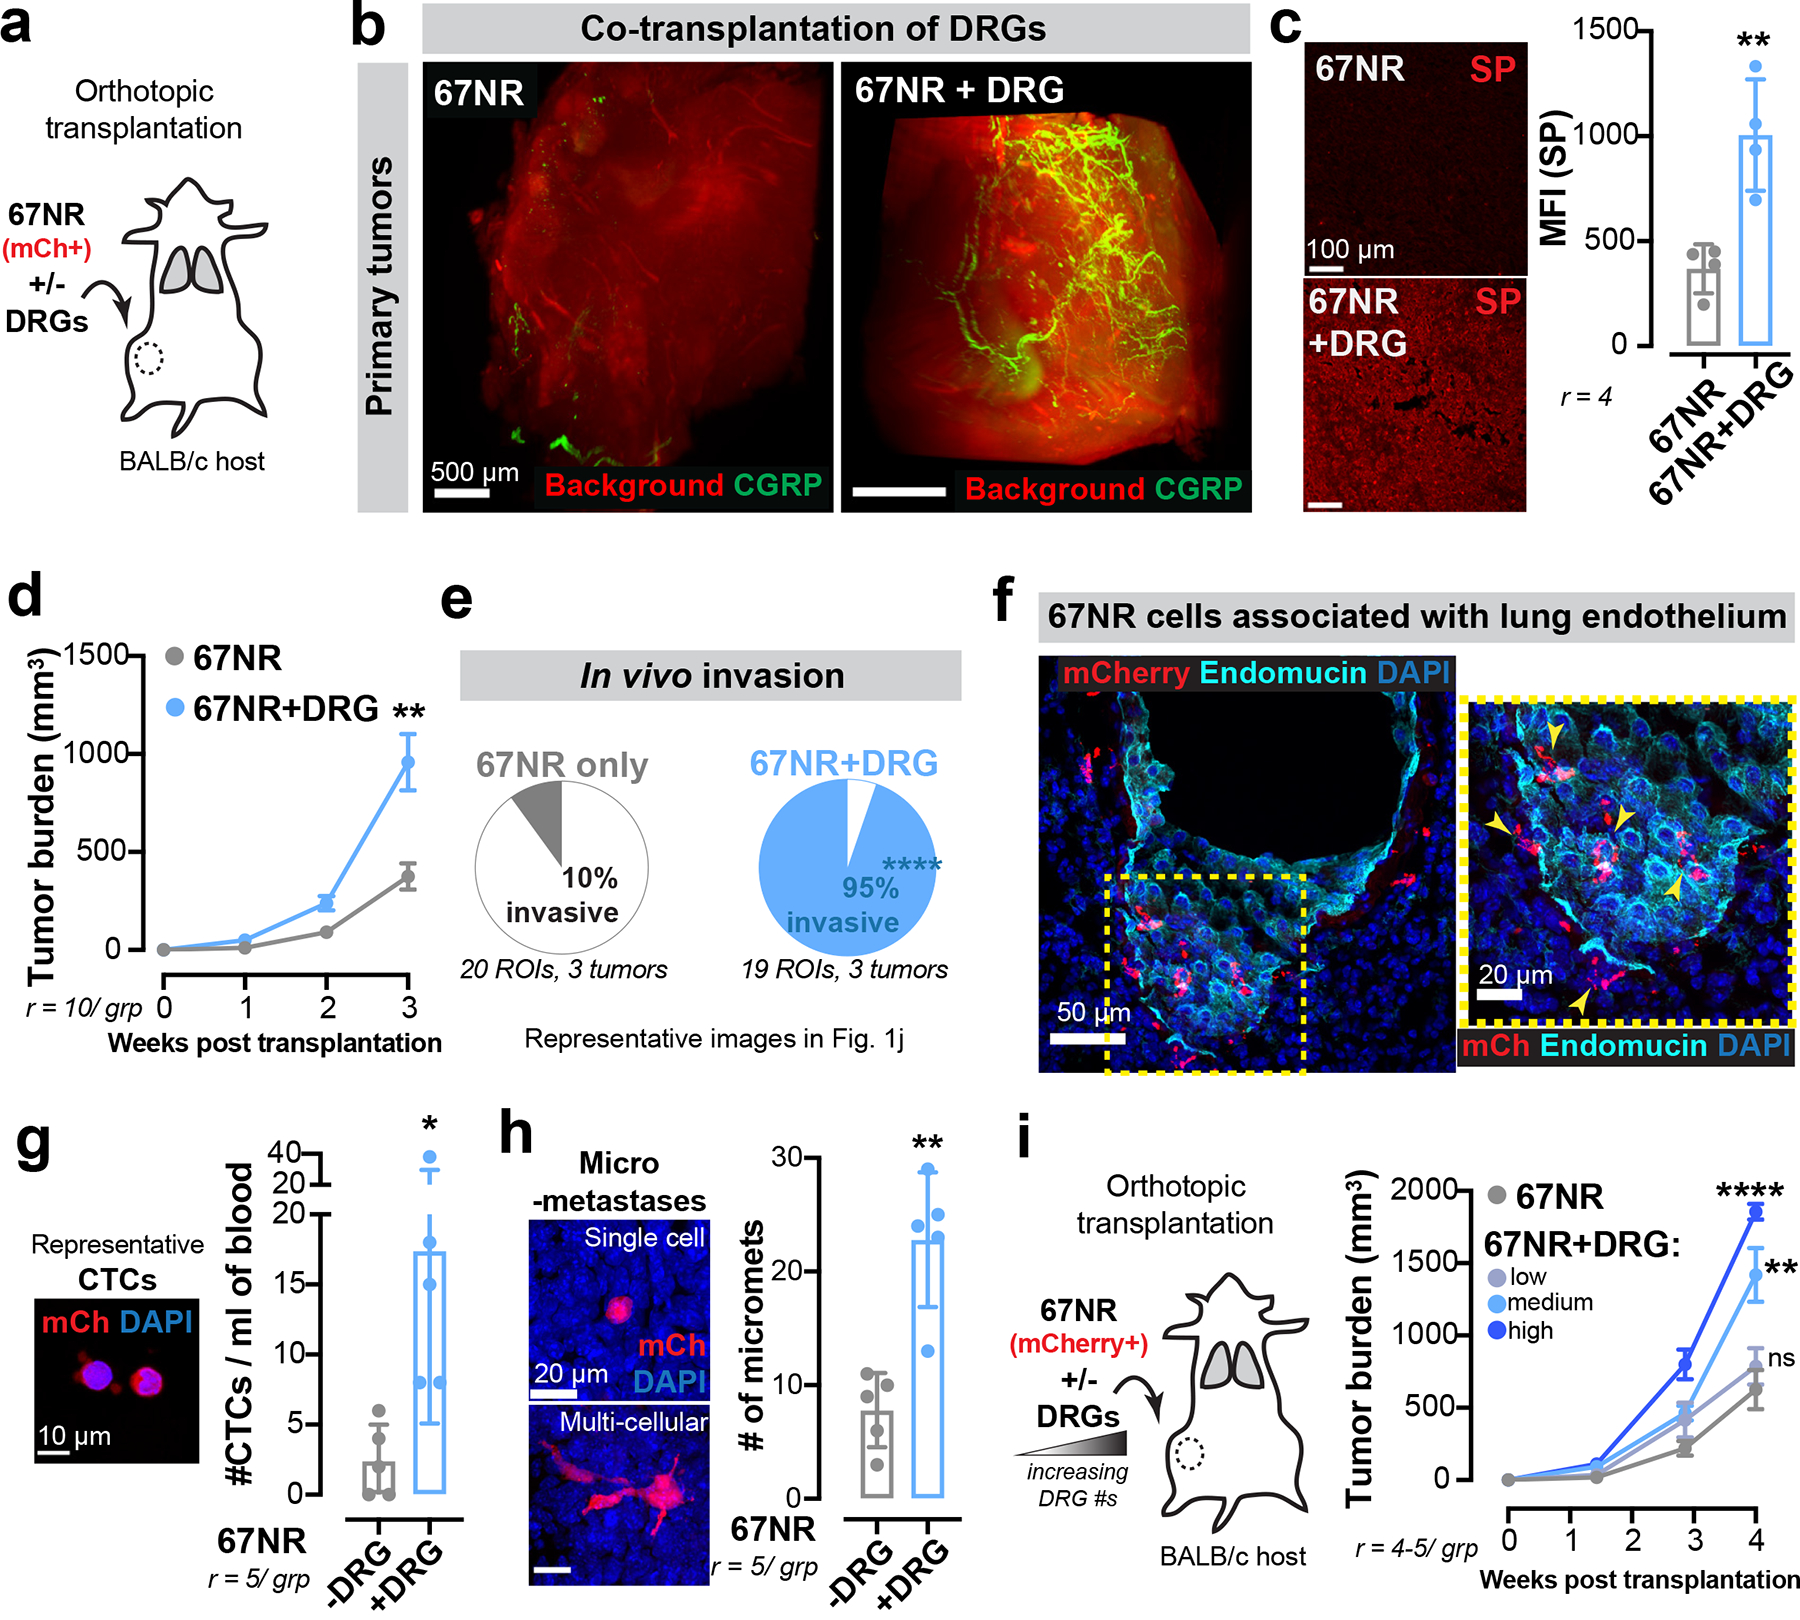
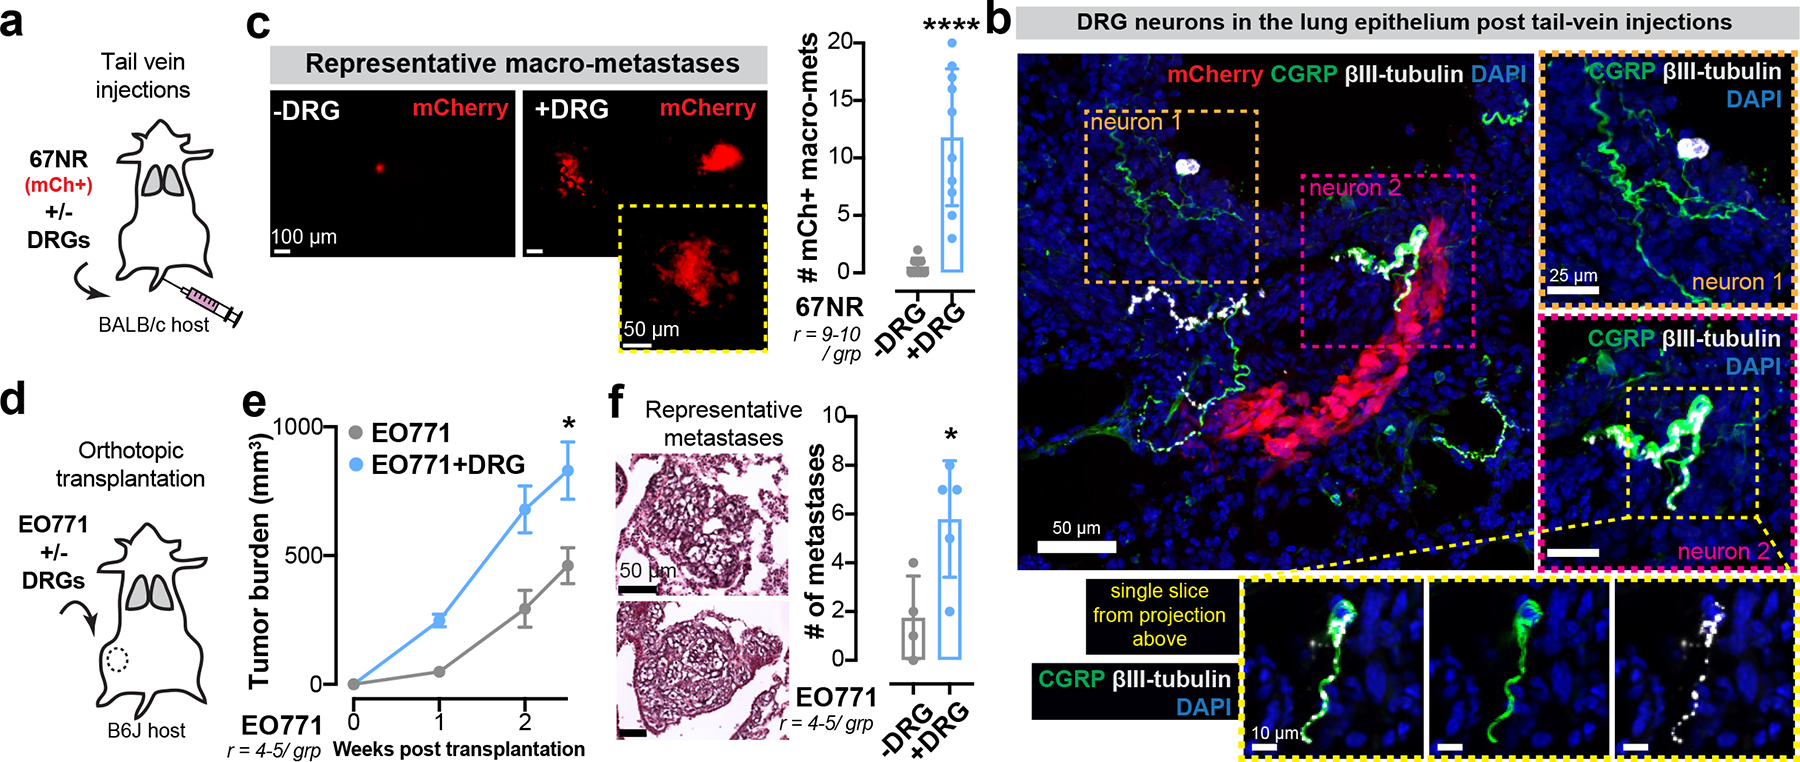
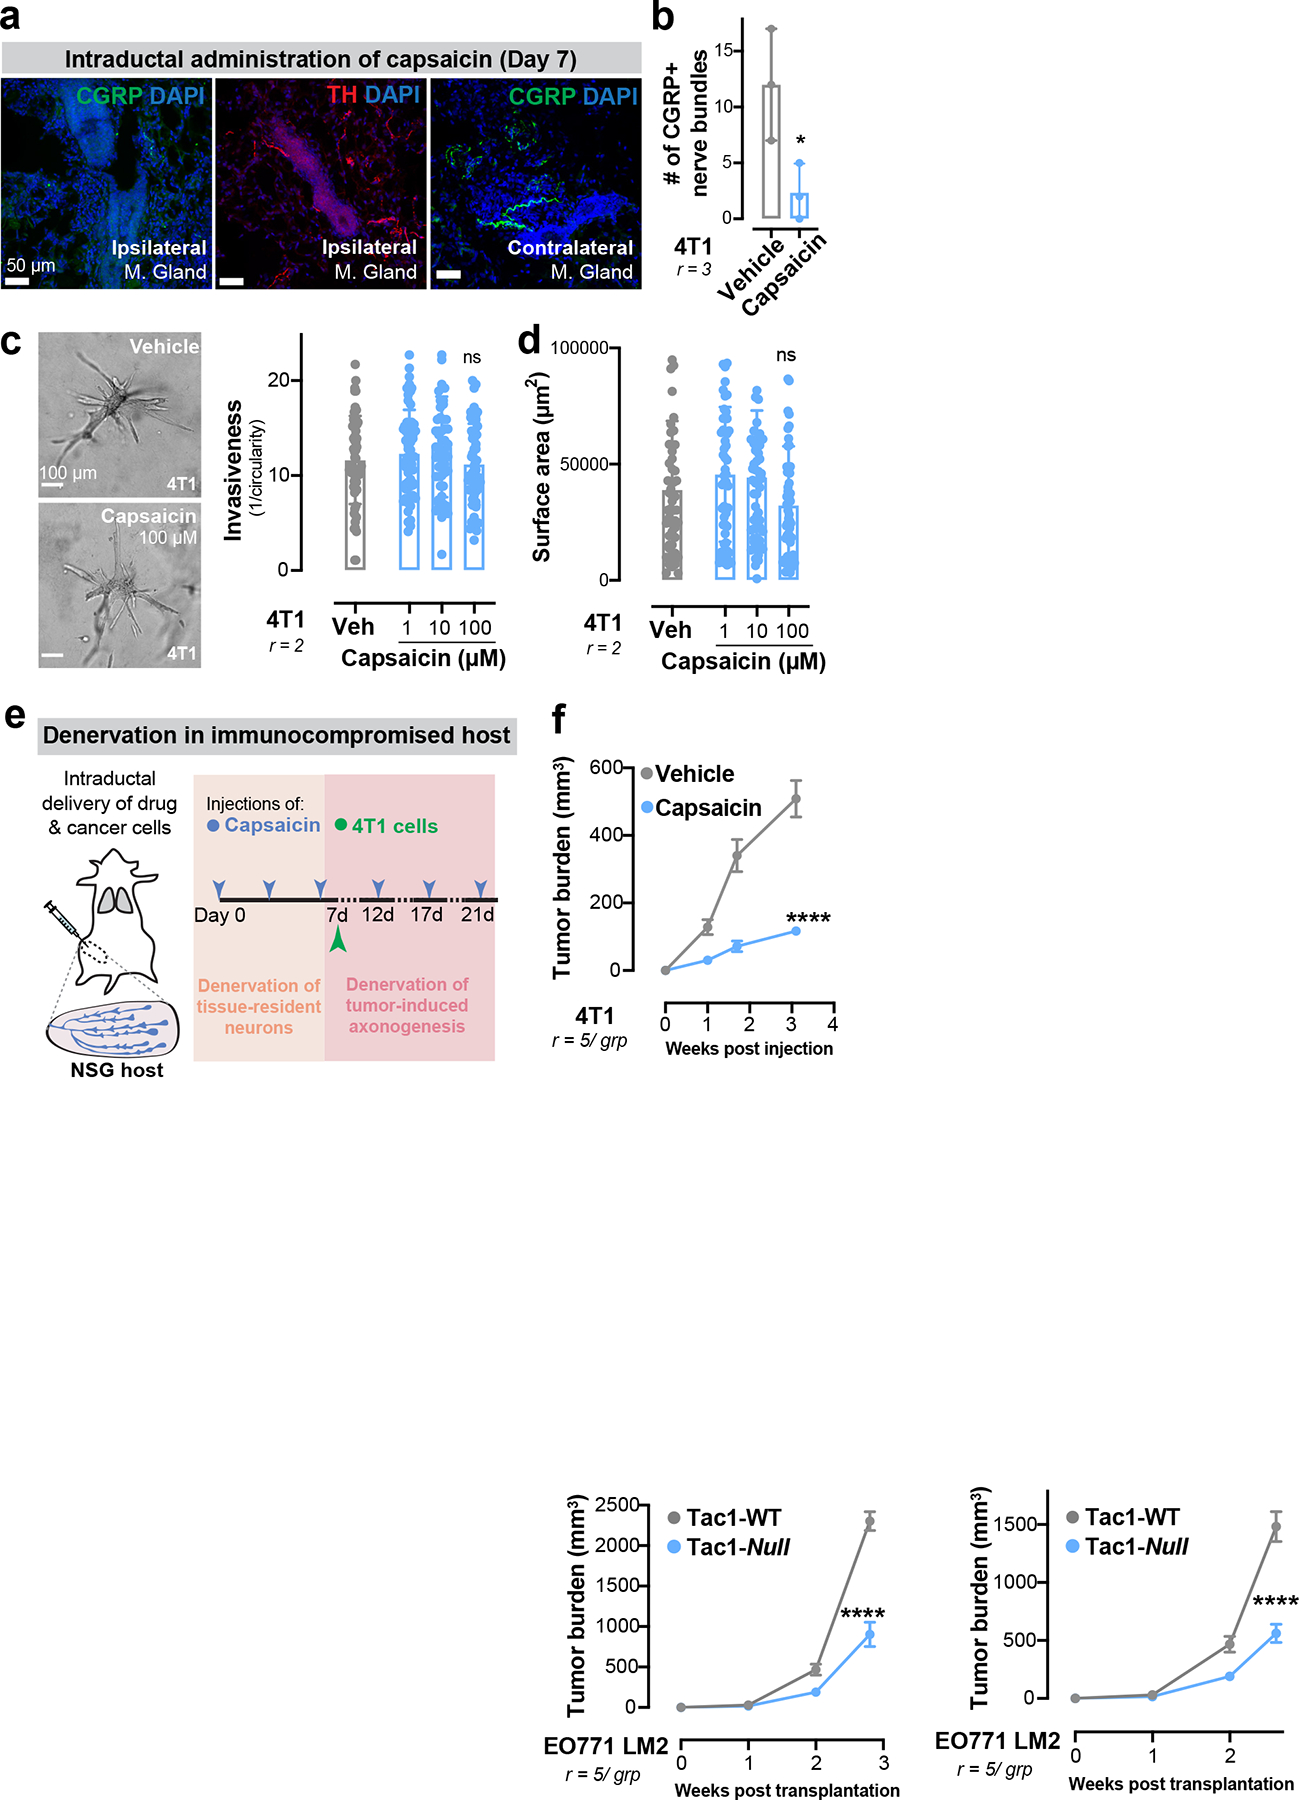
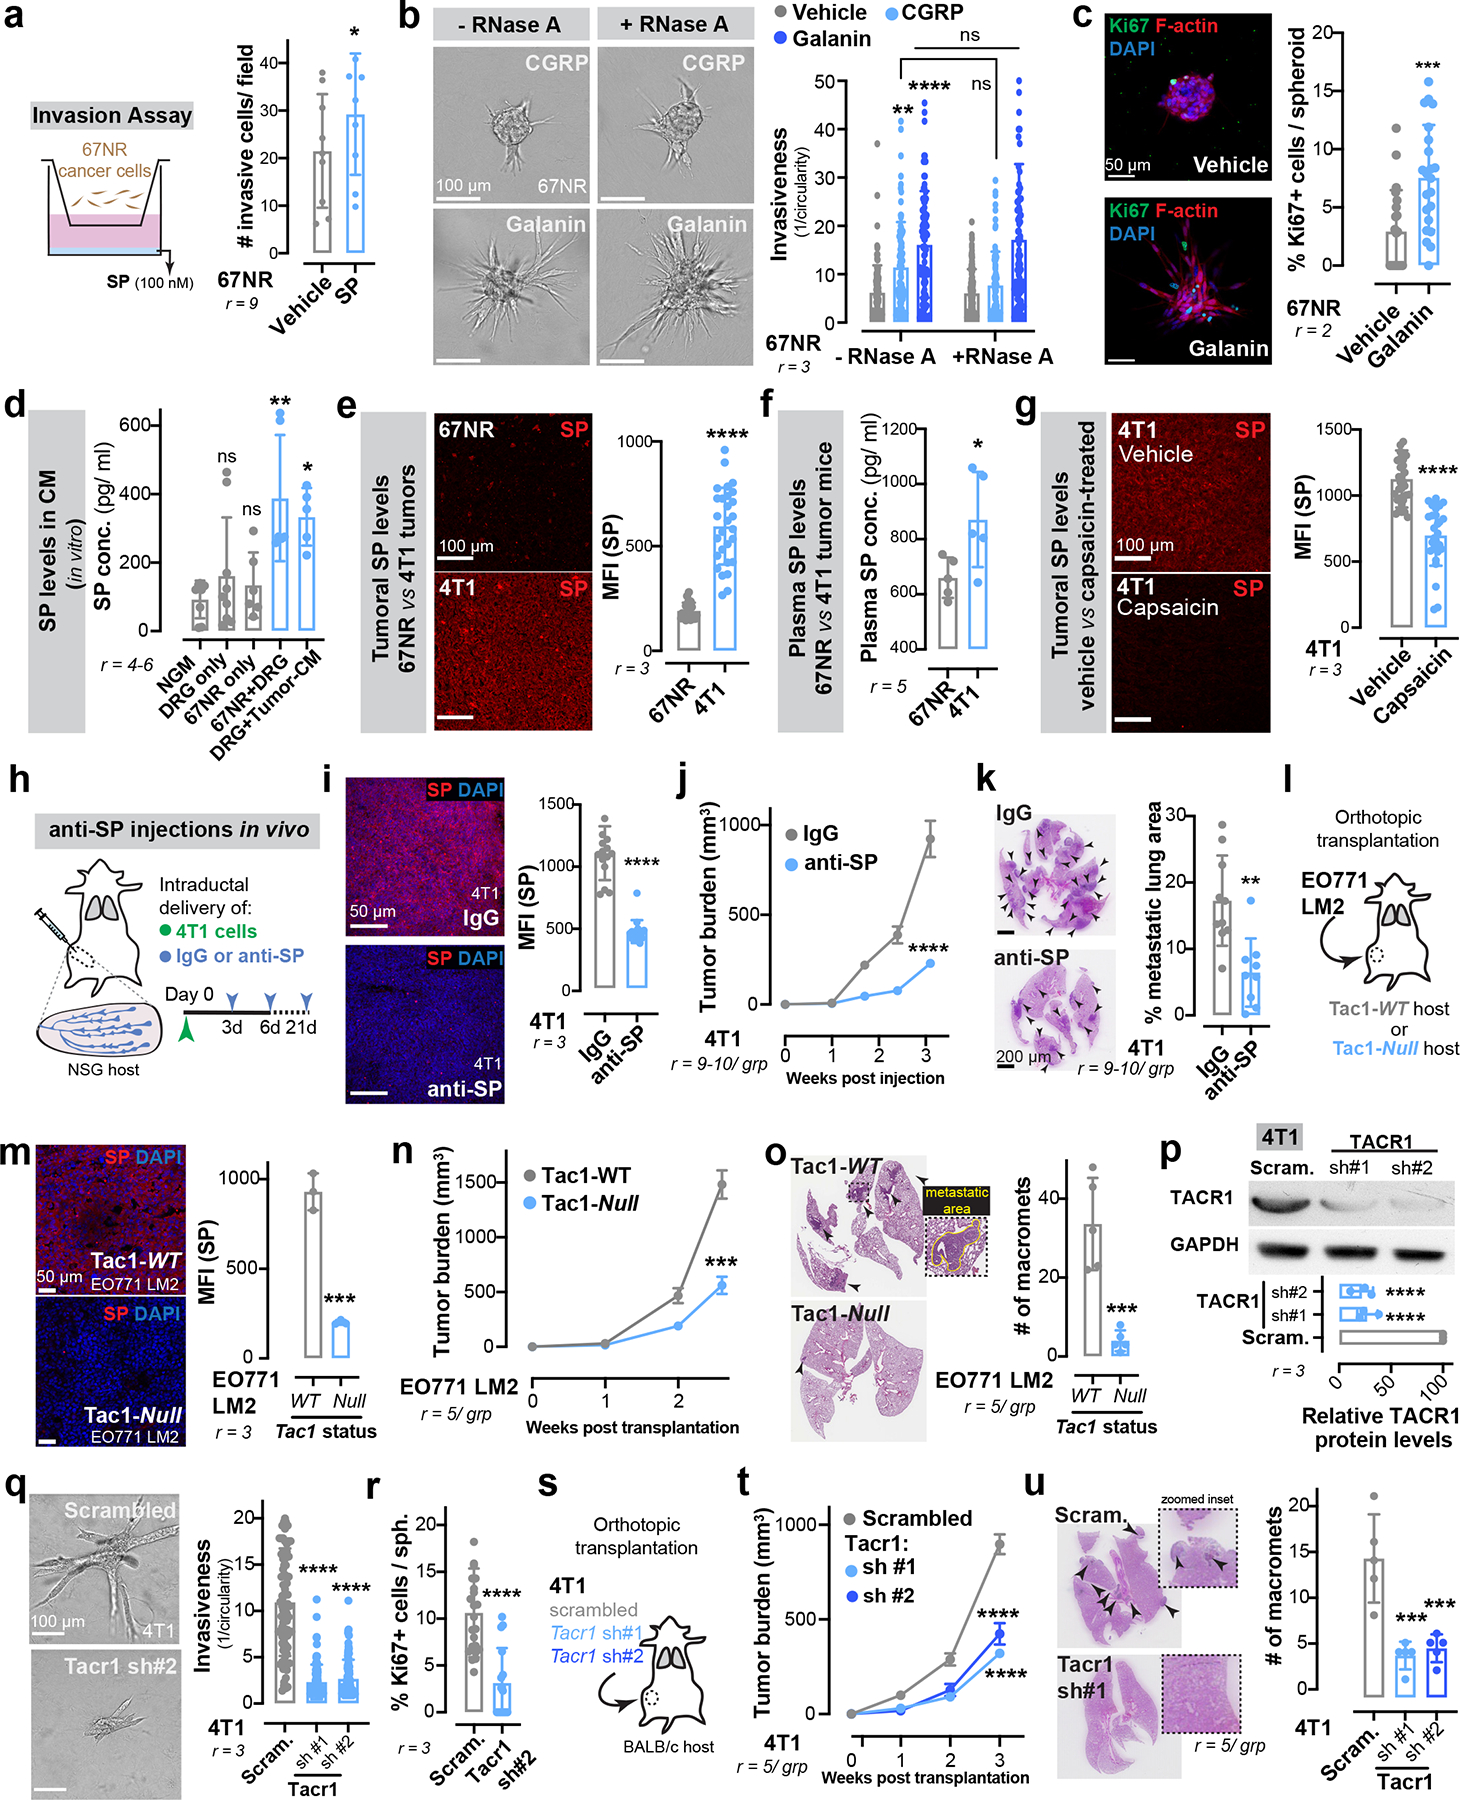
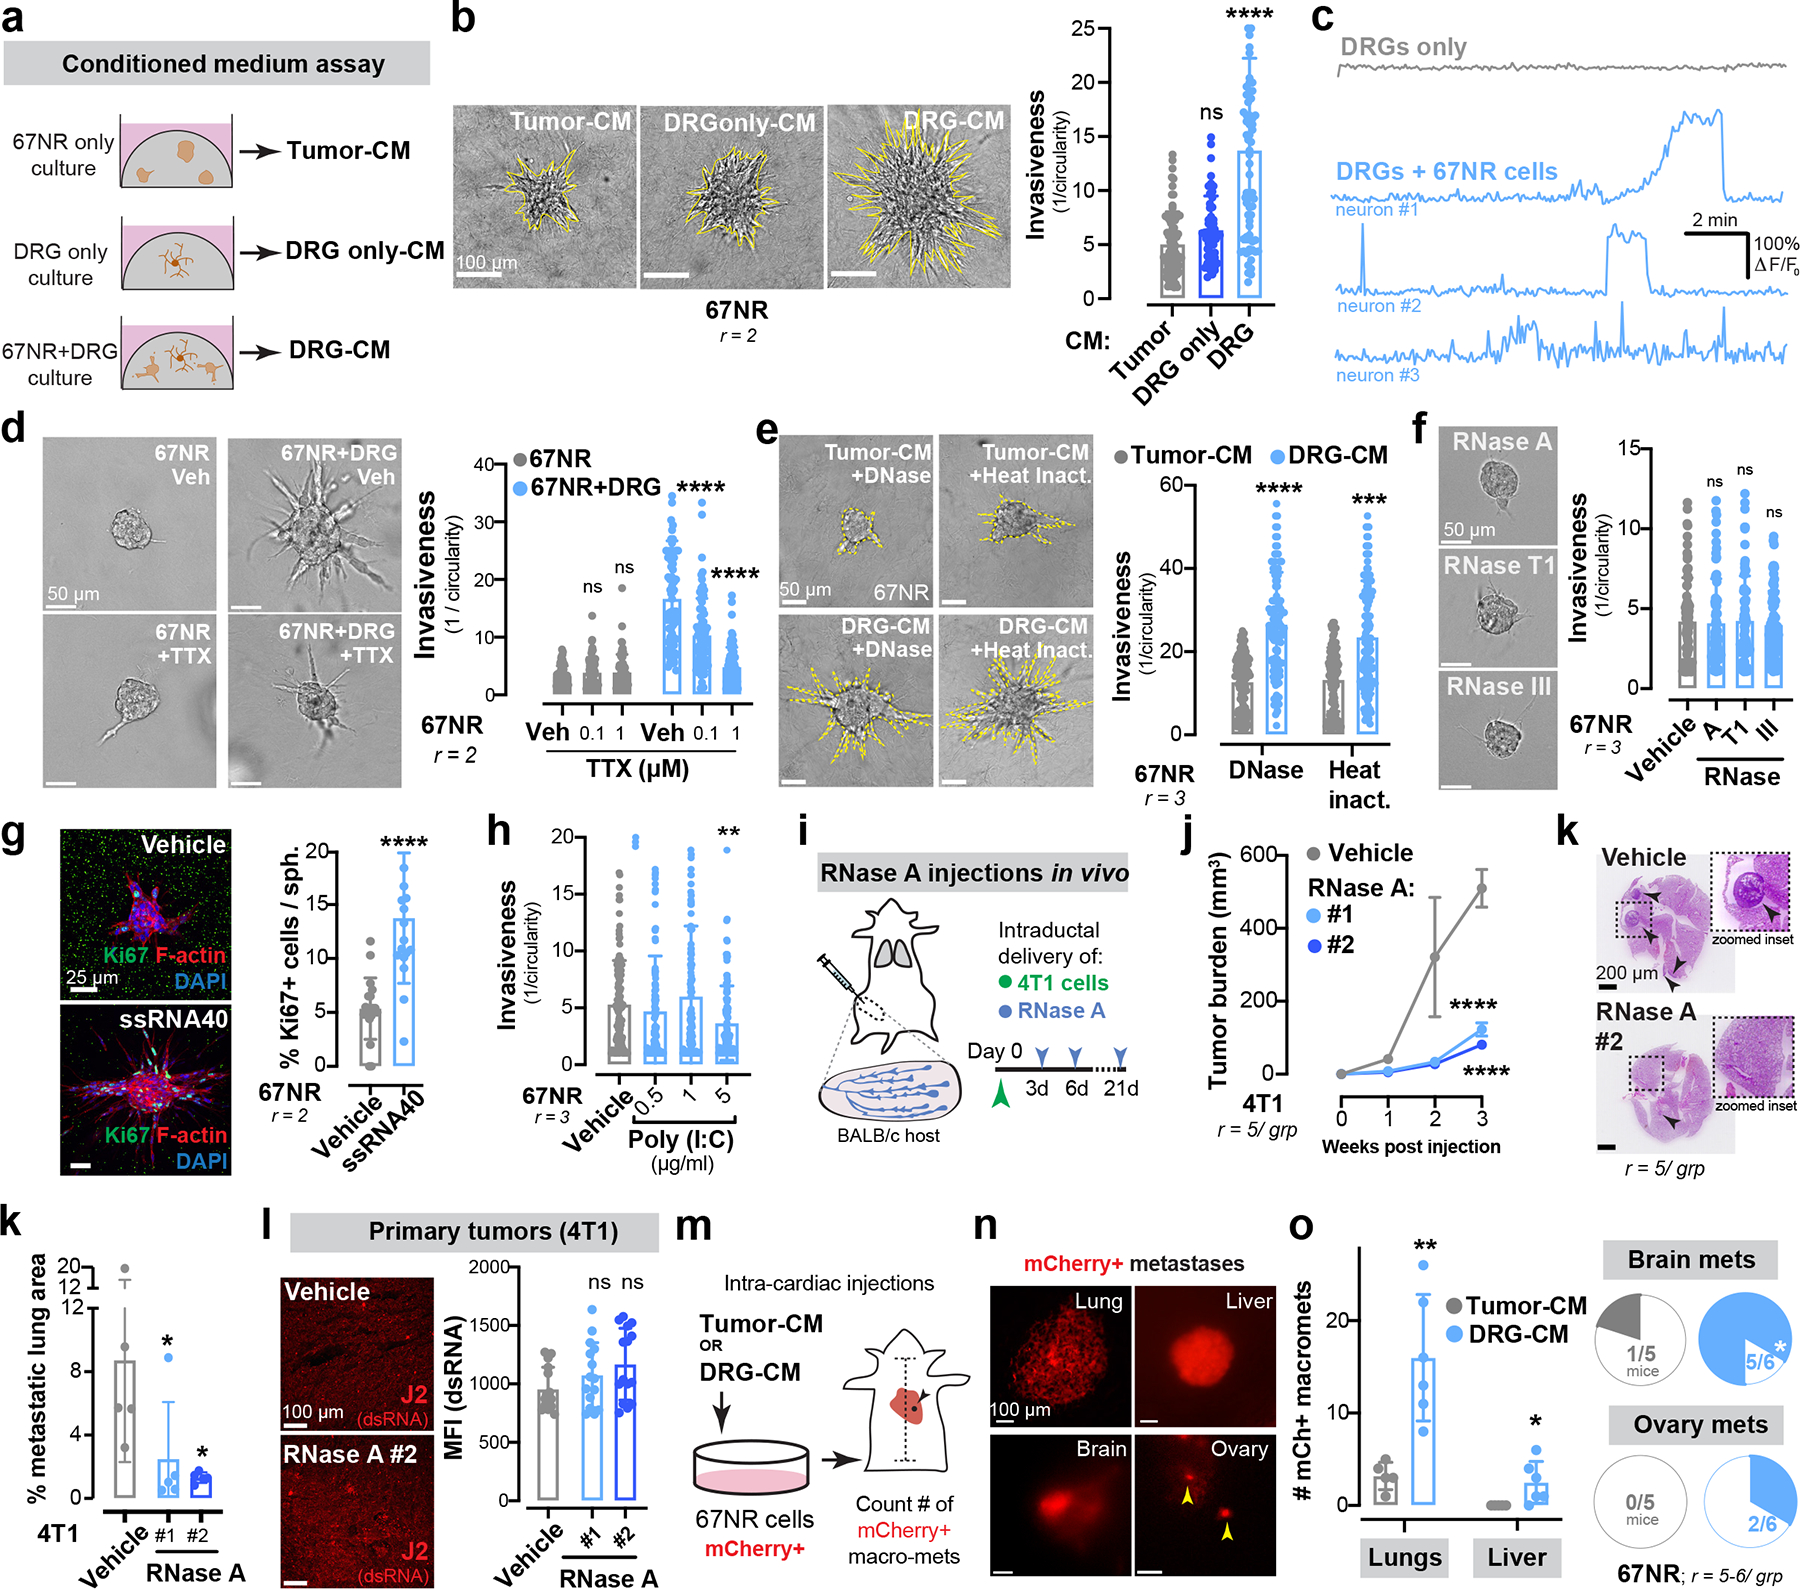
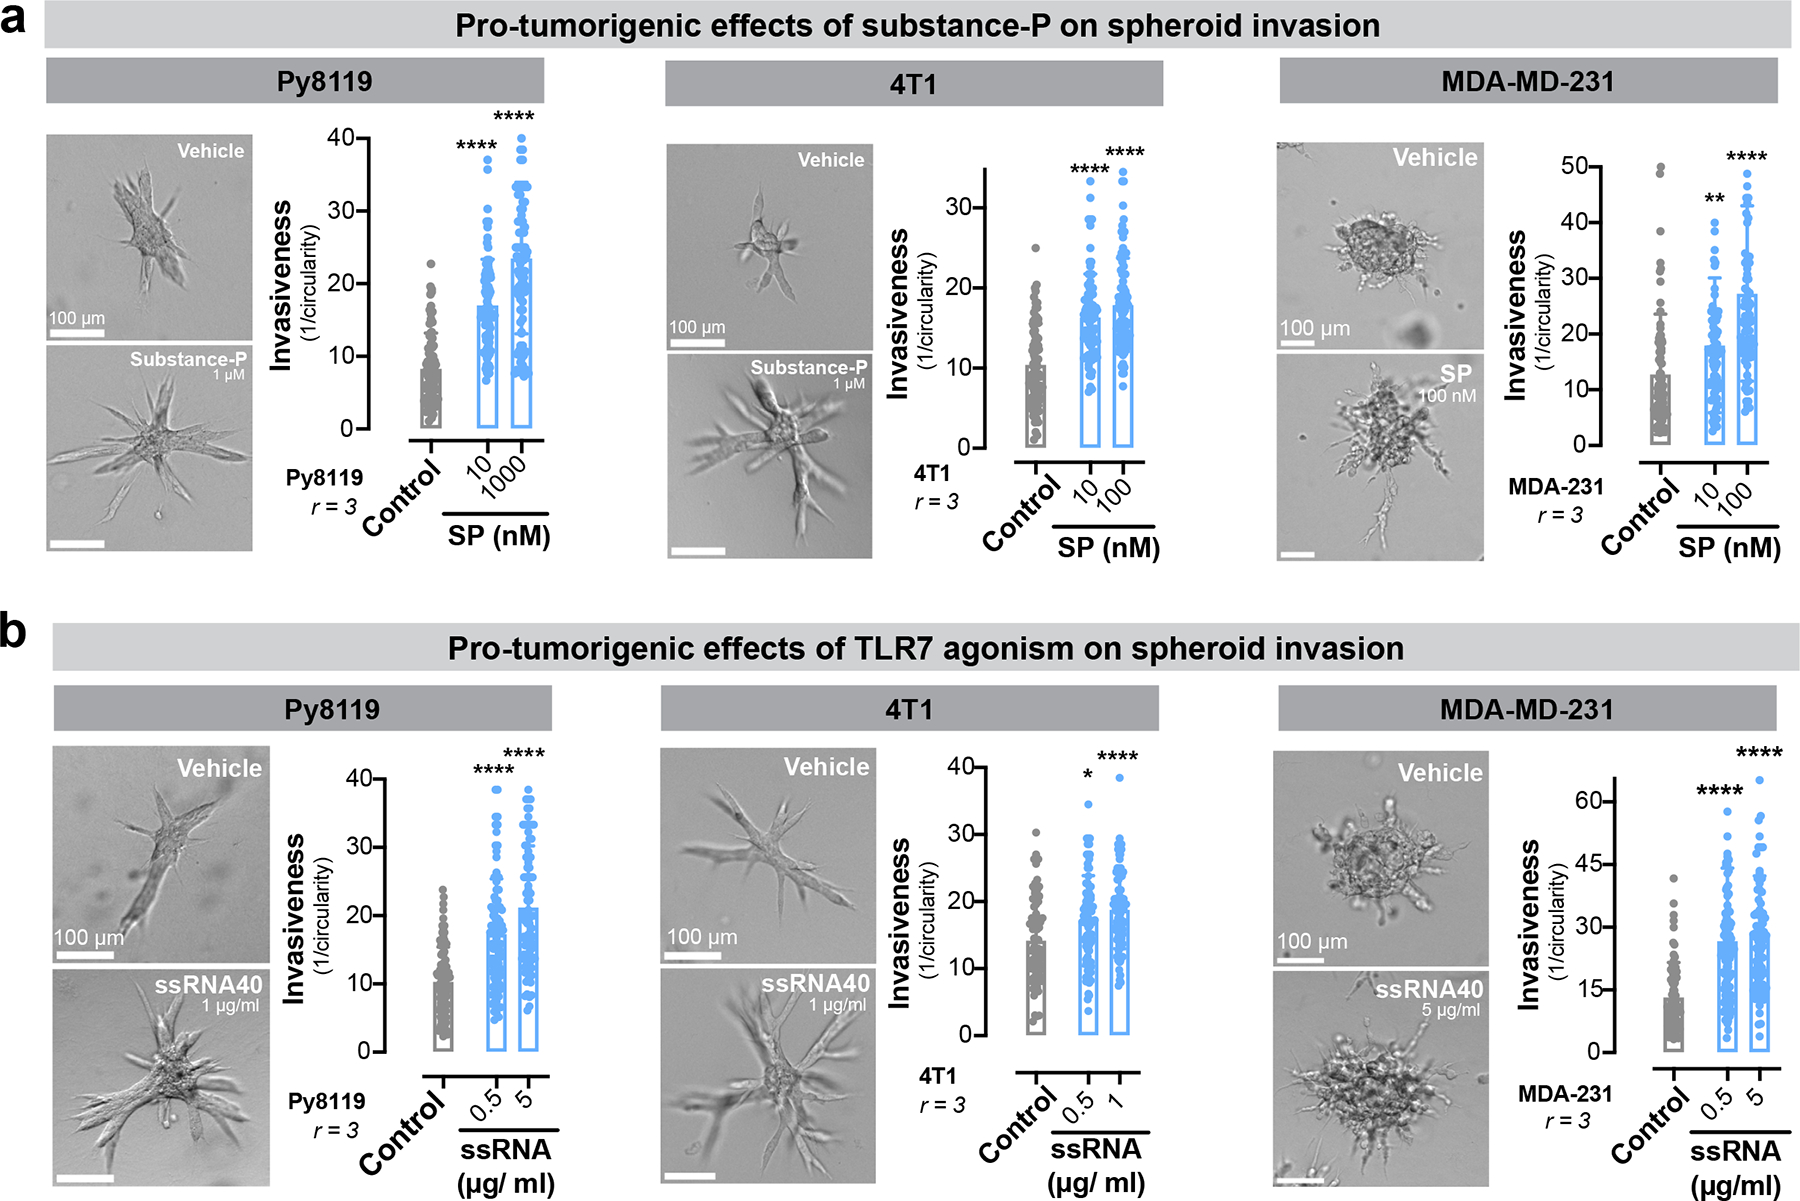
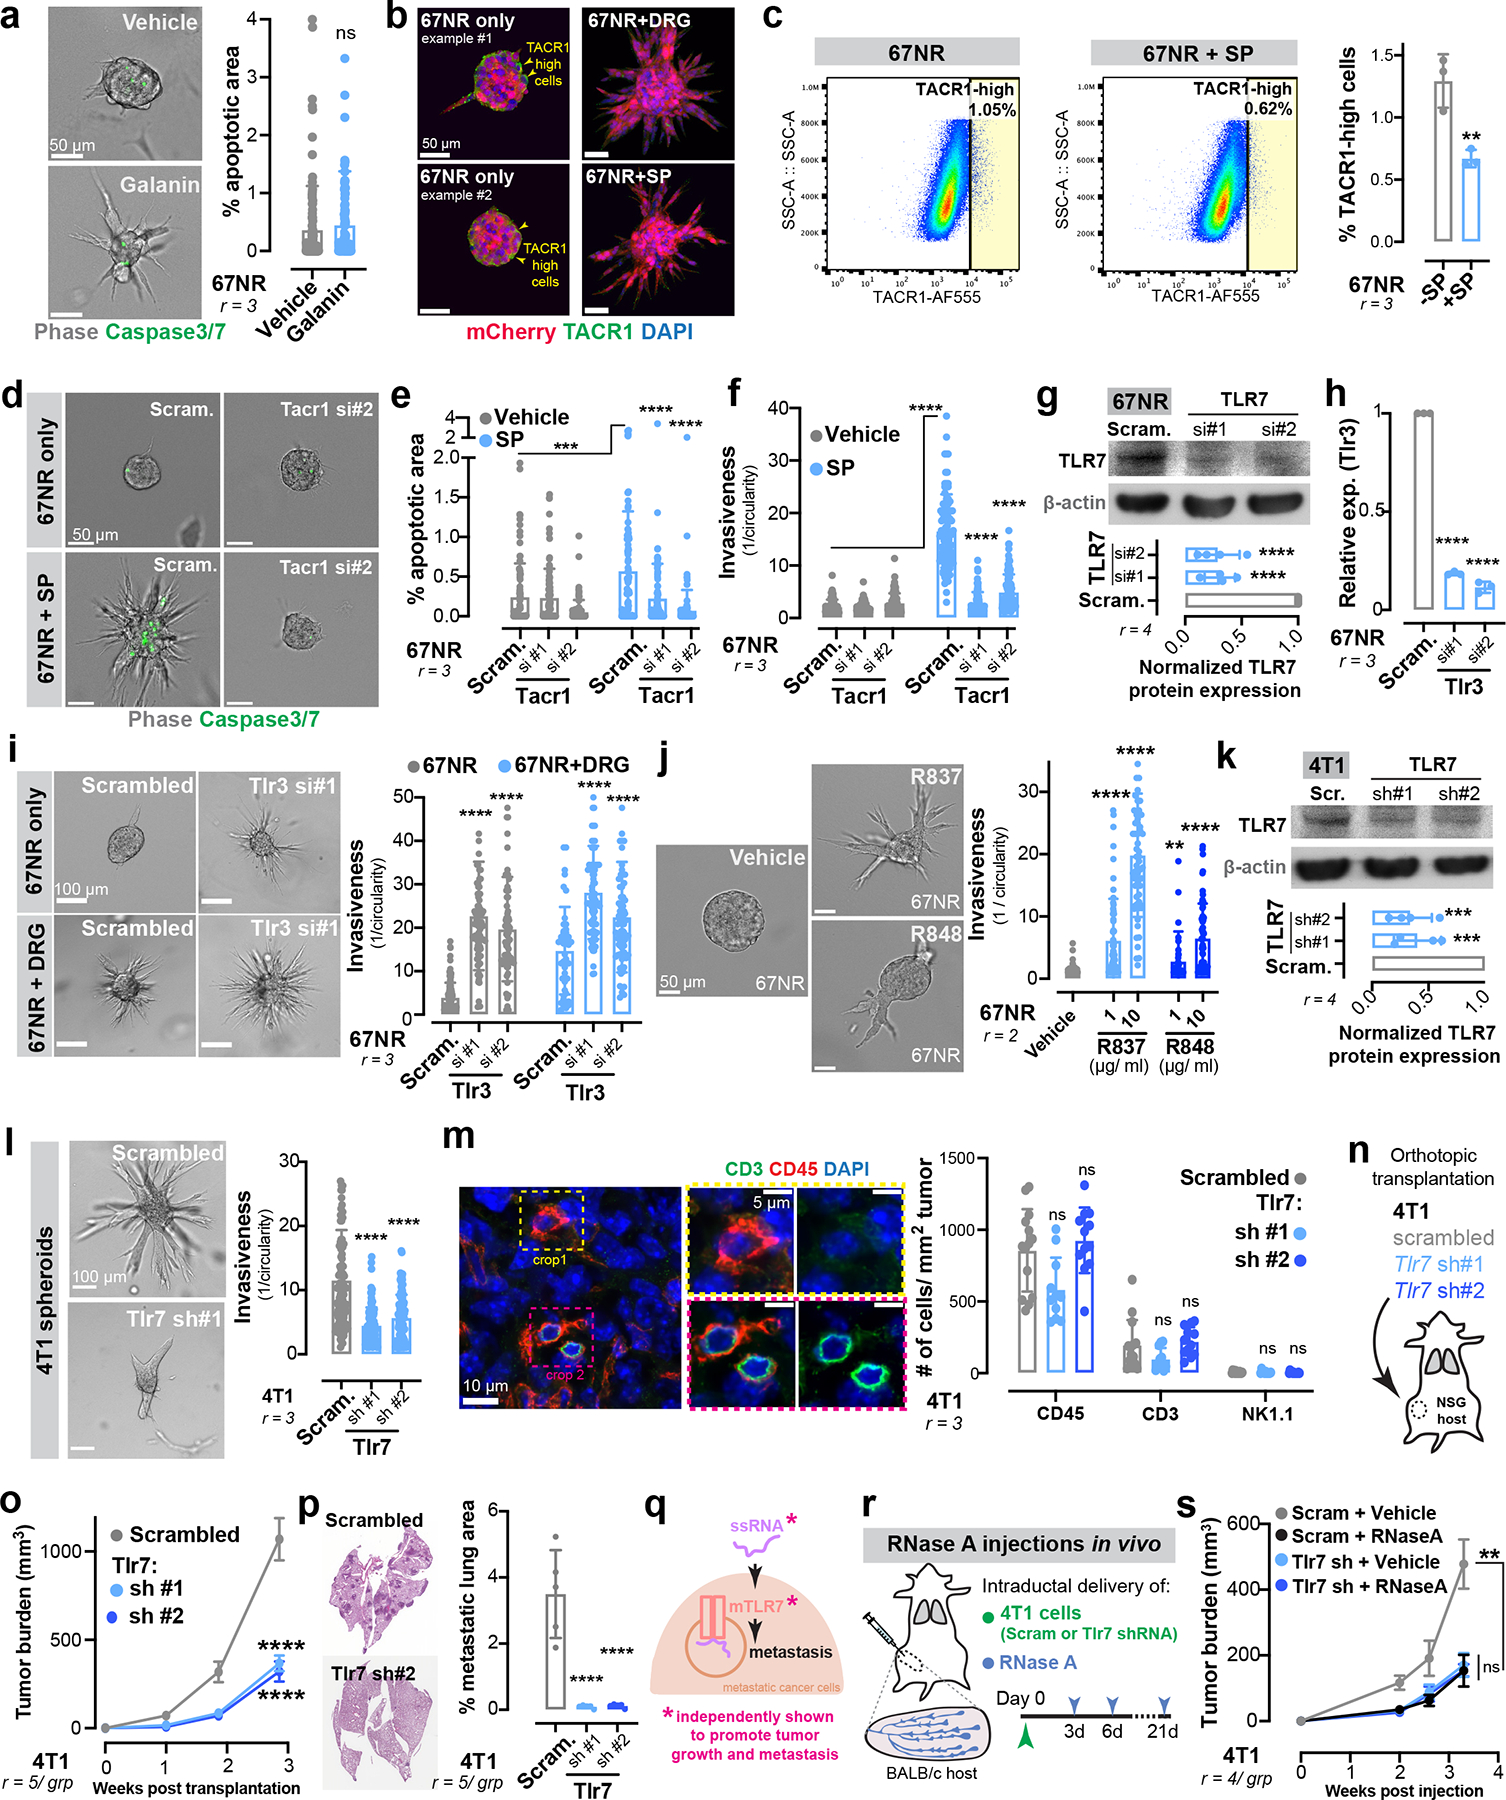
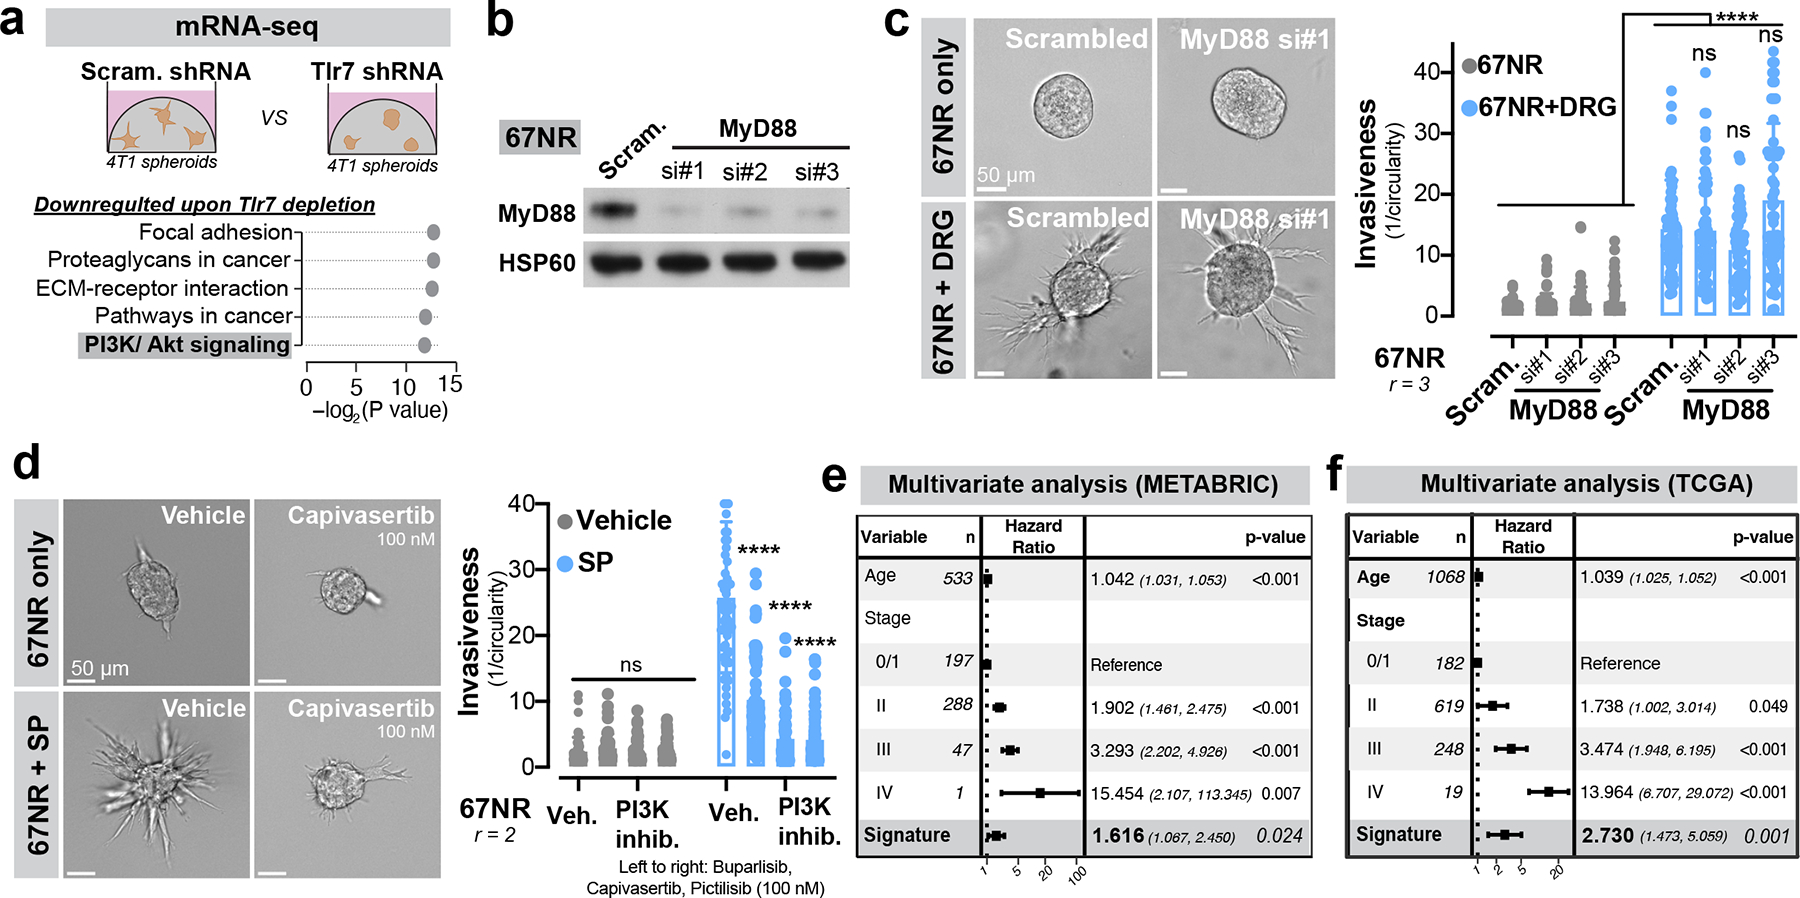
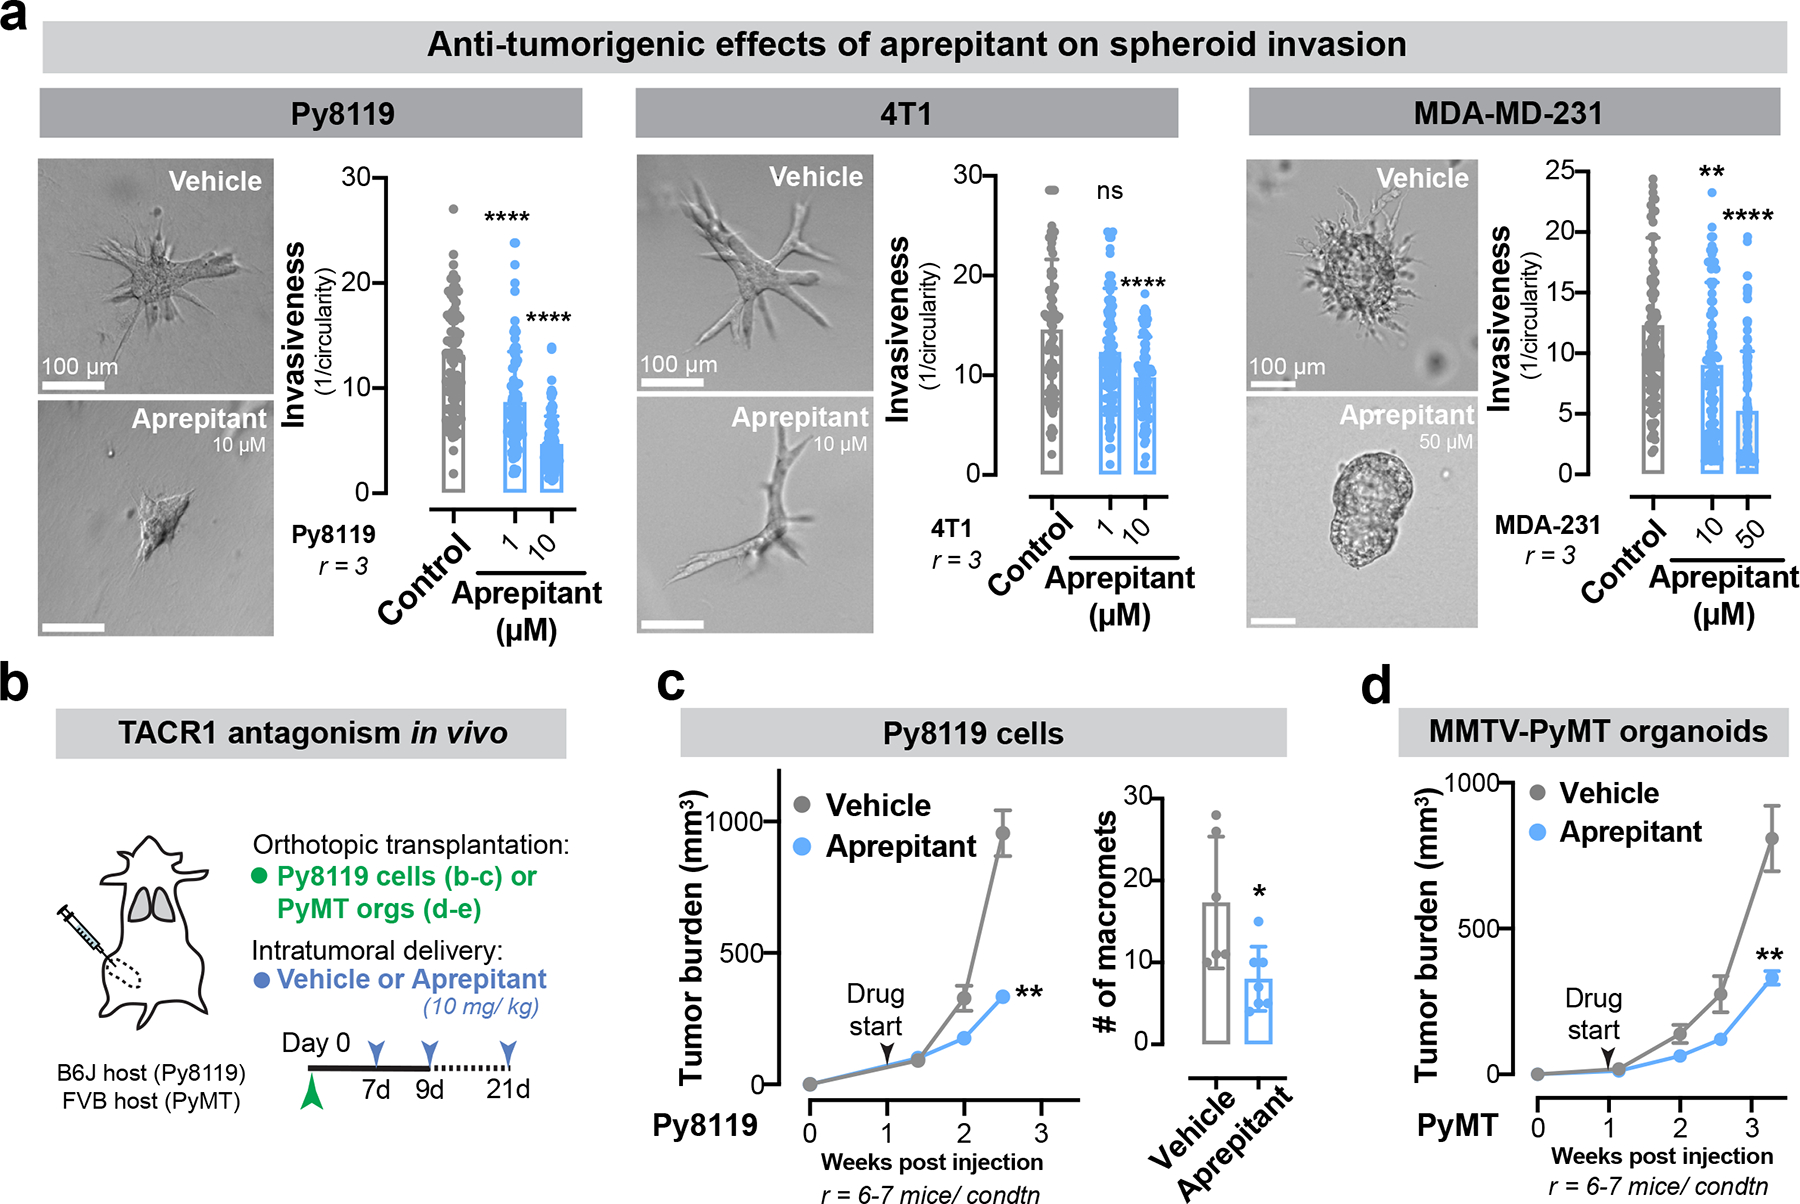
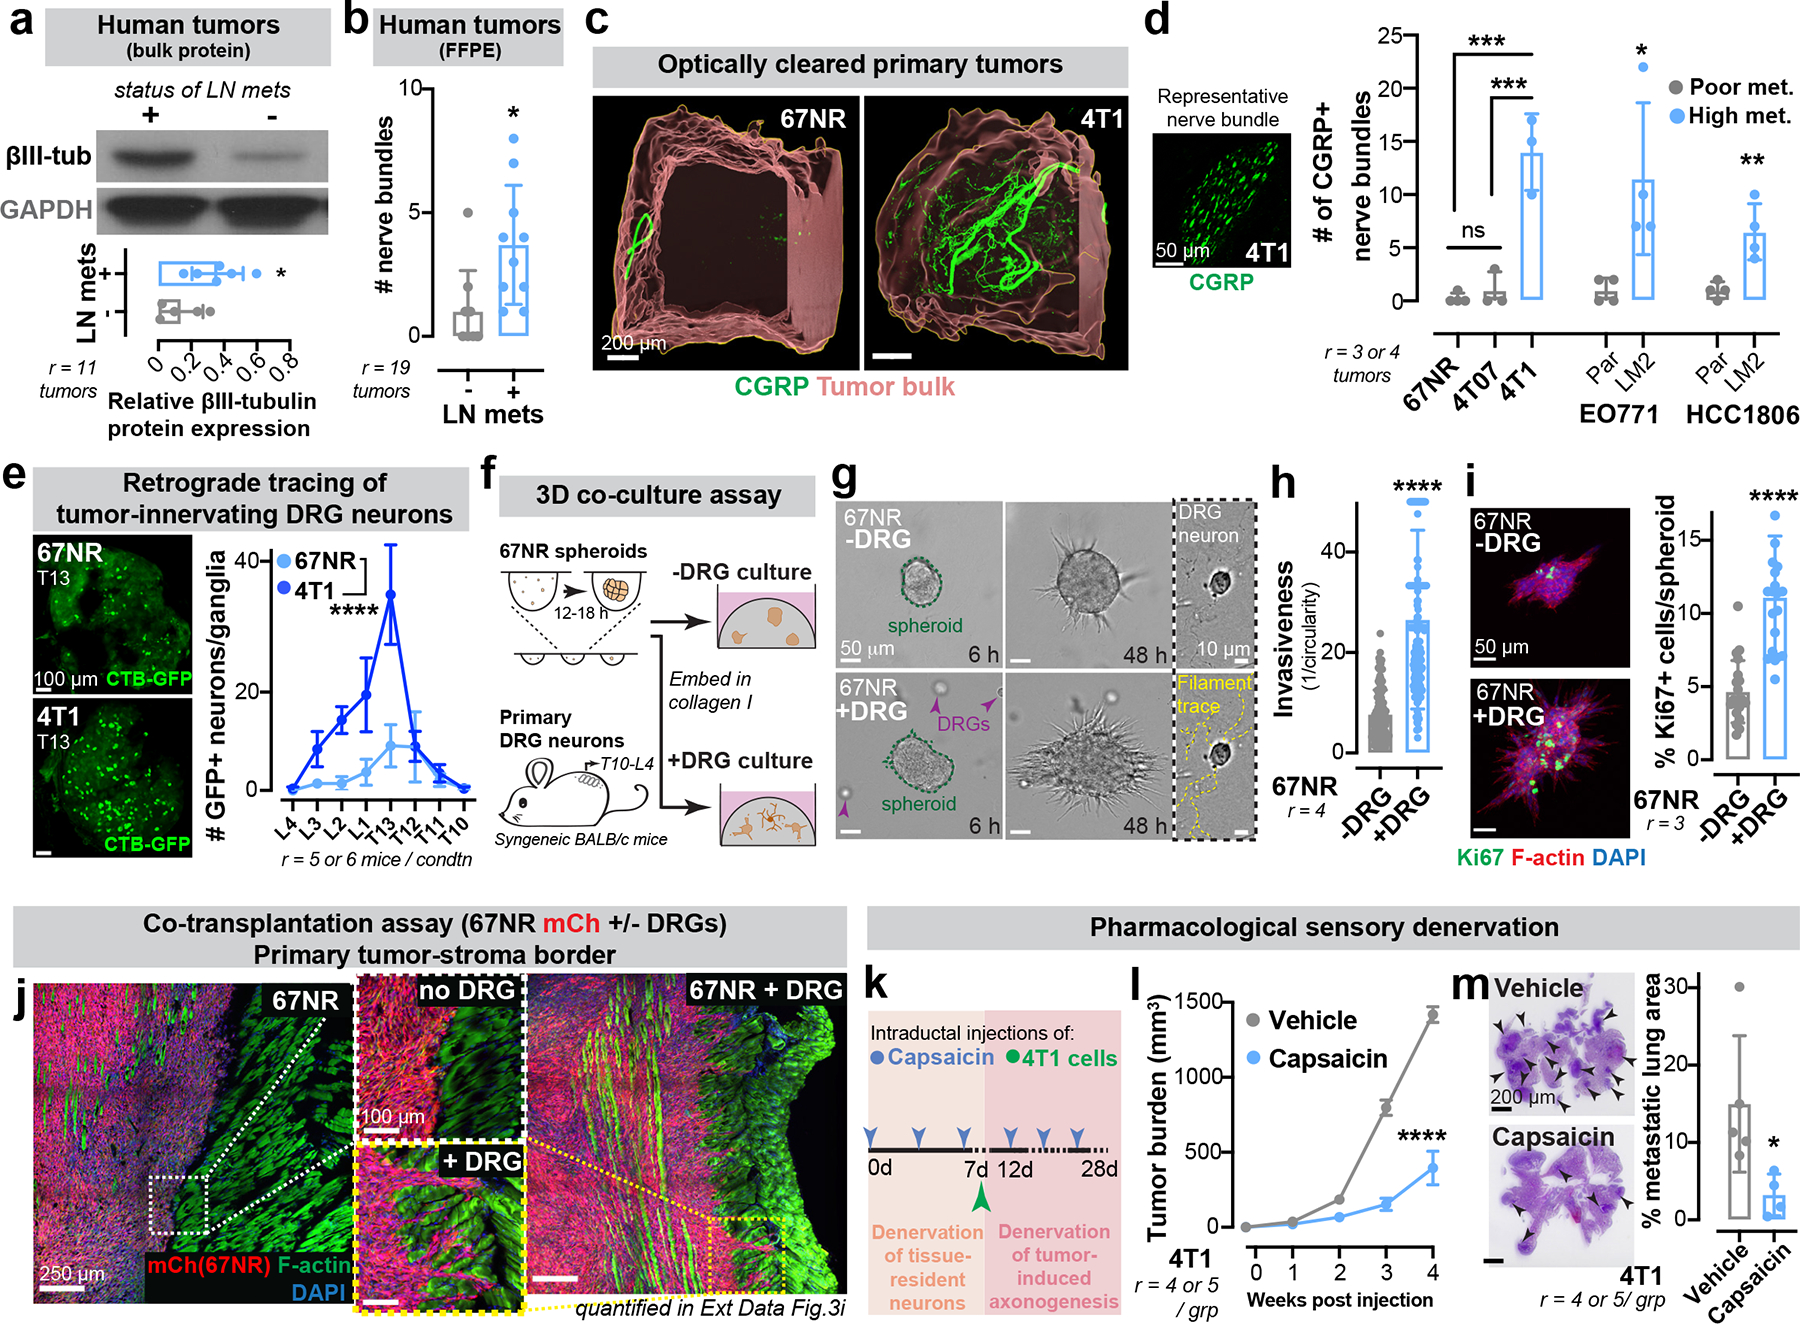
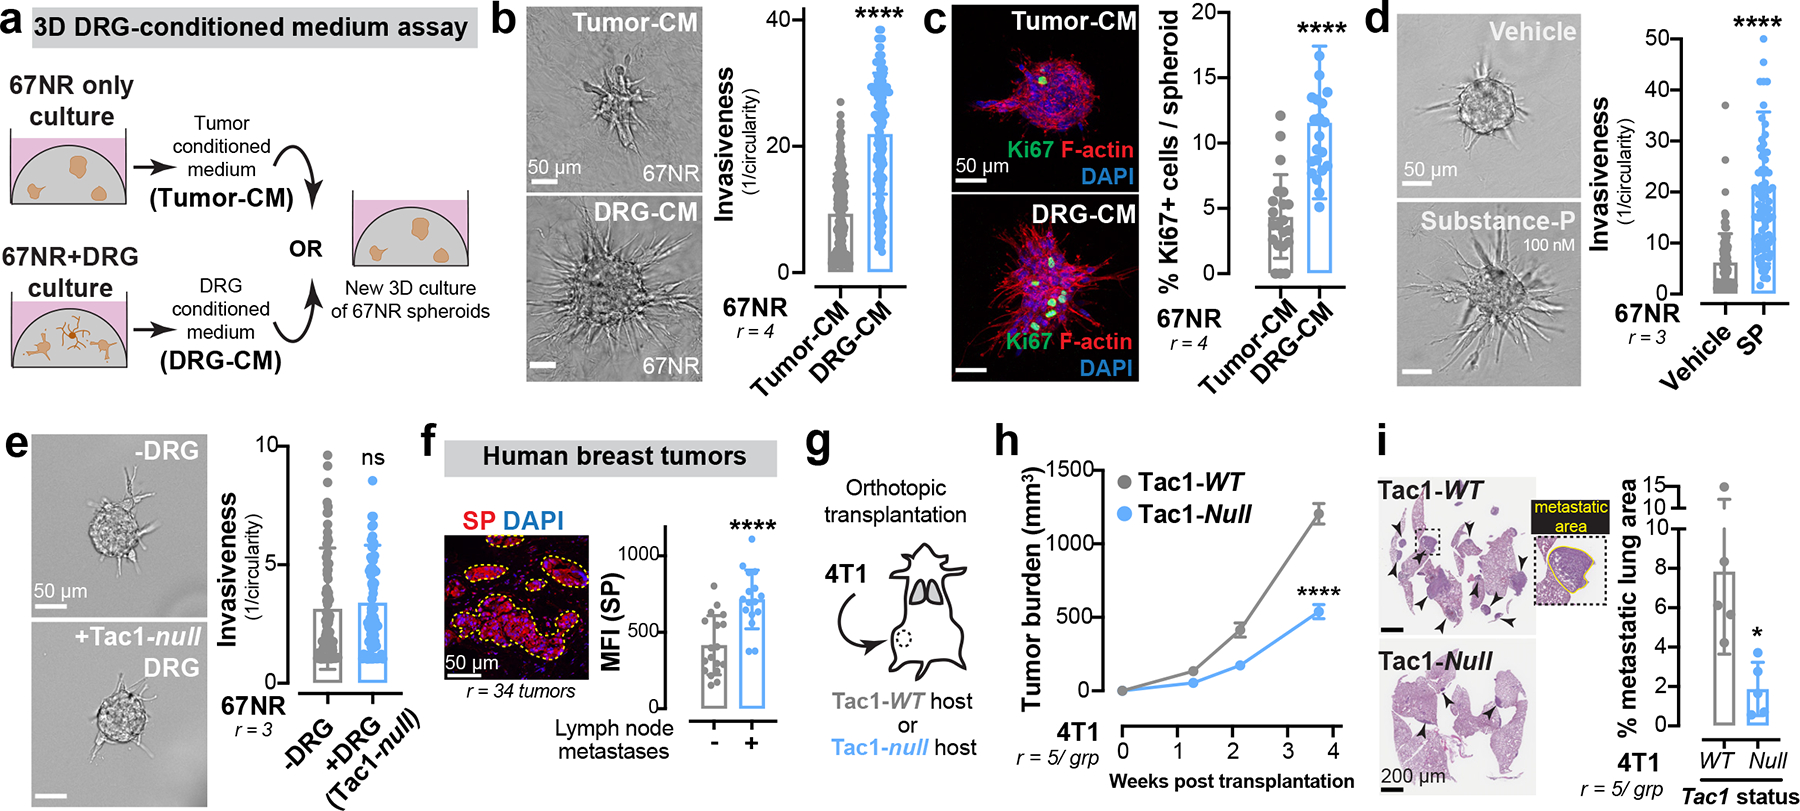
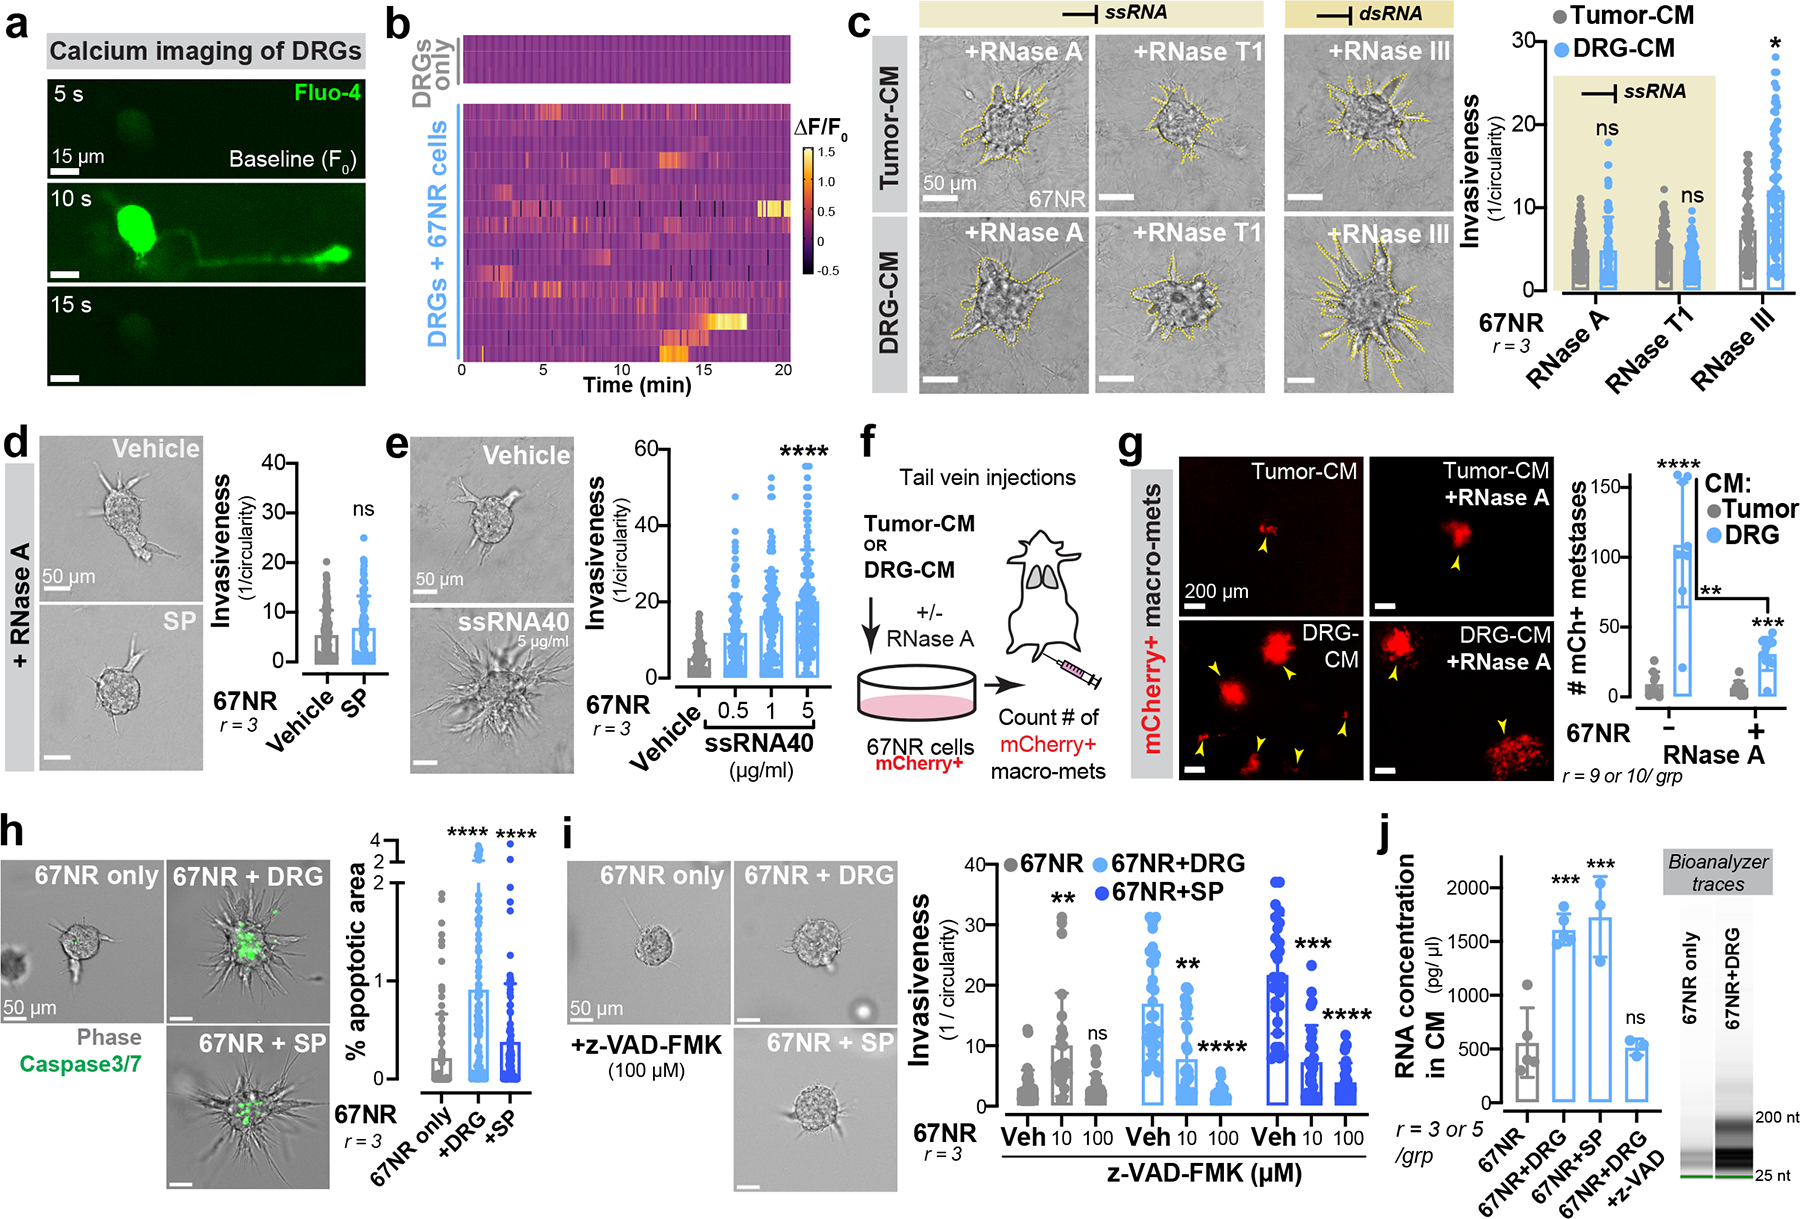
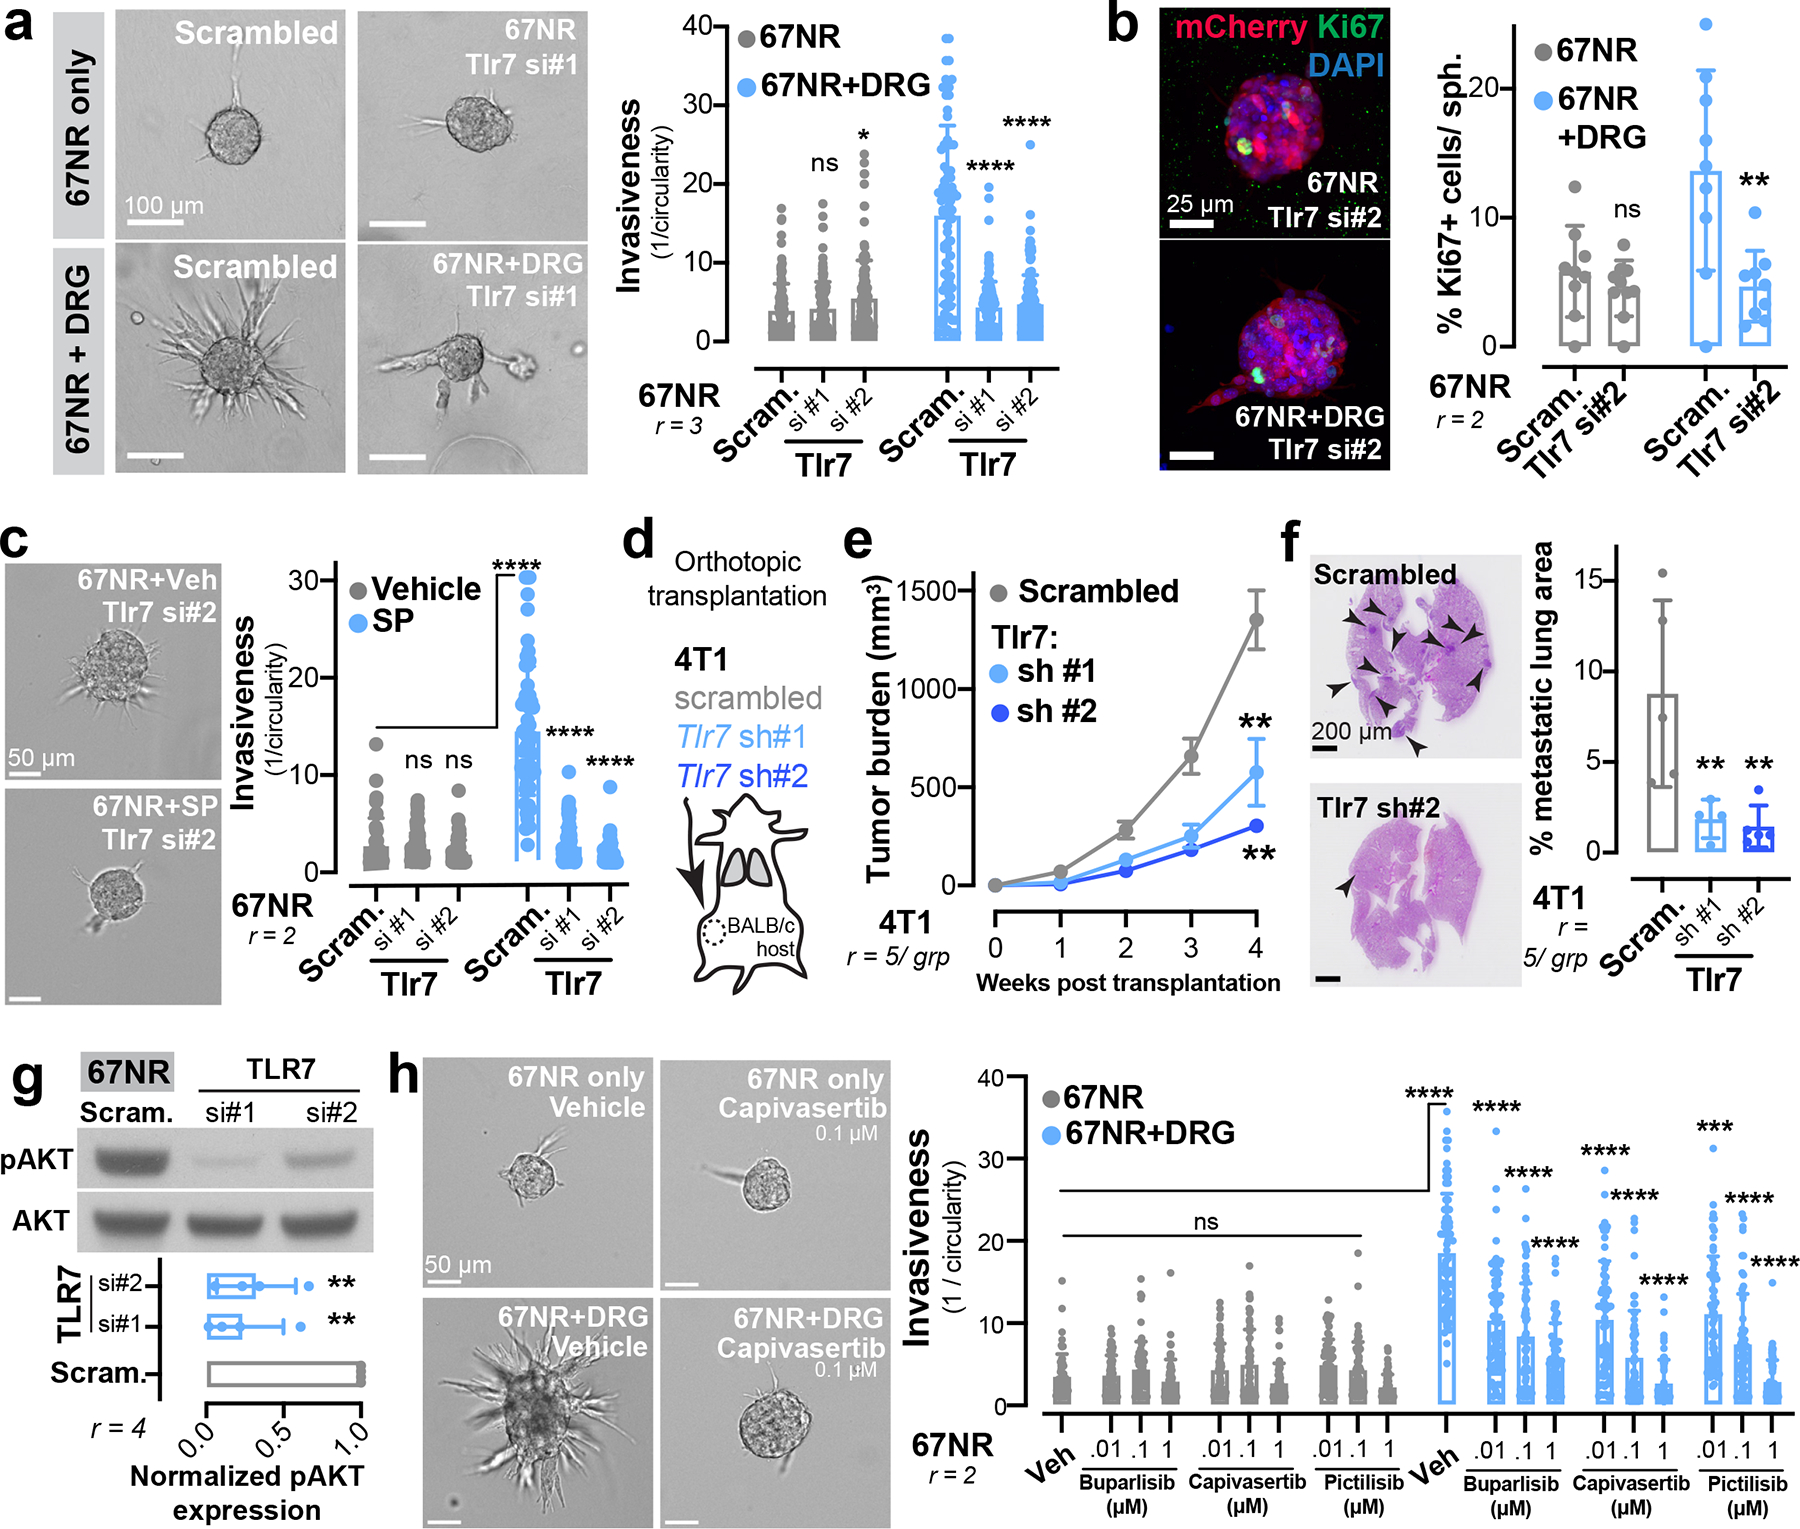
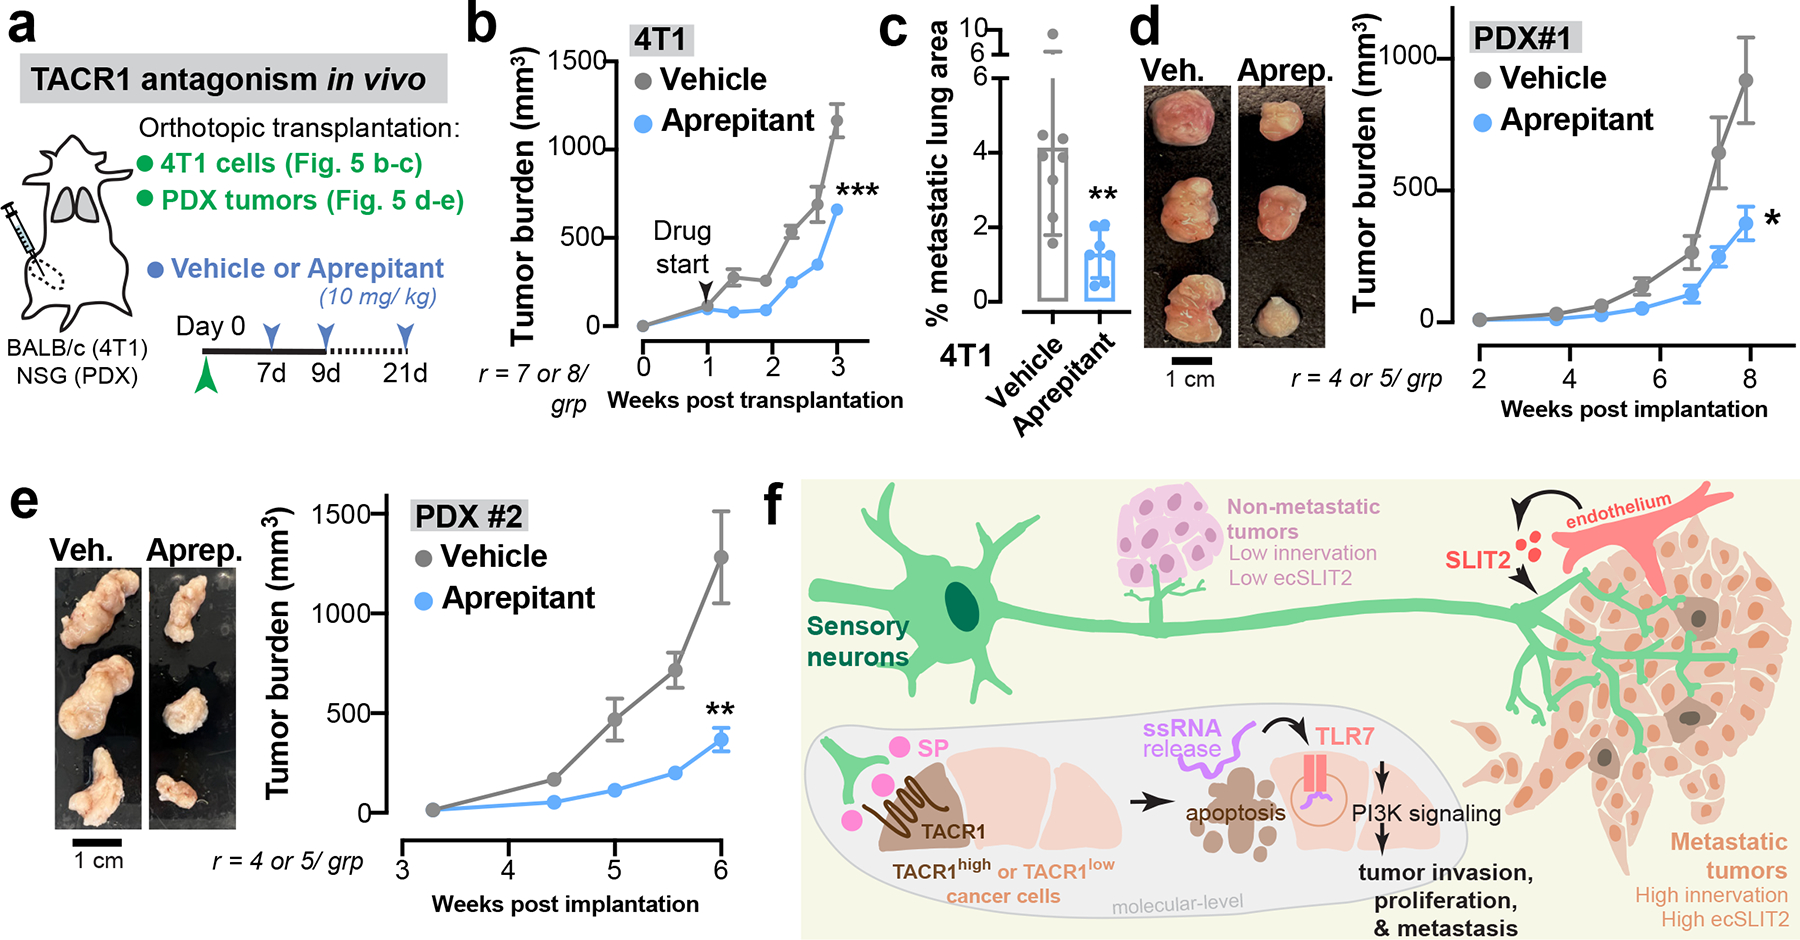
Tumour innervation is associated with worse patient outcomes in multiple cancers1,2, which suggests that it may regulate metastasis. Here we observed that highly metastatic mouse mammary tumours acquired more innervation than did less-metastatic tumours. This enhanced innervation was driven by expression of the axon-guidance molecule SLIT2 in tumour vasculature. Breast cancer cells induced spontaneous calcium activity in sensory neurons and elicited release of the neuropeptide substance P (SP). Using three-dimensional co-cultures and in vivo models, we found that neuronal SP promoted breast tumour growth, invasion and metastasis. Moreover, patient tumours with elevated SP exhibited enhanced lymph node metastatic spread. SP acted on tumoral tachykinin receptors (TACR1) to drive death of a small population of TACR1high cancer cells. Single-stranded RNAs (ssRNAs) released from dying cells acted on neighbouring tumoural Toll-like receptor 7 (TLR7) to non-canonically activate a prometastatic gene expression program. This SP- and ssRNA-induced Tlr7 gene expression signature was associated with reduced breast cancer survival outcomes. Therapeutic targeting of this neuro-cancer axis with the TACR1 antagonist aprepitant, an approved anti-nausea drug, suppressed breast cancer growth and metastasis in multiple models. Our findings reveal that tumour-induced hyperactivation of sensory neurons regulates multiple aspects of metastatic progression in breast cancer through a therapeutically targetable neuropeptide/extracellular ssRNA sensing axis.


Conflict of interest statement

COMPETING INTERESTS

The authors declare no competing interests.

Figures

Extended Data Figure 1:
Extended Data Figure 1:. Breast tumours are frequently innervated by sensory nerves
(a) We previously uncovered a requirement for endothelial-derived SLIT2 (ecSLIT2) in metastasis. (b) Quantification of ecSLIT2 expression in poorly vs highly metastatic breast tumour models. ****p < 0.0001, Mann-Whitney test. Mean ± SD. (c-d) Quantification of total (c) and CGRP+ sensory (d) innervation in 4T1 tumours grown in ecSLIT2 knockout (endothelial-specific depletion of SLIT2) mice. **** p < 0.0001, *p = 0.0489, t-test. Mean ± SD. (e) Quantification of innervation in SLIT2-knockout mammary tumours in Slit2fl/fl; MMTV-PyMT; MMTV-Cre mice. nsp = 0.6414, Mann-Whitney test. Mean ± SD. (f) Kaplan-Meier plots showing distant metastasis-free survival (DMFS) of breast cancer patients sorted by the median expression level of βIII-tubulin (mRNA, protein) or PGP9.5 (mRNA) of their tumours. The x-axes were set to have >10 surviving patients in each arm. (f) Nerve bundle abundance in highly metastatic primary tumours relative to corresponding isogenic poorly metastatic tumours. Between 4 and 8 tumours were analysed per group. **p (67NR vs 4T1) = 0.001, **p (4T07 vs 4T1) = 0.0019, nsp (67NR vs 4T07) = 0.9095, ANOVA; **p (EO771 Par vs LM2) = 0.0065, *p (HCC1806 Par vs LM2) = 0.0159, Mann-Whitney test. Mean ± SD. (g) Expression of pan-neuronal βIII-tubulin in 67NR vs 4T1 primary tumours, stroma-depleted primary tumour organoids, or cell lines. **p = 0.0048, t-test. Mean ± SD. MW: βIII-tubulin (50 kDa). (h) Liver metastasis from a 4T1 tumour-bearing mouse immuno-stained for nerve fibres. r = 3/group. (i) Retrograde tracing of DRG neurons innervating abdominal mammary glands of wild-type mice. Mean ± SEM. (k-l) Sensory, CGRP+ innervation observed within the normal murine mammary gland (k), murine models of breast cancer (l), and primary human tumours (l). r = 3 tumours/ group.
Extended Data Figure 2:
Extended Data Figure 2:. Sensory neurons promote cancer invasion and proliferation across multiple ex vivo murine and human models of breast cancer
(a) Frequency of apoptosis (cleaved caspase 3, CC3+) in DRG neurons cultured alone or in the presence of 67NR cancer cells. (b) Micrographs of mCherry+ 67NR spheroids co-cultured with βIII-tubulin+ DRG neurons. Neuron and spheroid boundaries are manually traced to illustrate little physical contact. n = 10 ROIs/ group, r = 4. (c) 2D invasion assay of 67NR cancer cells that were cultured alone or in the presence of primary DRG neurons. *p = 0.0432, t-test. Mean ± SD. (d) Quantification of the number of mitotically active cells within regions of 4T1 primary tumours adjacent to or far away from a nerve bundle. **p = 0.0043, Mann-Whitney test. Mean ± SD. (e-f) 3D colony formation assay. 67NR cancer cells were cultured alone or in the presence of DRG neurons in 3D Matrigel. (e) Schematic. (f) Quantification. **p = 0.0067, Kruskal-Wallis test. Mean ± SD. (g-i) 3D co-culture assays of MMTV-PyMT mammary tumour organoids and primary DRG neurons. (g) Schematic. (h) Invasion assay. ****p < 0.0001, Mann-Whitney test. (i) Colony formation assay. **p = 0.0033, t-test. Mean ± SD. (j-m) 3D co-culture assays of 4 independent primary human breast tumours and DRG neurons. (j) Schematic of organoid isolation. (k) Invasion quantification. ****p < 0.0001, *p = 0.0266, Mann-Whitney test. Mean ± SD. (l) Proliferation quantification. ****p < 0.0001, *p = 0.0401 (#2), 0.0267 (#4), t-test. Mean ± SD. (m) Basic de-identified clinical information for human tumour samples cultured.
Extended Data Figure 3:
Extended Data Figure 3:. Co-transplantation of breast cancer cells with DRG neurons drives metastasis
(a-h) Co-transplantation of mCherry+ (mCh) 67NR cancer cells and DRG neurons. (a) Schematic. (b) Optically cleared 67NR tumours transplanted with or without DRG neurons and immunostained for CGRP+ sensory nerves. r = 2 tumours/ group. (c) Mean fluorescence intensity (MFI) for SP in 67NR primary tumours transplanted with or without DRG neurons. **p = 0.0046, t-test. Mean ± SD. (d) Tumour growth. **p = 0.0017, t-test. Mean ± SEM. (e) Percentage of the tumour-stroma boundary with a pushing vs invasive morphology. ****p < 0.0001, Chi-square test. (f) Association of mCh+ 67NR cancer cells with the lung endothelium in mice transplanted with orthotopic 67NR tumours. r = 3 lungs/ group. (g) CTC enumeration in mice transplanted with mCh+ 67NR cancer cells with or without DRG neurons. *p = 0.0287, t-test. Mean ± SD. (h) mCh+ micro-metastases. **p = 0.0079, Mann-Whitney test. Mean ± SD. (i) Co-transplantation of 67NR cancer cells with increasing numbers of DRG neurons. nsp = 0.4124, **p = 0.0026, ****p < 0.0001, ANOVA. Mean ± SEM.
Extended Data Figure 4:
Extended Data Figure 4:. Sensory neurons drive metastatic colonization in multiple breast cancer models.
(a-c) Tail vein injections of mCh+ 67NR cancer cells with or without DRG neurons. (a) Schematic. (b) CGRP+/ βIII-tubulin+ neuronal cell bodies in mice co-injected with DRG neurons. r = 3 lungs/ group. (c) mCh+ metastases. ****p < 0.0001, Mann-Whitney test. Mean ± SD. (d-f) Co-transplantation of EO771 cancer cells and DRG neurons. (d) Schematic. (e) Tumour growth. *p = 0.0345, t-test. Mean ± SEM. (f) Number of micro-metastases counted by H&E. *p = 0.0249, t-test. Mean ± SD.
Extended Data Figure 5:
Extended Data Figure 5:. Capsaicin does not alter growth or invasion of cancer cells in vitro and reduces tumour growth in immune-compromised mice in vivo
(a) Sensory (CGRP+) and sympathetic (TH+) innervation in ipsilateral or contralateral mammary glands 7 days after capsaicin administration. (b) Quantification of CGRP+ nerve bundles post-capsaicin administration. *p = 0.0403, t-test. Mean ± SD. (c-d) 3D culture of 4T1 spheroids in the presence of capsaicin (1–100 μM). (c) Invasion quantification. nsp > 0.9999, Kruskal-Wallis test. (d) Spheroid surface area. nsp = 0.7108, Kruskal-Wallis test. Mean ± SD. (e-f) Sensory-specific denervation of 4T1 tumours grown in NSG mice. (e) Schematic. (f) Tumour growth. . ****p < 0.0001, t-test. Mean ± SEM.
Extended Data Figure 6:
Extended Data Figure 6:. Neuronal substance-P drives breast cancer metastasis via the activation of the tumoral TACR1 receptor.
(a) Invasion assay of 67NR cancer cells in response to SP. *p = 0.0254, t-test. Mean ± SD. (b-c) 67NR cancer cell spheroids cultured with neuropeptides galanin or CGRP, with or without RNase A. (b) Invasion quantification. **p = 0.0011, ****p < 0.0001, nsp (CGRP) = 0.1066, nsp (galanin) > 0.9999, Kruskal-Wallis test. Vehicle-treated 67NR spheroids (−/+RNase A) are also plotted in Fig. 2d and Fig. 3d respectively since the experiments were conducted together. (c) Proliferation quantification. ***p = 0.0006, Mann-Whitney test. Mean ± SD. (d) ELISA-based quantification for SP levels in conditioned medium. p values are based on comparisons with base medium (NGM). nsp = 0.7426 (vs DRG only), 0.8724 (vs 67NR only); *p = 0.0213; **p = 0.0024, ANOVA. Mean ± SD. (e-g) In vivo measurements of SP expression. (e) Mean fluorescence intensity (MFI) of SP in 4T1 vs 67NR primary tumours. ****p < 0.0001, t-test. (f) Plasma SP levels in 67NR vs 4T1 tumour-bearing mice. *p = 0.0359, t-test. (g) MFI of SP in 4T1 vehicle vs capsaicin-treated primary tumours. ****p < 0.0001, t-test. Mean ± SD. (h-k) Effects of an SP-blocking antibody on 4T1 tumour growth and metastasis. (h) Schematic. (i) MFI of SP in IgG vs anti-SP treated 4T1 tumours. ****p < 0.0001, Mann-Whitney test. Mean ± SD. (j) Tumour growth. ****p < 0.0001, Mann-Whitney test. Mean ± SEM. (k) Metastatic area quantified by H&E. **p = 0.0012, t-test. Mean ± SD. (l-o) Orthotopic transplantation of EO771 LM2 cells into the abdominal mammary glands of Tac1-WT and Tac1-null host mice. (l) Schematic. (m) MFI of SP in primary tumours. ***p = 0.0003, t-test. Mean ± SD. (n) Tumour growth. ***p = 0.0003, t-test. Mean ± SEM. (o) Number of macro-metastases quantified by H&E. ***p = 0.0006, t-test. Mean ± SD. (p-r) Depletion of SP’s receptor, TACR1 in 4T1 cancer cell spheroids. (p) Validation of knockdown. ****p < 0.0001, ANOVA. MW: TACR1 (46 kDa). Quantification of spheroid invasion (q) and proliferation (r). ****p < 0.0001, Mann-Whitney test. Mean ± SD. (s-u) Orthotopic transplantation of 4T1 cancer cells depleted for TACR1. (s) Schematic. (t) Tumour growth. ****p < 0.0001, ANOVA. Mean ± SEM. (u) Metastatic area quantified by H&E. ***p = 0.0003, ANOVA. Mean ± SD.
Extended Data Figure 7:
Extended Data Figure 7:. Neuronal SP drives metastasis in a ssRNA-dependent manner
(a-b) Schematic for isolation of conditioned medium from tumour only, DRG only, or tumour-DRG cultures (a). Invasion quantification, nsp = 0.1463, ****p < 0.0001, Kruskal-Wallis test (b). Mean ± SD. (c) Calcium fluorescence traces (ΔF/F0) of DRG neurons cultured alone or in the presence of 67NR cancer cells. F = measured fluorescence, F0 = baseline fluorescence. (d) Invasion quantification of 67NR spheroids co-cultured with DRG neurons in the presence of a sodium channel blocker, tetrodotoxin (TTX). nsp > 0.9999, ****p < 0.0001, Kruskal-Wallis test. Mean ± SD. (e) Invasion quantification of 67NR spheroids cultured with DNase-treated or heat inactivated tumour-CM or DRG-CM. ***p = 0.001, ****p < 0.0001, Kruskal-Wallis test. Mean ± SD. (f) Invasion quantification of 67NR spheroids cultured with solely RNase A, RNase T1 or RNase III. nsp > 0.9999, Kruskal-Wallis test. Mean ± SD. (g) Proliferation quantification of 67NR spheroids cultured with or without ssRNA40. ****p < 0.0001, Mann-Whitney test. Mean ± SD. (h) Invasion quantification of 67NR spheroids cultured with a dsRNA mimetic, Poly (I:C). **p = 0.0072, Kruskal-Wallis test. Mean ± SD. (i-k) Effect of RNase A treatment on 4T1 tumour growth and metastasis. (i) Schematic. (j) Tumour growth. ****p < 0.0001, ANOVA. Mean ± SEM. (k) Metastatic area quantified by H&E. *p = 0.0392 (vehicle vs RNase A #1), *p = 0.0347 (vehicle vs RNase A #2), ANOVA. Mean ± SD. (l) MFI of dsRNA (measured using an anti-dsRNA antibody, J2) in vehicle vs RNase A treated 4T1 primary tumours. nsp = 0.22 (RNase A #1), 0.0625 (RNase A #2), ANOVA. Mean ± SD. (m-o) Intra-cardiac injections of mCherry+ 67NR cancer cells pre-treated with tumour-CM or DRG-CM. (m) Schematic. (n) Representative mCherry+ metastases. (o) Quantification of mCherry+ metastases. **p = 0.0028, *p = 0.0366 (liver), *p = 0.0313 (brain), t-test. Mean ± SD.
Extended Data Figure 8:
Extended Data Figure 8:. SP-driven activation of TACR1 and ssRNA-driven activation of TLR7 promote breast cancer invasiveness across multiple models of breast cancer.
(a) Invasion quantification of Py8119, 4T1, and MDA-MB-231 breast cancer spheroids in the presence of SP. **p = 0.0013, ****p < 0.0001, Kruskal-Wallis test. Mean ± SD. (b) Invasion quantification of Py8119, 4T1, and MDA-MB-231 breast cancer spheroids in the presence of ssRNA40. *p = 0.0235, ****p < 0.0001, Kruskal-Wallis test. Mean ± SD.
Extended Data Figure 9:
Extended Data Figure 9:. Neuronal SP signals via tumoral TLR7 receptors to drive metastasis
(a) Percent apoptotic area within 67NR spheroids cultured with galanin. nsp = 0.0807, Mann-Whitney test. Mean ± SD. (b) 67NR spheroids cultured with or without DRG neurons and immunostained for TACR1. n = 10 spheroids/ group. (c) Flow cytometry analysis of TACR1 expression in 67NR cancer cells. **p = 0.0089, t-test. Mean ± SD. (d-f) 67NR spheroids depleted for TACR1 and cultured with SP. (e) Percent apoptotic area. ***p = 0.0003, Mann-Whitney test, ****p < 0.0001, Kruskal-Wallis test. (f) Invasion quantification. ****p < 0.0001, Kruskal-Wallis test. Mean ± SD. (g) Validation of Tlr7 knockdown in 67NR cancer cells. ****p < 0.0001, ANOVA. Mean ± SD. MW: TLR7 (135 kDa). (h) Validation of Tlr3 knockdown in 67NR cancer cells. ****p < 0.0001, ANOVA. Mean ± SD. (i) Invasion quantification of 67NR spheroids depleted for TLR3 and cultured with or without DRG neurons. ****p < 0.0001, Kruskal-Wallis test. Mean ± SD. (j) Invasion quantification of 67NR spheroids cultured in the presence of TLR7 agonists, R837 or R848. ****p < 0.0001, **p = 0.0011, Kruskal-Wallis test. Mean ± SD. (k) Validation of Tlr7 knockdown in 4T1 cancer cells. ***p = 0.0006, ANOVA. Mean ± SD. MW: TLR7 (135 kDa). (l) Invasion quantification of 4T1 spheroids depleted of TLR7. ****p < 0.0001, Kruskal-Wallis test. Mean ± SD. (m) Immunostaining for CD45 (all immune), CD3 (T cells), or NK1.1 (NK cells) on 4T1 primary tumours depleted of TLR7. nsp > 0.9999 (all conditions), Kruskal-Wallis test. Mean ± SD. (n-p) Orthotopic transplantations of 4T1 cancer cells depleted for TLR7 in NSG mice. (n) Schematic. (o) Tumour growth. ****p < 0.0001, ANOVA. Mean ± SEM. (p) Metastatic area quantified by H&E. ****p < 0.0001, ANOVA. Mean ± SD. (q-s) Orthotopic transplantation of 4T1 cancer cells depleted for TLR7, followed by periodic injections of RNase A. (q,r) Schematics. (s) Tumour growth. **p = 0.0033, nsp = 0.9923, ANOVA. Mean ± SD.
Extended Data Figure 10:
Extended Data Figure 10:. Sensory neurons activate a non-canonical TLR7 signalling axis in cancer cells which correlates with poor patient outcome
(a) mRNA sequencing of control vs Tlr7 depleted 4T1 spheroids. Top five downregulated pathways in 4T1 spheroids depleted for Tlr7 as assessed by gene set enrichment analysis (p values according to permutation testing). (b) Validation of MyD88 knockdown in 67NR cancer cells. MW: MyD88 (33 kDa). r = 3. (c) Invasion quantification of 67NR spheroids depleted for MyD88 and cultured with or without DRG neurons. . ****p < 0.0001, Mann-Whitney test. nsp > 0.9999 (si#1), nsp = 0.0783 (si#2), nsp = 0.4140 (si#3), Kruskal-Wallis test. Mean ± SD. (d) Invasion quantification of 67NR spheroids cultured with or without SP and a PI3K inhibitor (left to right: buparlisib, capivasertib, or pictilisib). nsp (Veh vs buparlisib) = 0.1273, nsp (Veh vs capivasertib) = 0.6967, nsp (Veh vs pictilisib) > 0.9999, ****p < 0.0001, Kruskal-Wallis test. Mean ± SD. (e-f) Multivariate analysis of the association of age, tumour stage and a Tlr7-dependent gene signature with survival in breast cancer patients from the METABRIC (e) and TCGA (f) datasets (p values according to multivariate Cox proportional hazard models, error bars indicate 95% confidence intervals).
Extended Data Figure 11:
Extended Data Figure 11:. Aprepitant impairs tumour growth and metastasis of Py8119 and MMTV-PyMT models of breast cancer
(a) Invasion quantification of Py8119, 4T1, and MDA-MB-231 breast cancer spheroids cultured in the presence of aprepitant. ****p < 0.0001, nsp = 0.9621, **p = 0.0013, Kruskal-Wallis test. Mean ± SD (b-d) Aprepitant was evaluated for its potential in inhibiting breast cancer progression and metastasis. (b) Schematic. (c) Py8119 tumour growth and metastasis count. **p = 0.0012, *p = 0.0117, Mann-Whitney test. (d) MMTV-PyMT tumor growth. **p = 0.0047, Mann-Whitney test. Mean ± SEM.
Figure 1:
Figure 1:. Sensory neurons promote invasion, proliferation, and metastasis in breast cancer
(a-b) Breast tumours from patients with lymph node spread express higher βIII-tubulin than those with localized disease. Cohort 1 (a), r=11; *p = 0.0329. Cohort 2 (b), r=19; *p = 0.0119. t-test, Mean±SD. MW: βIII-tubulin (50 kDa). (c) CGRP+ sensory innervation in poorly (67NR) or highly (4T1) metastatic optically cleared mammary tumours. r = 3 tumours/ group. (d) Left: CGRP+ sensory nerve bundle. Right: CGRP+ innervation in highly metastatic primary tumours relative to corresponding isogenic poorly metastatic tumours. ***p (67NR/4T1) = 0.0002, ***p (4T07/4T1) = 0.0003, nsp (67NR/4T07) = 0.6636 by one-way ANOVA; *p (EO771 Par/LM2) = 0.0272, **p (HCC1806 Par/LM2) = 0.0073, Mann-Whitney test. Mean ± SD. (e) Retrograde tracing of DRG neurons innervating 67NR/4T1 tumours using GFP-tagged cholera toxin β (CTB-GFP). Scale, 100 μm. ****p < 0.0001, t-test of AUC. Mean±SEM. (f-i) Co-culture of 67NR cancer cell spheroids and DRG neurons isolated from syngeneic mice in 3D collagen I. (f) Schematic. (g) Time-series of 67NR cancer cell spheroids and DRG neurons. Quantification of spheroid invasion (h) and proliferation (i). ****p < 0.0001, Mann-Whitney test, Mean ± SD. (j) Representative tile scans of primary tumours arising from mCh+ 67NR cancer cells transplanted with or without DRG neurons; enlarged insets of the tumour-stroma border are shown. Quantified in Extended Data Fig. 3e. (k-m) Sensory nerve-specific denervation of 4T1 mammary tumours. (k) Schematic. (l) Tumour growth. ****p < 0.0001, t-test. Mean ± SEM. (m) Metastatic area quantified by H&E. *p = 0.0385, t-test. Mean ± SD.
Figure 2:
Figure 2:. Neuronal substance-P promotes breast cancer metastasis
(a-c) Tumour-CM was isolated from a 3D culture of 67NR spheroids. DRG-CM was isolated from a 3D co-culture of 67NR spheroids and DRG neurons. (a) Schematic. Quantification of spheroid invasion (b) and proliferation (c). ****p < 0.0001, Mann-Whitney test. Mean ± SD. (d) Invasion quantification of 67NR spheroids cultured with/without substance-P (SP). ****p < 0.0001, Mann-Whitney test. Mean ± SD. (e) Invasion quantification of 67NR spheroids co-cultured with/without DRG neurons isolated from Tac1-null mice. nsp = 0.3070, Mann-Whitney test. Mean ± SD. (f) Left: A primary human breast tumour immuno-stained for SP with the highlighted tumour region (ROI) used for mean fluorescence intensity (MFI) measurements. Right: MFI of SP in breast tumours of patients with lymphatic spread compared to those with localized disease. ****p < 0.0001, t-test. Mean ± SD. (g-i) Orthotopic transplantation of 4T1 cells into the abdominal mammary glands of Tac1-WT and Tac1-null host mice. (g) Schematic. (h) Tumour growth. ****p < 0.0001, t-test. Mean ± SEM. (i) Metastatic area quantified by H&E. *p = 0.0165, t-test. Mean ± SD.
Figure 3:
Figure 3:. Neuronal SP promotes the release of metastatic ssRNAs from cancer cells
(a) Time series of a DRG neuron co-cultured with 67NR cancer cells in the presence of the calcium dye Fluo-4. (b) Spontaneous calcium events (ΔF/F0) in DRG neurons cultured with or without 67NR cancer cells. (c) 67NR spheroids cultured in tumour-CM or DRG-CM in the presence of either ssRNA- or dsRNA-specific RNases. Left: Representative images. Right: Invasion quantification. nsp > 0.9999, *p = 0.0215, Kruskal-Wallis test. Mean ± SD. (d) Invasion quantification of 67NR spheroids cultured with SP and RNase A. Vehicle-treated 67NR spheroids (+/−RNase A) are plotted in Extended Data Fig. 6b since the experiments were conducted together. nsp = 0.2416, Mann-Whitney test. Mean ± SD. (e) Invasion quantification of 67NR spheroids cultured with a ssRNA mimetic. ****p < 0.0001, Kruskal-Wallis test. Mean ± SD. (f-g) mCherry+ 67NR cancer cells were pre-treated with tumour-CM or DRG-CM with or without RNase A prior to tail vein injections into syngeneic hosts. (f) Schematic. (g) Quantification of mCherry+ metastases. ****p < 0.0001, ***p = 0.0005, **p = 0.0015, Mann-Whitney test. Mean ± SD. (h) Percent apoptotic area within 67NR cancer cell spheroids when cultured alone, with DRG neurons, or with SP. ****p < 0.0001, Kruskal-Wallis test. Mean ± SD. (i) Invasion quantification of 67NR spheroids cultured alone, with DRG neurons, or with SP – all in the presence of z-VAD-FMK, a pan-caspase inhibitor. Veh = vehicle. 67NR only group: **p = 0.0056, nsp > 0.9999; 67NR+DRG group: **p = 0.0083, ****p < 0.0001; 67NR + SP group: ***p = 0.0004, ****p < 0.0001. Kruskal-Wallis test. (j) RNA concentration within conditioned medium of 67NR only, 67NR+DRG (+/−z-VAD-FMK), 67NR+SP cultures. Extracellular RNA species detected are <200 nucleotides. ***p = 0.0002, nsp = 0.8248, ANOVA. Mean ± SD.
Figure 4:
Figure 4:. Sensory neurons signal via tumoral TLR7 to promote metastasis.
(a-b) 67NR cancer cell spheroids depleted for TLR7 and cultured with or without DRG neurons. (a) Invasion quantification. nsp = 0.5787, *p = 0.031, ****p < 0.0001, ANOVA. (b) Proliferation quantification. Sph. = spheroid. nsp = 0.8751, **p = 0.0048, t-test. Mean ± SD. (c) Invasion quantification of 67NR cancer cell spheroids depleted for TLR7 and cultured with or without SP. nsp = 0.07 (scram. vs si#1), 0.926 (scram. vs si#2), ****p < 0.0001, Kruskal-Wallis test. Mean ± SD. (d-f) Orthotopic transplantation of 4T1 cancer cells depleted for TLR7. (d) Schematic. (e) Tumour growth. **p = 0.0070 (scrambled vs sh#1), 0017 (scrambled vs sh#2), ANOVA. Mean ± SEM. (f) Metastatic area quantified by H&E. **p = 0.0086 (scram. vs sh#1), 0.0085 (scram. vs sh#2), ANOVA. Mean ± SD. (g) Western blotting of phosphorylated (pAKT) and total AKT levels in 67NR cancer cells depleted of Tlr7. **p = 0.0013 (scram. vs si#1), **p = 0.0015 (scram. vs si#2), ANOVA. Mean ± SD. MW: AKT (60 kDa). (h) Invasion quantification of 67NR cancer cell spheroids co-cultured with DRG neurons in the presence of small molecule inhibitors of PI3K signalling (10 nM, 100 nM, or 1 μM). ***p = 0.0005, ****p < 0.0001, Kruskal-Wallis test. Mean ± SD.
Figure 5:
Figure 5:. The antiemetic aprepitant targets this neuro-cancer axis to inhibit metastasis
(a-e) A clinically used anti-nausea medication, aprepitant was evaluated for its potential in inhibiting breast cancer progression and metastasis. (a) Schematic. 4T1: orthotopic tumour, aprepitant delivered intra-tumorally. Patient-derived xenografts (PDXs): subcutaneous tumour, aprepitant delivered intraperitoneally. (b) 4T1 tumour growth. ***p = 0.0003, Mann-Whitney test. Mean ± SEM. (c) 4T1 metastatic area quantified by H&E. **p = 0.0086, t-test. Mean ± SD. r = 7–8 mice/ grp. (d,e) Tumour growth for two independent PDX models. *p = 0.0116, **p = 0.0037, t-test. Mean ± SEM. (f) Model: Breast tumours are frequently innervated by sensory nerves. Metastatic breast tumours have more sensory innervation than isogeneic tumours with lower metastatic potential. In the tumour stroma, neuronal SP causes cell death in a subset of TACR1-high cancer cells, causing ssRNA release that acts in a paracrine manner on tumoral TLR7 receptors of neighbouring cancer cells to drive breast cancer metastasis.

Comment in

  • Neurons give metastatic cells a push.
    Villanueva MT. Villanueva MT. Nat Rev Drug Discov. 2024 Oct;23(10):739. doi: 10.1038/d41573-024-00144-x. Nat Rev Drug Discov. 2024. PMID: 39251736 No abstract available.

References

    1. Ayala GE et al. Cancer-related axonogenesis and neurogenesis in prostate cancer. Clin Cancer Res 14, 7593–7603 (2008). 10.1158/1078-0432.CCR-08-1164 - DOI - PubMed
    1. Huang D et al. Nerve fibers in breast cancer tissues indicate aggressive tumor progression. Medicine (Baltimore) 93, e172 (2014). 10.1097/MD.0000000000000172 - DOI - PMC - PubMed
    1. Oertel H Innervation and Tumour Growth: A Preliminary Report. Can Med Assoc J 18, 135–139 (1928). - PMC - PubMed
    1. Renz BW et al. beta2 Adrenergic-Neurotrophin Feedforward Loop Promotes Pancreatic Cancer. Cancer Cell 34, 863–867 (2018). 10.1016/j.ccell.2018.10.010 - DOI - PMC - PubMed
    1. Latil A et al. Quantification of expression of netrins, slits and their receptors in human prostate tumors. Int J Cancer 103, 306–315 (2003). 10.1002/ijc.10821 - DOI - PubMed

MeSH terms