. 2024 Sep;633(8029):451-458.
doi: 10.1038/s41586-024-07787-1. Epub 2024 Aug 7.

Glycosphingolipid synthesis mediates immune evasion in KRAS-driven cancer

Affiliations

Glycosphingolipid synthesis mediates immune evasion in KRAS-driven cancer

Mariluz Soula et al. Nature. 2024 Sep.

Abstract

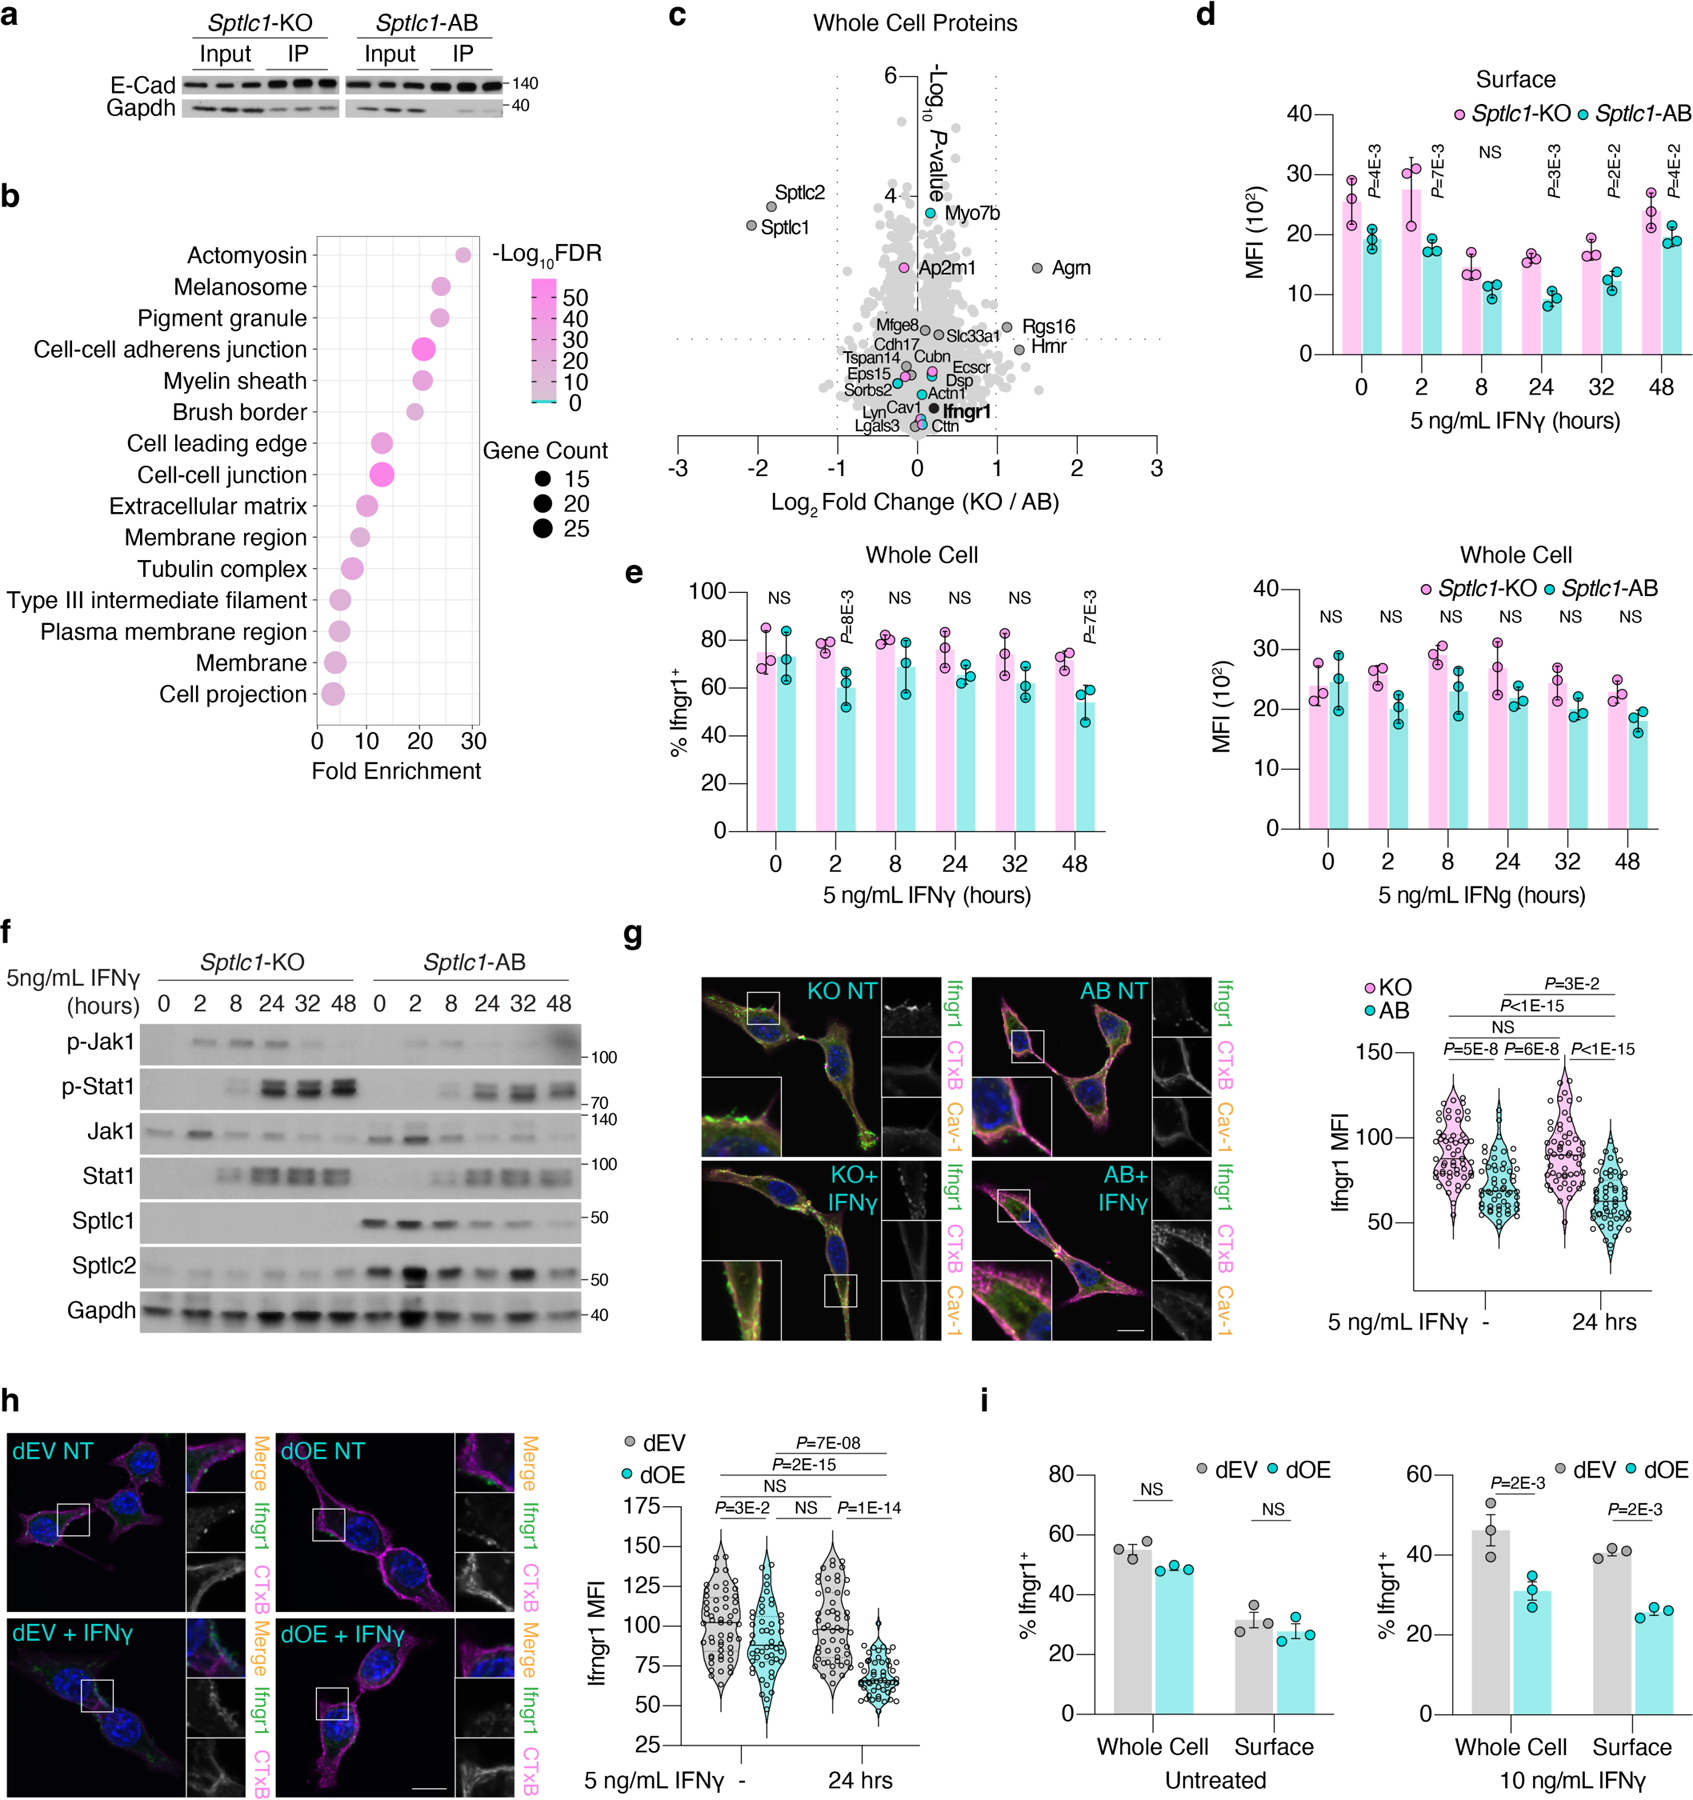
Cancer cells frequently alter their lipids to grow and adapt to their environment1-3. Despite the critical functions of lipid metabolism in membrane physiology, signalling and energy production, how specific lipids contribute to tumorigenesis remains incompletely understood. Here, using functional genomics and lipidomic approaches, we identified de novo sphingolipid synthesis as an essential pathway for cancer immune evasion. Synthesis of sphingolipids is surprisingly dispensable for cancer cell proliferation in culture or in immunodeficient mice but required for tumour growth in multiple syngeneic models. Blocking sphingolipid production in cancer cells enhances the anti-proliferative effects of natural killer and CD8+ T cells partly via interferon-γ (IFNγ) signalling. Mechanistically, depletion of glycosphingolipids increases surface levels of IFNγ receptor subunit 1 (IFNGR1), which mediates IFNγ-induced growth arrest and pro-inflammatory signalling. Finally, pharmacological inhibition of glycosphingolipid synthesis synergizes with checkpoint blockade therapy to enhance anti-tumour immune response. Altogether, our work identifies glycosphingolipids as necessary and limiting metabolites for cancer immune evasion.


Conflict of interest statement

Declaration of Interests

K.B. is a scientific advisor to Nanocare Pharmaceuticals and Atavistik Bio. M.S. is an employee of Lime Therapeutics. The other authors have no competing interests.

Figures

Extended Data Figure 1.
Extended Data Figure 1.. Cancer cell sphingolipid availability mediates immune evasion
a. Cell count of red blood cells (RBC, left), white blood cells (WBC, middle), lymphocytes (LYM, right), neutrophils (NEU), monocytes (MONO), eosinophils (EOS), and basophils (BAS) in untreated C57BL/6J mice (pink) and myeolablated C57BL/6J mice on the day of tumor injections (d0, 36 hrs after radiation) and at the endpoint (d18). Mean ± SEM; n = 3 mice/ group. b. Ranks of differential gene scores between C57BL/6J and myeloablated mice (x-axis) or NSG mice (y-axis). The highlighted genes are among the top 60 scoring genes and are involved in sphingolipid biosynthesis. c. Schematic of wildtype HY15549 cells grown in C57BL/6J or NSG mice for 12 days before tumor collection and lipid extraction. Lipid abundances were determined by LC-MS analysis (right). d. Abundance of ceramide-derived lipid species in HY15549 cells grown in C57CBL/6J versus NSG mice. Lipid abundance is normalized to cholesterol levels (left) or to total protein (right). Mean ± SEM, n = 3 mice/ group. e. Abundance of hexosyl-1-ceramides in HY15549 cells grown in C57CBL/6J versus NSG mice. Lipid abundance is normalized to cholesterol levels. Mean ± SEM, n = 3 mice/ group. f. Abundance of hexosyl-2-ceramides in HY15549 cells grown in C57CBL/6J versus NSG mice. Lipid abundance is normalized to cholesterol levels. Mean ± SEM, n = 3 mice/ group. g. Abundance of glucosylceramides in HY15549 cells grown in C57CBL/6J versus NSG mice. Lipid abundance is normalized to cholesterol levels. Mean ± SEM, n = 3 mice/ group. h. Abundance of sphingosines in HY15549 cells grown in C57CBL/6J versus NSG mice. Lipid abundance is normalized to cholesterol levels. Mean ± SEM, n = 3 mice/ group. i. Abundance of sulfatides in HY15549 cells grown in C57CBL/6J versus NSG mice. Lipid abundance is normalized to cholesterol levels. Mean ± SEM, n = 3 mice/ group.
Extended Data Figure 2.
Extended Data Figure 2.. Loss of Sptlc1 or Sptlc2 depletes ceramide-derived lipid species
a. Immunoblot analysis of Sptlc1 (top) and Sptlc2 (bottom) expression in wildtype HY15549 cells or knockout and cDNA-expressing clonal pairs. Gapdh is used as a loading control. b. Abundance of ceramide-derived lipid species in empty vector parental, Sptlc1-KO (KO) and Sptlc1-AB (AB) HY15549 cells. Abundance is normalized to cholesterol levels of each sample (left) or to protein (right). Mean ± SEM, n = 2 biological replicates/ cell line. c. Abundance of ceramide species in empty vector parental, Sptlc1-KO (KO) and Sptlc1-AB (AB) HY15549 cells. Abundance is normalized to cholesterol levels of each sample. Mean ± SEM, n = 2 biological replicates/ cell line. d. Abundance of hexosyl-1-ceramide species in empty vector parental, Sptlc1-KO (KO) and Sptlc1-AB (AB) HY15549 cells. Abundance is normalized to cholesterol levels of each sample. Mean ± SEM, n = 2 biological replicates/ cell line. e. Abundance of sphingomyelin species in empty vector parental, Sptlc1-KO (KO) and Sptlc1-AB (AB) HY15549 cells. Abundance is normalized to cholesterol levels of each sample. Mean ± SEM, n = 2 biological replicates/ cell line. f. Abundance of ceramide-derived lipid species in empty vector parental, Sptlc2-KO (KO) and Sptlc2-AB (AB, blue) HY15549 cells. Abundance is normalized to cholesterol levels of each sample. Mean ± SEM, n = 2 biological replicates/ cell line. g. Abundance of ceramide-derived lipid species in Sptlc1-KO (KO) and Sptlc1-AB (AB) HY15549 cells grown as tumors in C57BL/6J mice for 12 days. Abundance is normalized to cholesterol levels of each sample (left) or to protein (right). Mean ± SEM, n = 2 biological replicates/ cell line.
Extended Data Figure 3.
Extended Data Figure 3.. Loss of SPT impairs tumor growth in immunocompetent mice
a. Weights of Sptlc1_sg6-KO (KO, pink) and Sptlc1_sg6-AB (AB, blue) HY15549 tumors grown in C57BL/6J, NSG, or Rag- mice corresponding to Figure 1g (left). Weights of Sptlc1_sg2-KO (KO, pink) and Sptlc1_sg2-AB (AB, blue) HY15549 tumors grown in C57BL/6J or NSG mice (middle). Weights of Sptlc2_sg2-KO (KO, pink) and Sptlc2_sg2-AB (AB, blue) HY15549 tumors grown in C57BL/6J or NSG mice (right). Mean ± SEM; n = 6 (C57BL/6J) or 7 (NSG, Rag1-) mice/ group. b. Weights of HY15549 tumors formed from cells constitutively expressing shRNAs against LacZ (control), Sptlc1, or Sptlc2 and grown in C57BL/6J mice. The tumors measured are shown below. On the right, immunoblot analysis of Sptlc1 (above) and Sptlc2 (below) in lysates from cells kept in culture or grown as tumors. Vinculin is used as a loading control. Mean ± SEM; n = 6 mice/ group. c. Weights of mixed population sgCTRL (gray) or sgSptlc1-KO (pink) HY15549 tumors grown subcutaneously in C57BL/6J or NSG mice. Mean ± SEM; n = 5 mice/ group. Images of tumors are shown below. Scale bar = 1 cm. Immunoblot analysis of Sptlc1is shown above. Gapdh is used as a loading control. d. Weights of Sptlc1-KO (KO, pink) and Sptlc1-AB (AB, blue) HY15549 tumors orthotopically grown in the pancreas of C57BL/6J mice. Mean ± SEM; n = 8 mice/ group. Image of tumors is shown below. Scale bar = 1 cm. X marks tumors that were not detected at the endpoint.
Extended Data Figure 4.
Extended Data Figure 4.. Sphingolipid abundance mediates tumor control
a. Schematic of the sphingolipid metabolism focused CRISPR screen. Syngeneic cancer cell lines derived from C57BL/6J mice were transduced with the sphingolipid metabolism library and injected subcutaneously (SQ) into the flanks of C57BL/6J (B6) or NSG mice. Tumors were collected, their genomic DNA extracted, and guide RNA (sgRNA) abundance was determined. N ≥ 3 mice/ group. b. Immunoblot analysis of Sptlc1 and Sptlc2 in HY15549 cells overexpressing empty vectors or Sptlc1 and Sptlc2 cDNA. Gapdh is used as a loading control. c. Volcano plot showing log2 fold difference in ceramide-derived lipid species between double-empty vector wildtype (dEV) or Sptlc1/Sptlc2 double-overexpression (dOE) HY15549 cells. d. Weights (top) and image (bottom) of double-empty vector wildtype (dEV) or Sptlc1/Sptlc2 double-overexpression (Sptlc1/2_dOE) HY15549 tumors grown in NSG mice. Mean ± SEM, n = 6 mice/ group, scale bar = 1 cm. e. Progression (left) and disease (right) free survival analysis of TCGA PDAC patients with high (blue) or low (pink) expression of SPTLC1, SPTLC2, and KDSR. N = 177. Error bands = 95% confidence interval.
Extended Data Figure 5.
Extended Data Figure 5.. Lysosomal sphingolipid salvage is sufficient to sustain cancer cell proliferation upon loss of de novo synthesis
a. Cell doublings over time of Sptlc1 (left) or Sptlc2 (right) KO (KO, pink) and AB (AB, blue) HY15549 cells grown in vitro. Different shapes are used to distinguish distinct KO/AB clonal pairs. Mean ± SD; n = 3 biological replicates. b. Abundance of ceramide-derived lipid species in Sptlc1_sg6-KO (KO) left untreated or supplemented with sphingosine or ceramide, and Sptlc1_sg6-AB (AB, blue) HY15549 cells. Abundance is normalized to cholesterol levels of each sample. Mean ± SEM, n = 3 biological replicates. c. Cell doublings of parental (EV, black), Sptlc1-KO (KO, pink), and KO HY15549 cells supplemented with sphingosine-1-phosphate (S1P, 1 µM, square), sphingosine (SP, 750 nM, triangle), C2-ceramide (Cer2, 5 µM, diamond), 3-ketodihydrosphingosine (KDS, 2 µM, square), C6-ceramide (Cer6, 1 µM, triangle), cholesterol (10 µM, square), arachidonate (10 µM, triangle), or palmitate (10 µM, diamond) and treated with increasing concentrations of Bafilomycin-A1. Mean ± SD; n = 3 biological replicates. d. Log2 fold change of ceramide-derived lipid species abundance in Sptlc1_sg6-KO (KO) HY15548 cells left untreated or treated with bafilomycin-a1 (Baf-A1) relative to Sptlc1_sg6-AB (AB) cells. N = 3 biological replicates. e. Abundance of ceramide-derived lipid species in Sptlc1_sg6-KO (KO), left untreated or treated with Bafilomycin-A,1and Sptlc1_sg6-AB (AB, blue) HY15549 cells. Abundance is normalized to cholesterol levels of each sample. Mean ± SEM, n = 3 biological replicates. f. Abundance of hexosyl-1-ceramide species in Sptlc1_sg6-KO (KO), left untreated or treated with Bafilomycin-A,1and Sptlc1_sg6-AB (AB, blue) HY15549 cells. Abundance is normalized to cholesterol levels of each sample. Mean ± SEM, n = 3 biological replicates.
Extended Data Figure 6.
Extended Data Figure 6.. Sphingolipid depletion promotes inflammation in the tumor microenvironment
a. Differentially expressed genes used to annotate clusters (y-axis) of sequenced CD45+ cells. Average expression is color-coded, and circle size corresponds to the percentage of cells within the cluster expressing the gene (x-axis). b. Bar plot showing relative differences in leukocyte infiltration in Sptlc1-KO (KO) and Sptlc1-AB (AB) tumors. c. Distribution of interferon-γ (Ifng) expression across distinct CD45+ leukocyte populations isolated from Sptlc1-KO (pink) or Sptlc1-AB (blue) HY15549 tumors grown in C57BL/6J mice. Data shown as mean ± SEM and analyzed by a two-sided Wilcoxon rank sum test with Benjamini-Hochberg correction. N = 5000 cells/ condition. Minima/maxima/center bounds are defined in the source data file. d. Flow analysis of relative proportions of NK, CD8+ T, and CD4+ T cells isolated from Sptlc1_sg6-KO (pink) or Sptlc1_sg6-AB (blue) HY15549 tumors grown in C57BL/6J mice. Mean ± SEM; n = 5 mice/ group. e. Mean fluorescence intensity (MFI) of CD44 in CD8+ T cells isolated from Sptlc1_sg6-KO (pink) or Sptlc1_sg6-AB (blue) HY15549 tumors grown in C57BL/6J mice. Mean ± SEM; n = 5 mice/ group. f. Flow analysis of relative proportions of CD44+/CD62L- CD4+ T cells isolated from Sptlc1_sg6-KO (pink) or Sptlc1_sg6-AB (blue) HY15549 tumors grown in C57BL/6J mice. Mean ± SEM; n = 5 mice/ group. g. MFI of CD44 in CD4+ T cells isolated from Sptlc1_sg6-KO (pink) or Sptlc1_sg6-AB (blue) HY15549 tumors grown in C57BL/6J mice. Mean ± SEM; n = 5 mice/ group. h. CIBERSORT analysis on TCGA expression data for PDAC tumors estimating the fraction of infiltrating NK cells in SPTLC1/SPTLC2/KDSRlow tumors (Low, pink) compared to SPTLC1/SPTLC2/KDSRhigh (High, blue) tumors. N = 177 tumors. Minima/maxima/center bounds are defined in the source data file. i. CIBERSORT analysis on TCGA expression data for PDAC tumors estimating the fraction of activated infiltrating NK cells in SPTLC1/SPTLC2/KDSRlow tumors (Low, pink) compared to SPTLC1/SPTLC2/KDSRhigh (High, blue) tumors. N = 177 tumors. Minima/maxima/center bounds are defined in the source data file. j. CIBERSORT analysis on TCGA expression data for PDAC tumors estimating the fraction of infiltrating CD8+ T cells in SPTLC1/ SPTLC2/ KDSRlow tumors (Low, pink) compared to SPTLC1/ SPTLC2/ KDSRhigh (High, blue) tumors. N = 177 tumors. Minima/maxima/center bounds are defined in the source data file. k. Histogram of IFNγ expression in NK cells monocultured or cocultured with Sptlc1_sg6-KO (pink) or Sptlc1_sg6-AB (blue) HY15549 cells. l. Percent of IFNγ+ NK cells cocultured with Sptlc1_sg6-KO (pink) or Sptlc1_sg6-AB (blue) HY15549 cells. Mean ± SEM; n = 3 biological replicates. m. MFI of IFNγ+ NK cells cocultured with Sptlc1_sg6-KO (pink) or Sptlc1_sg6-AB (blue) HY15549 cells. Mean ± SEM; n = 3 biological replicates. n. Proliferation of OVA-null Sptlc1_sg6-KO (KO_EV, pink) or Sptlc1_sg6-AB (AB_EV, blue) HY15549 cells left untreated or cocultured with OT1 CD8+ T cells at the indicated E:T ratios for 98 hrs. Mean ± SEM; n = 3 biological replicates. o. Weights and images of Sptlc1-KO HY15549 tumors grown in C57BL/6J mice left untreated (NT), or treated with depleting antibodies for NK cells, CD8+ T cells, or both. Mean ± SEM; n = 4 mice/ group. Scale bar = 1 cm. X marks tumors that were not detected at the endpoint. Analyzed using a one-way ANOVA with Benjamini-Hochberg multiple test correction.
Extended Data Figure 7.
Extended Data Figure 7.. Interferon signaling pathways are activated in Sptlc1-KO cells in the presence of immune pressure
a. PCA plot of RNA-seq from GFP+ Sptlc1_sg6-KO (KO) and Sptlc1_sg6-AB (AB) HY15549 cells grown C57BL/6J, NSG mice, or cultured in vitro (left) or in vivo (right). b. PCA plot of RNA-seq from Sptlc1_sg6-KO (KO) and Sptlc1_sg6-AB (AB) HY15549 cells left untreated or cocultured with NK cells (2:1 E:T ratio for 5 hrs). c. Gene set enrichment analysis of genes significantly higher in Sptlc1_sg6-KO versus Sptlc1_sg6-AB HY15549 cells left untreated or cocultured with NK cells (2:1 E:T ratio for 5 hrs). GO terms are ranked by gene ratio, adjusted P-values (FDR, −log10) are color-coded, and the circle size corresponds to the total number of genes in the gene set. d. Second example of an immunoblot analysis of interferon-γ signaling pathway induction in Sptlc1_sg6-KO and Sptlc1_sg6-AB HY15549 cells left untreated or treated with increasing concentrations of IFNγ for 4 hrs. Gapdh is a loading control. e. Second example of an immunoblot analysis of interferon-γ signaling pathway induction in Sptlc1_sg6-KO and Sptlc1_sg6-AB HY15549 cells cocultured with NK cells at the indicated E:T ratios for 5 hrs. Gapdh is a loading control. f. Proliferation of double-empty vector wildtype cells (dEV, gray) and Sptlc1/Sptlc2 double-overexpression (dOE, blue) HY15549 cells treated with the indicated concentrations of IFNγ for 120 hrs. Mean ± SD; n = 3 biological replicates. g. Immunoblot of interferon-γ signaling pathway induction in double-empty vector wildtype cells (dEV) and Sptlc1/Sptlc2 double-overexpression (dOE) HY15549 cells left untreated or treated with increasing concentrations of IFNγ for 4 hrs. Gapdh is a loading control. h. Immunoblot of of Jak1 in Sptlc1-KO (KO), Sptlc1-AB (AB) and Sptlc1_sg6/Jak1-KO (sg_4, sg_8) HY15549 cells (top) and Sptlc1 in Sptlc1_sg6-KO (KO), Sptlc1_sg6-AB (AB) and Sptlc1_sg6/Ifngr1-KO (sg_9, sg_10) HY15549 cells (bottom). Gapdh is a loading control.
Extended Data Figure 8.
Extended Data Figure 8.. Sphingolipids impact plasma membrane expression of Ifngr1
a. Immunoblot of whole cell and biotinylated plasma membrane protein lysates from Sptlc1_sg6-KO and Sptlc1_sg6-AB HY15549 cells used for proteomic analysis. E-cadherin (E-cad) is a control for membrane enrichment and Gapdh is a marker for whole cell proteins. b. Gene set enrichment analysis of the top 206 (PSM >20) most abundant proteins detected by LC-MS in biotinylated plasma membrane protein lysates. Jensen Compartments Ontology terms are ranked by fold enrichment, adjusted P-values (FDR, −log10) are color-coded, and circle size corresponds to the total number of genes in the gene set. c. Log2 fold difference in whole cell proteins between Sptlc1_sg6-KO and Sptlc1_sg6-AB HY15549 cells versus −log10 P-value. d. Median fluorescence intensity of Ifngr1+ Sptlc1_sg6-KO (pink) or Sptlc1_sg6-AB (blue) HY15549 cells treated with 5 ng/mL interferon-γ for the indicated times. Mean ± SD, n = 3 biological replicates. e. Flow analysis of Ifngr1 (left) and median fluorescence intensity (right) of Ifngr1 in permeabilized Sptlc1_sg6-KO (pink) and Sptlc1_sg6-AB (blue) HY15549 cells left untreated or treated with 5 ng/mL interferon-γ for the indicated times. Mean ± SD, n = 3 biological replicates. f. Immunoblot of interferon-γ signaling pathway induction in Sptlc1_sg6-KO and Sptlc1_sg6-AB HY15549 cells left untreated or treated with IFNγ for the indicated times. Gapdh is a loading control. g. Immunocytochemistry analysis of Ifngr1 and Cav1 in Sptlc1-KO (KO) and Sptlc1-AB (AB) HY15549 cells left untreated (top) or treated with 5 ng/mL IFNγ for 24 hrs. Choleratoxin B (CTxB) is used as a plasma membrane and sphingolipid abundance marker. Scale bar = 10 µm. Quantification of plasma membrane bound Ifngr1 is on the right, n = 55 cells/ condition. h. Immunocytochemistry analysis of Ifngr1 in double-empty vector wildtype cells (dEV) and Sptlc1/Sptlc2 double-overexpression (dOE) HY15549 cells left untreated (top) or treated with 10 ng/mL IFNγ for 24 hrs. CTxB is used as a plasma membrane and sphingolipid abundance marker. Scale bar = 10 µm. Quantification of plasma membrane bound Ifngr1 is on the right, n = 50–54 cells/ condition. i. Flow analysis of whole cell and plasma membrane expression of Ifngr1 in double-empty vector cells (dEV, gray) and Sptlc1/Sptlc2 double-overexpression (dOE, blue) HY15549 cells left untreated (left) or treated with 10 ng/mL IFNγ (right) for 24 hrs. Mean ± SEM; n = 3 biological replicates.
Extended Data Figure 9.
Extended Data Figure 9.. De novo glycosphingolipid synthesis is limiting for cancer immune evasion
a. Guide scores of genes encoding enzymes at each branchpoint of sphingolipid synthesis. Guide scores of the top 7% (pink) and bottom 20% (blue) Ifngr1+ HY15549 (top) and KP LUAD (bottom) cells transduced with the sphingolipid metabolism-focused sgRNA library are shown. b. Abundance of ceramide-derived lipid species in Ugcg_sg5-KO (KO) and Ugcg_sg5-AB (AB, blue) HY15549 cells. Signal is normalized to cholesterol levels of each sample. Mean ± SEM, n = 3 biological replicates. c. Abundance of hexosyl-1-ceramide species in Ugcg_sg5-KO (KO) and Ugcg_sg5-AB (AB, blue) HY15549 cells. Signal is normalized to cholesterol levels of each sample. Mean ± SEM, n = 3 biological replicates. d. Abundance of hexosyl-2-ceramide species in Ugcg_sg5-KO (KO) and Ugcg_sg5-AB (AB, blue) HY15549 cells. Signal is normalized to cholesterol levels of each sample. Mean ± SEM, n = 3 biological replicates. e. Flow analysis of plasma membrane glycosphingolipid levels measured by Choleratoxin B fluorescence (CTxB). f. Flow analysis of plasma membrane expression of Ifngr1 in sgCTRL-RFP and sgUgcg-RFP HY15549 cells. Mean ± SEM; n = 3 biological replicates. g. Weights of Ugcg_sg5-KO (KO, pink) and Ugcg_sg5-AB (AB, blue) HY15549 tumors grown in NSG mice. Tumors measured are shown below. Mean ± SEM, n = 4 mice/ group. h. Tumor weights of mixed population HY15549 cells expressing sgCTRL-RFP or sgUgcg-RFP grown in C57BL/6J mice. Tumors measured are shown below. Mean ± SEM, n = 5 mice/ group.
Extended Data Figure 10.
Extended Data Figure 10.. Pharmacological depletion of glycosphingolipids impacts immune evasion
a. Abundance of ceramide-derived lipid species in HY15549 cells left untreated (gray) or treated with 10 µM eliglustat for 24 hours. Signal is normalized to cholesterol levels of each sample. Mean ± SEM, n = 3 biological replicates. b. Abundance of hexosyl-1-ceramide species in HY15549 cells left untreated (gray) or treated with 10 µM eliglustat for 24 hours. Signal is normalized to cholesterol levels of each sample. Mean ± SEM, n = 3 biological replicates. c. Abundance of hexosyl-2-ceramide species in HY15549 cells left untreated (gray) or treated with 10 µM eliglustat for 24 hours. Signal is normalized to cholesterol levels of each sample. Mean ± SEM, n = 3 biological replicates. d. Proliferation of wildtype HY15549 (left) or KP LUAD (right) cells left untreated (gray) or pretreated with eliglustat for 24 hrs (pink) and the indicated concentrations of interferon-γ (IFNγ) for 96 hrs. Mean ± SD; n = 3 biological replicates. e. Weights (left) and image (right) of wildtype KP LUAD tumors grown in C57BL/6J mice on the indicated treatment regimens. Mean ± SEM; n = 6 (HY15549 −/−, +/−, −/+, KPLUAD −/+) or 7 (others) mice/ group; scale bar = 1 cm. Data were analyzed using a one-way ANOVA with Tukey’s multiple test correction. f. Survival analysis of TCGA PDAC patients with high (blue) or low (pink) expression of SPTLC1, SPTLC2, and KDSR. N = 177. Error bands = 95% confidence interval.
Figure 1.
Figure 1.. The essential role of sphingolipid synthesis in cancer immune evasion
a. Distribution of genes in the focused CRISPR library. b. HY15549 cells transduced with the lipid metabolism library were injected subcutaneously into C57BL/6J (BL6), myeloablated BL6, or NSG mice. Tumors were collected and guide RNA (sgRNA) abundance was determined. N ≥ 3 mice/ group. c. KEGG pathway analysis of top 60 essential genes in C57BL/6J mice versus myeolablated C57BL/6J or NSG mice. KEGG terms are ranked by fold enrichment. False Discovery Rate (−log10FDR) is color-coded, and circle size corresponds to total number of genes in the set. d. Ranks of differential gene scores between C57BL/6J and myeloablated or NSG mice. Highlighted genes are among the top 25 scoring genes. e. Log2 fold change in ceramide-derived species between HY15549 tumors grown in C57BL/6J or NSG mice. N = 3 mice/ group. f. Scoring genes (bold) in the sphingolipid metabolism pathway. De novo synthesis begins in the ER. Ceramides are transferred to the Golgi and modified into sphingomyelin or glycosphingolipids which make up cellular membranes. Sphingolipids in membranes or the lysosome are catabolized into ceramides and sphingosine via the salvage pathway. g. Immunoblot of Sptlc1 in wildtype HY15549 cells or in a knockout and cDNA-expressing clonal pair. Full blot is shown in ED Fig. 2a. h. Tumor volume of Sptlc1-KO (pink) and Sptlc1-AB (blue) HY15549 cells grown in C57BL/6J, NSG, or Rag1- mice. Mean ± SEM; n = 6 (C57BL/6J) or 7 (NSG, Rag1-) mice/ group. Tumors are shown below, scale bar = 1 cm. X marks tumors that were not detected at the endpoint. i. Gene essentiality in KP lung adenocarcinoma (LUAD) tumors grown in C57BL/6J versus NSG mice. The dotted line represents P = 0.05. De novo sphingolipid synthesis genes are highlighted. N ≥ 4 mice/ group. j. Survival of C57BL/6J mice bearing KrasG12D/p53−/− liver tumors generated by hydrodynamic gene delivery expressing sgCtrl (gray, n = 6) or sgSptlc1 (pink, n = 5). k. Luciferase flux from KrasG12D/p53−/− liver tumors expressing sgCtrl (gray, n = 6) or sgSptlc1 (pink, n = 5) generated by hydrodynamic gene delivery in C57BL/6J. A representative image is shown on the right and tumors below. Mean ± SEM. l. Weights and image of double-empty vector wildtype (EV) or Sptlc1/Sptlc2 double-overexpression HY15549 tumors grown in C57BL/6J mice. Mean ± SEM; n = 5 mice/ group; scale bar = 1 cm.
Figure 2.
Figure 2.. Sphingolipid synthesis protects cancer cells from the anti-tumor effects of immune cells
a. UMAP plot of 17,950 CD45+ infiltrating leukocytes isolated from Sptlc1-KO or AB HY15549 tumors grown in C57BL/6J mice. b. Expression distribution of differentially expressed (Padj <0.0001) activation and cytotoxicity markers in NK and CD8+ T cells isolated from Sptlc1-KO or Sptlc1-AB HY15549 tumors grown in C57BL/6J mice. Mean ± SEM; analyzed by a two-sided Wilcoxon rank sum test with Benjamini-Hochberg correction. N = 5000 cells/ condition. Minima/maxima/center bounds are defined in the source data file. c. Fold change (log10) of the average Ifng expression of CD45+ leukocytes isolated from Sptlc1-KO or Sptlc1-AB HY15549 tumors grown in C57BL/6J mice. d. Flow analysis of the expression of IFNγ in NK, CD8+ T, or CD4+ T cells isolated from Sptlc1-KO or Sptlc1-AB HY15549 tumors grown in C57BL/6J mice. Mean ± SEM; n = 8 mice/ group. e. Flow analysis of the proportion of CD62L+ NK cells among leukocytes isolated from Sptlc1-KO or Sptlc1-AB HY15549 tumors grown in C57BL/6J mice. Mean ± SEM; n = 5 mice/ group. f. Flow analysis of the proportion of CD44+/ CD62L- CD8+ T cells among leukocytes isolated from Sptlc1-KO or AB HY15549 tumors grown in C57BL/6J mice. Mean ± SEM; n = 5 mice/ group. g. Proliferation of Sptlc1-KO and AB HY15549 cells supplemented with 3-ketodihydrosphingosine (KO+KDS, 1 µM) or sphingosine (KO+SP, 750nM) left untreated (circle) or cocultured with NK cells (square). The bar graph depicts confluence of indicated conditions at 72 hrs. Representative images are shown on the right. Mean ± SEM; n = 3 biological replicates; scale bar = 200 µm. h. Proliferation of OVA-expressing Sptlc1-KO and AB HY15549 cells left untreated (circle) or cocultured with OT1 CD8+ T cells (square). The bar graph depicts confluence of indicated conditions at 98 hrs. Representative images are shown on the right. Mean ± SEM; n = 3 biological replicates; scale bar = 200 µm.
Figure 3.
Figure 3.. Loss of sphingolipid synthesis sensitizes cancer cells to IFNγ
a. RNAseq analysis from GFP+ Sptlc1-KO and Sptlc1-AB HY15549 cells grown in C57BL/6J (BL6) or NSG mice. After 12 days, tumors were collected, dissociated, and FACS sorted for RNA sequencing. b. Gene set enrichment analysis of mRNAs significantly enriched in Sptlc1-KO versus Sptlc1-AB HY15549 cells grown in C57BL/6J mice compared to those in NSG mice or cultured in vitro. GO terms are ranked by gene ratio, adjusted P-values (FDR, −log10) are color-coded, and circle size corresponds to the total number of genes in the gene set. c. Immunoblot of interferon-γ signaling pathway induction in Sptlc1-KO and Sptlc1-AB HY15549 cells left untreated or treated with interferon-γ (IFNγ) for 4 hrs. Gapdh is a loading control. d. Immunoblot of interferon-γ signaling pathway induction in Sptlc1-KO and Sptlc1-AB HY15549 cells cocultured with NK cells 5 hrs. Gapdh is a loading control. e. Proliferation of Sptlc1-KO (pink) and Sptlc1-AB (blue) HY15549 cells treated with the indicated concentrations of IFNγ for 92 hrs. Mean ± SD; n = 3 biological replicates. f. Proliferation of Sptlc1-KO (KO, pink), Sptlc1-AB (AB, blue), Sptlc1/Ifngr1-KO (KO_sgIFNGR1, dark gray) or Sptlc1/Jak1-KO (KO_sgJAK1, light gray) HY15549 cells left untreated (circle) or cocultured with NK cells (square). The bar graph shows confluence after 72 hrs. Mean ± SEM; n = 3 biological replicates. g. Proliferation of Sptlc1-KO HY15549 cells left untreated (circle) or cocultured with NK cells isolated from C57BL/6J (5:1 E:T, solid square) or Ifngtm1Ts mice (5:1 E:T, open square). The bar graph shows confluence after 84 hrs. Mean ± SEM; n = 3 biological replicates. h. Weights and image of Sptlc1-KO (pink) and Sptlc1-AB (blue) HY15549 tumors grown in C57BL/6J (circle) or Ifngtm1Ts (square) mice. Mean ± SEM; n = 3 mice/ group; scale bar = 1 cm. X marks tumors that were not detected at the endpoint. Data were analyzed using a one-way ANOVA with Benjamini-Hochberg multiple test correction.
Figure 4.
Figure 4.. Glycosphingolipid synthesis impacts cell surface expression of Ifngr1
a. Sptlc1-KO and Sptlc1-AB HY15549 cells untreated or incubated with a membrane-impermeable biotin tag. Cells were lysed and labeled proteins were affinity purified. Eluted protein and unlabeled whole cell protein lysates were analyzed by LC-MS. b. Log2 fold change in whole cell and membrane proteins between Sptlc1-KO (KO) versus Sptlc1-AB (AB) HY15549 cells. c. Immunoblot of whole cell and membrane protein lysates from Sptlc1-KO and Sptlc1-AB HY15549 cells. N = 3 biological replicates. d. Flow analysis of Ifngr1 surface expression in WT, Sptlc1-KO, and Sptlc1-AB HY15549 cells. e. Flow analysis of Ifngr1 surface expression in Sptlc1-KO and Sptlc1-AB HY15549 cells treated with 5 ng/mL IFNγ over time. Mean ± SEM; n = 3 biological replicates. f. Quantification of the number of Ifngr1+/Keratin+ cells in Sptlc1-KO (n = 2) and Sptlc1-AB (n = 3) HY15549 tumors grown in C57BL/6J mice for 12 days. Mean ± SEM, n= 3 images/ tumor. Scale bar = 50 µm. g. FACS-based screen to determine which sphingolipid metabolism genes impact the stability of Ifngr1 in the plasma membrane of HY15549 and KP LUAD cells. Live transduced cells were incubated with a fluorescent antibody against Ifngr1. High and low fluorescent populations were collected, and their sgRNA abundance was compared. h. Ranks of differential gene scores between high and low Ifngr1+ HY15549 and KP LUAD cells. De novo glycosphingolipid pathway genes among the top 20 scoring genes are highlighted. i. Immunoblot of IFNγ signaling pathway induction in sgCTRL-RFP and sgUgcg-RFP HY15549 cells untreated or treated with IFNγ for 2 or 4 hrs. j. Weights and image of sgCTRL-RFP and sgUgcg-RFP HY15549 tumors grown in C57BL/6J or Ifngtm1Ts mice. Mean ± SEM; n = 5 mice/ group; scale bar = 1 cm. Analyzed using a one-way ANOVA with Tukey’s multiple test correction. k. Weights and image of wildtype HY15549 tumors grown in C57BL/6J mice treated as indicated. Mean ± SEM; n = 7 (−/−, +/+) or 8 (others) mice/ group; scale bar = 1 cm. Analyzed using a one-way ANOVA with Tukey’s multiple test correction. l. Survival analysis of TCGA PDAC patients with high or low expression of SPTLC1/SPTLC2/KDSR. N = 177. Error bands = 95% confidence interval.

References

    1. Ubellacker JM et al. Lymph protects metastasizing melanoma cells from ferroptosis. Nature 585, 113–118 (2020). - PMC - PubMed
    1. Young RM et al. Dysregulated mTORC1 renders cells critically dependent on desaturated lipids for survival under tumor-like stress. Genes Dev 27, 1115–1131 (2013). - PMC - PubMed
    1. Ackerman D et al. Triglycerides Promote Lipid Homeostasis during Hypoxic Stress by Balancing Fatty Acid Saturation. Cell Reports 24, 2596–2605.e5 (2018). - PMC - PubMed
    1. Harayama T & Riezman H Understanding the diversity of membrane lipid composition. Nat Rev Mol Cell Biol 19, 281–296 (2018). - PubMed
    1. Wymann MP & Schneiter R Lipid signalling in disease. Nat Rev Mol Cell Biol 9, 162–176 (2008). - PubMed

MeSH terms