. 2024 Sep;633(8030):678-685.
doi: 10.1038/s41586-024-07797-z. Epub 2024 Aug 7.

Titration of RAS alters senescent state and influences tumour initiation

Affiliations

Titration of RAS alters senescent state and influences tumour initiation

Adelyne S L Chan et al. Nature. 2024 Sep.

Abstract

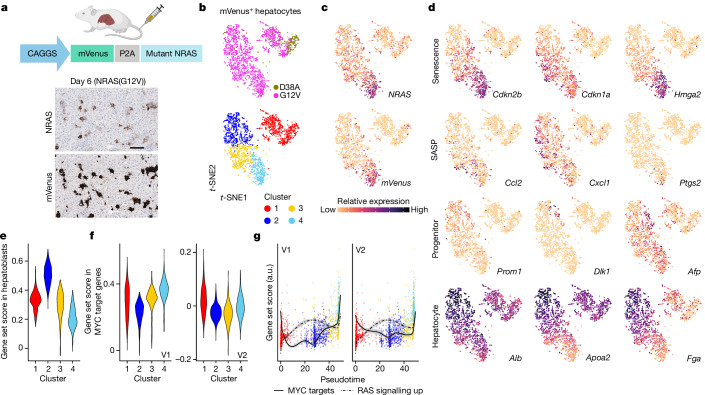
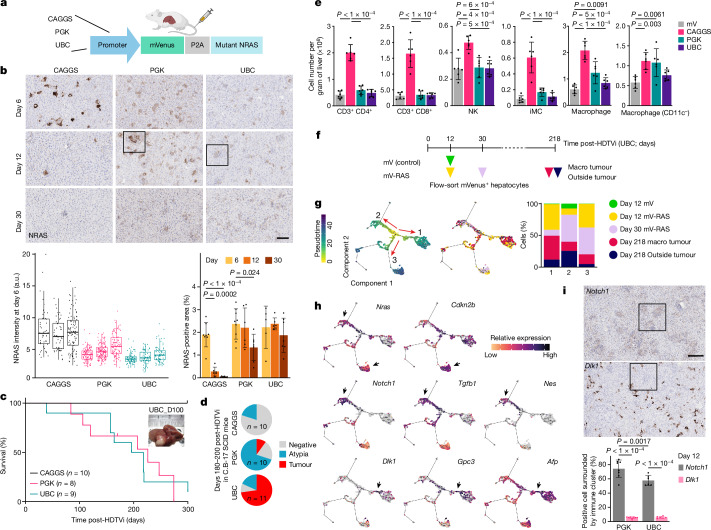
Oncogenic RAS-induced senescence (OIS) is an autonomous tumour suppressor mechanism associated with premalignancy1,2. Achieving this phenotype typically requires a high level of oncogenic stress, yet the phenotype provoked by lower oncogenic dosage remains unclear. Here we develop oncogenic RAS dose-escalation models in vitro and in vivo, revealing a RAS dose-driven non-linear continuum of downstream phenotypes. In a hepatocyte OIS model in vivo, ectopic expression of NRAS(G12V) does not induce tumours, in part owing to OIS-driven immune clearance3. Single-cell RNA sequencing analyses reveal distinct hepatocyte clusters with typical OIS or progenitor-like features, corresponding to high and intermediate levels of NRAS(G12V), respectively. When titred down, NRAS(G12V)-expressing hepatocytes become immune resistant and develop tumours. Time-series monitoring at single-cell resolution identifies two distinct tumour types: early-onset aggressive undifferentiated and late-onset differentiated hepatocellular carcinoma. The molecular signature of each mouse tumour type is associated with different progenitor features and enriched in distinct human hepatocellular carcinoma subclasses. Our results define the oncogenic dosage-driven OIS spectrum, reconciling the senescence and tumour initiation phenotypes in early tumorigenesis.


Conflict of interest statement

M.H. has received an unrestricted research grant from Pfizer and consults for AstraZeneca, Boston Scientific and Quotient Therapeutics. All of the other authors declare no competing interests.

Figures

Fig. 1
Fig. 1. Single-cell transcriptomics reveals OIS spectrum driven by oncogenic dosage in vivo.
a, Schematic of the HDTVi setup. IHC shows consequent heterogeneity in expression levels of ectopic NRAS(G12V) in experimental mice used for scRNA-seq. Scale bar, 100 μm. Schematic in a was created with BioRender.com. bd, t-SNE embeddings of single-cell-sequenced hepatocytes (n = 2,179 cells from n = 2 NRAS(G12V) and n = 1 NRAS(G12V/D38A) mice), coloured by experimental condition: cluster (b), expression of Nras or mVenus (c) and selected genes (d) as indicated. e,f, Changes in expression of hepatoblast-associated signature (Descartes Cell Types and Tissue library, Enrichr; e) and two versions of MYC target genes (MSigDB Hallmark) across clusters (f). g, Correlation between expression levels of MYC (V1 and V2) and RAS signatures (KRAS_SIGNALLING_UP, MSigDB Hallmark) over pseudotime calculated with AddModuleScore in Seurat. The height of the dot indicates the curated gene set score derived from senescence-associated genes. a.u., arbitrary units.
Fig. 2
Fig. 2. Oncogenic RAS induces OIS-like slow-cycling phenotype in RPE1 cells.
a, The ‘predictive reporter’ system. Schematic in a was created with BioRender.com. b, Distribution of mVenus intensity over time by flow cytometry for a population of cells heterogeneously expressing the construct. c, mVenus intensity of subpopulations established by flow sorting without RAS induction. d, Western blotting for the indicated proteins in the sorted subpopulations pre-induction and on day 6 post-induction with 4-OHT. e,f, Senescence phenotype of the sorted subpopulations assessed by SA-β-gal positivity (e) and BrdU incorporation (f). From left to right, n = 6, 5, 5, 6, 8, 5, 7, 5 and 5 (e) and n = 3, 3, 4, 4, 4, 3, 3, 3 and 3 (f) independent experiments. g, Flow-sorting experiment to enrich for cells in the S phase on day 6 post-induction. h, BrdU positivity for sorted versus unsorted cells on day 9 post-induction. From left to right, n = 4, 7, 4 and 6 independent experiments. FC, fold change. il, Differential expression of senescence-associated genes (i), MYC (j) and E2F target (k) gene sets, and RPE-associated genes (l) in the different subpopulations against matched control cells. Senescence-associated genes (i) were manually curated from pathway databases shown in Extended Data Fig. 4c. The scores for all hallmarks are in Extended Data Fig. 4d. Error bars denote s.d. (e,f,h). Statistical significance was determined using two-way Student’s t-test with no correction for multiple testing. Source data
Fig. 3
Fig. 3. Sub-OIS dosage of RAS is sufficient for tumorigenesis.
a, Schematic of experimental setup titrating down the dose of RAS introduced by HDTVi. The schematic in a was created with BioRender.com. b, NRAS IHC (top), quantification of NRAS intensity (three independent livers per condition; bottom left) and the percent of positive areas (bottom right). Magnified images are shown in Extended Data Fig. 6b. Scale bar, 100 µm. The box plot centre line indicates the median, the box limits indicate the first and third quartiles, and the whiskers indicate the largest values within 1.5 times the interquartile range. For the percent area, values are mean ± s.d. Two-way analysis of variance (ANOVA) with multiple comparisons followed by post hoc t-test with Bonferroni correction were used to determine significance. n = 8, 6, 6, 9, 6, 7, 5, 6 and 7 mice. c, Kaplan–Meier analysis for mice injected with the different plasmids. d, Tumour incidence in SCID mice injected with the indicated plasmids. n denotes the number of mice (c,d). e, Cell number per gram of liver for the indicated immune cell types (n = 6 mice per condition). Values are mean ± s.d. One-way ANOVA followed by Tukey’s honest significant difference test was used to determine significance. mV, mVenus; NK, natural killer cell. f, Experimental setup for scRNA-seq of mVenus-expressing hepatocytes (n = 2 per condition, 4,039 hepatocytes total). mVenus-expressing cells are derived from day 12 control (green), day 12 (yellow) and day 30 (purple) UBC-NRASG12V, macro-tumour (red) and outside tumour (dark blue). g,h, Pseudotime projection (left), coloured by sample of origin (right; g) and indicated genes of interest (h). The bar plot in g shows the percentage of cells from each sample, in each of the three pseudotime branches. The arrows in h indicate cell clusters expressing senescence-related (top) or progenitor-related genes. i, Percentage of Notch1+ or Dlk1+ hepatocytes within persistent immune cell clusters. Values are mean ± s.d. Two-way mixed-effects ANOVA followed by post hoc t-tests with Bonferroni correction were used to determine significance. n = 8, 8, 6 and 6 mice. Scale bar, 200 µm. Magnified images of the indicated areas are in Extended Data Fig. 8c. Source data
Fig. 4
Fig. 4. Dichotomous Dlk1/Afp- and Notch1/Tgfb1/Nes-driven tumour-initiating events in mice and human HCC.
a, Representative haematoxylin and eosin (H&E) staining and IHC for the indicated proteins in undifferentiated, early-onset (day 120; left) and well-differentiated, late-onset (day 226; right) tumours in mice injected with PGK-NRASG12V. The arrows indicate areas positive for NOTCH1 and nestin (left) and DLK1 (right). Serial sections were used from 15 mice. b, Correlation between tumour latency (days) and differentiation score (from DS1 (well differentiated) to DS4 (undifferentiated)) in the PGK and UBC cohorts in Fig. 3c. Statistical significance and the strength of linear correlation between tumour latency and differentiation score were calculated using simple linear regression analysis. The dots are coloured by positivity for nestin and NOTCH1. Note that two mice at day 274 were scored as DS2. c, Two tumour branches correlate with distinct classes of human HCC. Gene set scores for the indicated human HCC gene signatures in tumour cells of the two branches are shown. d, Representative IHC for the indicated proteins in a patient with hepatitis C virus (HCV)-related liver cirrhosis showing that NOTCH1+ hepatocytes were associated with immune cell clusters. Arrows indicate tumour borders. Serial sections were used for each sample. Total patients n = 28 (Extended Data Fig. 10a). Scale bars, 100 µm (a,d).
Extended Data Fig. 1
Extended Data Fig. 1. Characterisation of dose-dependent response to RAS expression at single cell level in the liver model.
a,b, Projection of single cells coloured by pseudotime (a) or cluster as in Fig. 1b (b). c, Top 50 genes driving pseudotime ordering, arranged in order of similarity of expression pattern across pseudotime. d, Heatmap of average gene expression across single cells in each cluster for 899 secretome genes. The top 5 enriched KEGG pathways in each of the clusters are shown. Values, -log10(FDR), red dotted line indicates significance level of 0.05. e, Expression of all DNA damage-related gene sets from entire MsigDB across clusters. Terms were manually trimmed but the full descriptions are in Supplementary Table 1. GOBP = Gene Ontology Biological Process, REAC = Reactome, GOMF = Gene Ontology Molecular Function, WP = WikiPathways. f, Distribution of geneset scores for target genes of the indicated RAS downstream transcription factors across clusters.
Extended Data Fig. 2
Extended Data Fig. 2. RAS dose-dependency in non-liver contexts.
a,b, tSNE projection of tdTom+ cells from the pancreas model coloured by sample-of-origin (a) and cluster (b). Schematic in panel a was created using BioRender (https://biorender.com). c,d, Distribution of expression levels at single-cell level for the indicated genes (c) and gene signature (d) in endogenous KrasG12D-driven pancreatic tumour model (PRT mice). Values for preneoplastic “Early” and “PanIN” were divided into two based on the clustering in Extended Data Fig. 1b, as indicated by the colour of the box/violin. Cells from the Cdkn2a/p16 positive Cluster 11 were designated as “OIS”, whilst all the other “Early” and “PanIN” cells were designated as “non-OIS”. PDAC, pancreatic ductal adenocarcinoma. n values indicate number of cells. e, tSNE projections coloured by indicated genes-of-interest. f, Expression of KRAS or HRAS in TCGA samples of the indicated tumour types, separated by RAS mutation status. wt, wild-type; mt, mutant. n values indicate number of patients. g,h, Upregulation of KRAS in human pancreatic (g) and lung (h) cancer cells, compared to normal epithelial cells, in public scRNA-seq datasets. Ductal cell clusters were identified using KRT19 expression, acinar cell clusters by CPA1 and CPA2 (e). KRAS expression in lung epithelial cells of human lung adenocarcinoma samples, comparing between adjacent normal and tumour cells from different disease stages (f). Lung epithelial cell subset is based on annotation by the original authors. n values indicate number of cells. All boxplot centre line indicates median, box limits indicate first- and third-quartiles and whiskers indicate largest values within 1.5 * interquartile range.
Extended Data Fig. 3
Extended Data Fig. 3. Characterisation of the in vitro predictive reporter system.
a, Flow cytometry analysis for mVenus intensity in uninduced cells, at different timepoints post-sorting in RPE1 cells. b, Representative phase contrast pictures of SA-β-gal assay (quantifications in Fig. 2e). Scale bar = 50 µm. c, IL-8 immunofluorescence for ‘S’ and ‘XL’ RPE1 cells on Day 9 comparing unsorted cells and cells, which were sorted on Day 6 to enrich for S-phase cells. d, Distribution of mVenus intensity over time by flow cytometry for a mixed population of TIG3 cells expressing the predictive reporter construct. e,f, Senescence phenotype of the TIG3 sorted subpopulations was assessed by Western blotting for the indicated proteins (e), SA-β-gal positivity and BrdU incorporation (f). Error bars, s.d. Statistical significance was determined using two-way pairwise student’s t-test with no correction for multiple testing. g, γH2AX staining (left) and quantification of mean γH2AX intensity within a nuclear mask for the indicated conditions (right) in RPE1 and TIG3 cells. Images are representative from n = 2 per condition where n = independent experiments. N, plain. Etop, Etoposide (50 μM) treatment for 24 h as positive controls. Individual replicates are shown in quantification. Boxplot centre line indicates median, box limits indicate first- and third-quartiles and whiskers indicate largest values within 1.5 * interquartile range. One-way ANOVA followed by Tukey’s HSD test. ***p < 0.001. Statistical significance was calculated between the indicated conditions, pooling values from both replicates. Source data
Extended Data Fig. 4
Extended Data Fig. 4. RNA-seq analysis for individual cell populations in RPE1 cells expressing predictive reporter construct.
a-c, Principal component analysis (a), number of differentially expressed (DE) genes (b), and pathway enrichment analysis (c) for the sorted subpopulations. N, plain RPE1 cells (no mVenus-P2A-ER:HRASG12V transduction). n = 5 independent samples for each condition. d, Distribution of log-2-fold change values for genes in MsigDB Hallmark genesets for each of the subpopulations, comparing each Day 6 condition with its respective uninduced control. MYC targets and cell cycle genes are highlighted in red.
Extended Data Fig. 5
Extended Data Fig. 5. Meta-analysis of senescence-associated transcriptomic changes of MYC target genes.
a, Differential expression of TF-targets in each RPE1 subpopulation as well as indicated IMR90 cells. Known downstream TFs in the RAS-MAPK pathway were analysed. MYC (v1, v2) in RPE1 were duplicated from Fig. 1j for comparison. b, Gene expression datasets were downloaded from NCBI GEO (Supplementary Table 2), comparing different stress-induced cellular phenotypes associated with reduced cell cycling. * indicates IMR90 datasets that were utilised in (a). The datasets were processed using the same analysis pipeline, colours indicate log2-fold change of individual MYC-target genes (MSigDB Hallmark) between each of the conditions and their corresponding growing controls. PD = Population Doubling. Samples are in the order detailed in Supplementary Table 2. c,d, scRNA-seq analysis in RPE1 subpopulations (n = 9,047 cells). For RAS-induced samples, we used both individual subpopulations (n = 1/subpopulation) and a pooled sample of all subpopulations (n = 1) as a replicate. Control was a mix of all subpopulations (no 4OHT, n = 1). Each sample was Hashtagged, pooled and run as the same run. Cell-cycle phases were annotated using Seurat’s inbuilt CellCycleScoring function and gene markers for S- and G2/M-associated genes (c). Indicated gene signatures (MsigDB Hallmarks) were scored (d). e, Changes in expression levels of MYC- and E2F-target genes (MSigDB Hallmark) in tumour-initiating cells (TGFβ-reporter positive) compared to the rest of the tumour cells (TGFβ-reporter negative) in a HRASG12V-driven mouse squamous cell carcinoma model (Supplementary Table 2). The downstream TFs in the RAS-MAPK pathway were included as a comparison.
Extended Data Fig. 6
Extended Data Fig. 6. Characterisation of DNA damage and immune cell clusters in NRASG12V-injected livers.
a, NRAS-positive hepatocytes with γH2AX foci. Cells with >1 foci within the nucleus were counted as positive. Note nonspecific autofluorescence mainly from red blood cells. Values, mean (s.d.). p-values are Two-way mixed-effects ANOVA followed by post-hoc t-tests with Bonferroni correction. Scale bars = 20 µm. b, Persistent immune cell clusters in sub-OIS-NRASG12V livers. Selected areas of NRAS IHC Day 12 post-HDTVi in Fig. 3b are magnified. c, Representative IHC for indicated immune cell markers in persistent immune cell clusters. Each row consists of serial sections. d, Representative IHC for FoxP3 (Treg marker) in indicated samples. Values, mean (s.d.). p-values are Two-way ANOVA followed by post-hoc t-tests with Bonferroni correction. Scale bars = 100 µm. Arrows indicate immune cell clusters (c-d). n = number of mice (a,d). Source data
Extended Data Fig. 7
Extended Data Fig. 7. Additional characterisation of hepatocyte response to different oncogenic NRAS dosages.
a,b, tSNE embeddings coloured by sample of origin (as in Fig. 3f) and genes of interest (a), and geneset score (b). Arrows indicate cell clusters expressing high NRAS (with either OIS or Notch/TGFβ signature, left) or progenitor markers (right). c, Alternative trajectory inference analyses to Fig. 3i for scRNA-seq, using different algorithms on the same data as derived from the time series cohort of mice injected with low-dose NRAS. Branches indicated on the left-most panel in dotted circles are numbered according to Fig. 3g. d, IHC validation for Dlk1 on Day 9 post HDTVi (left) and quantification of % Dlk1 positive area (right, n represents number of mice). Values, mean (s.d.). p-values are two-way ANOVA followed by post-hoc t-tests with Bonferroni correction. Scale bar = 100 µm. Source data
Extended Data Fig. 8
Extended Data Fig. 8. Characterisation of tumours associated with distinct TIC events.
a, Representative IHC for the indicated proteins in tumours induced by HDTVi of NRASG12V-IRES-N1ICD construct in mice (n = 6), showing co-expression of Notch1 and Nestin and mutual exclusivity between Notch1+ tumours and Afp+ cells (high magnification panels, right). Of note, while the tumour cells were poorly differentiated, the Afp+ cells maintained histological features of hepatocytes. b,c, Representative IHC for the indicated proteins on Day 9 (b) or Day 12 (c) livers after NRASG12V-HDTVi with the indicated dosages. Each column (b) represents serially sectioned images (n ≥ 5 mice). Magnified images from Fig. 3k are shown in (c) (n ≥ 6 mice). Scale bars = 100 µm (b) or 200 µm (c). Arrows indicate immune cell clusters. Dlk1 was mostly excluded from immune cell clusters. Notch1 staining was typically clearer in Day 12 (c), involved in ‘persistent’ immune cell clusters. d, Sorafenib treatment led to reduced accumulation of macrophage in UBC-NRASG12V-livers. Representative IHC for indicated proteins (n = 7 mice per condition). Serial sections were utilised in each condition. Scale bars = 100 µm. Values, mean (s.d.). p-values are unpaired t-test. Source data
Extended Data Fig. 9
Extended Data Fig. 9. Validation of gene signatures in two TIC branches.
(a-c) Representative serially sectioned IHC images of indicated tumours for the indicated proteins. All undifferentiated (DS 4) tumours (n = 5 mice) were CK19-positive (a). Dichotomous expression of either Notch1 or Dlk1 are shown even in the same tumour (b). 5 out of 6 Notch1-positive tumours were Tgfβ1-positive (c). Scale bars = 100 µm. Arrows indicate Dlk1-positive cells within the Notch1/Nestin-tumour. Of note, the Dlk1-positive cells tend to be well-differentiated and express low level of NRAS. (d) Random walk plots for geneset enrichment analysis for the indicated genesets against ranked genes between poorly- and well-differentiated HCC based on human liver cancer cell lines. (e) Kaplan-Meier analysis for the indicated gene signatures in TCGA-LIHC (Liver hepatocellular carcinoma) dataset. n values indicate number of genes in signature. HR = Hazard ratio for top quartile vs. bottom quartile, p = Log-rank p-value.
Extended Data Fig. 10
Extended Data Fig. 10. Immune cell clusters around NOTCH1-positive hepatocytes in human cirrhotic livers.
a, Frequency of NOTCH1 and/or DLK1-positive hepatocytes in liver cirrhosis patients examined. Steatotic liver disease (SLD) includes both non-alcoholic fatty liver disease (NAFLD) and alcohol-related liver disease (ALD). b, Representative IHC for the indicated proteins in a patient with SLD-related cirrhosis, showing dichotomous expression of NOTCH1 and DLK1 in the same liver. Scale bar = 500 µm in the centre panels and 50 µm in the magnified panels. c, Representative IHC for the indicated proteins in patients with steatotic liver disease-related cirrhosis. Serial sections were utilised for all patients in (a). Selected area is magnified with arrows, indicating DLK1-positive hepatocytes. (d) Kaplan-Meier analysis for male and female mice injected with the UBC-NRASG12V plasmids (n = 8 per condition). IHCs were performed in all patient samples (Supplementary Table 3). Scale bars = 100 µm.

References

    1. Lee, S. & Schmitt, C. A. The dynamic nature of senescence in cancer. Nat. Cell Biol.21, 94–101 (2019). - PubMed
    1. Birch, J. & Gil, J. Senescence and the SASP: many therapeutic avenues. Gene Dev.34, 1565–1576 (2020). - PMC - PubMed
    1. Kang, T.-W. et al. Senescence surveillance of pre-malignant hepatocytes limits liver cancer development. Nature479, 547–551 (2011). - PubMed
    1. Hao, X., Wang, C. & Zhang, R. Chromatin basis of the senescence-associated secretory phenotype. Trends Cell Biol.32, 513–526 (2022). - PMC - PubMed
    1. Olan, I. et al. Transcription-dependent cohesin repositioning rewires chromatin loops in cellular senescence. Nat. Commun.11, 6049 (2020). - PMC - PubMed

MeSH terms