. 2024 Sep;633(8029):433-441.
doi: 10.1038/s41586-024-07803-4. Epub 2024 Aug 7.

DNA-sensing inflammasomes cause recurrent atherosclerotic stroke

Collaborators, Affiliations

DNA-sensing inflammasomes cause recurrent atherosclerotic stroke

Jiayu Cao et al. Nature. 2024 Sep.

Abstract

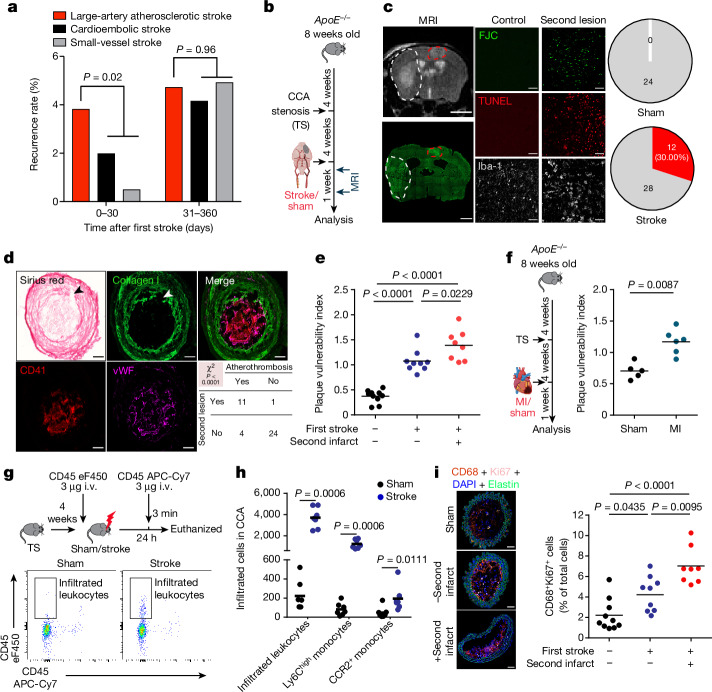
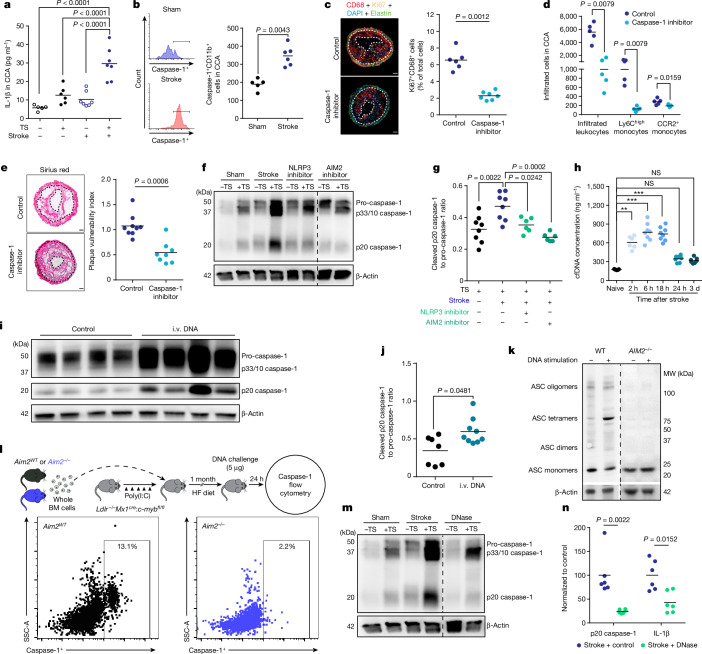
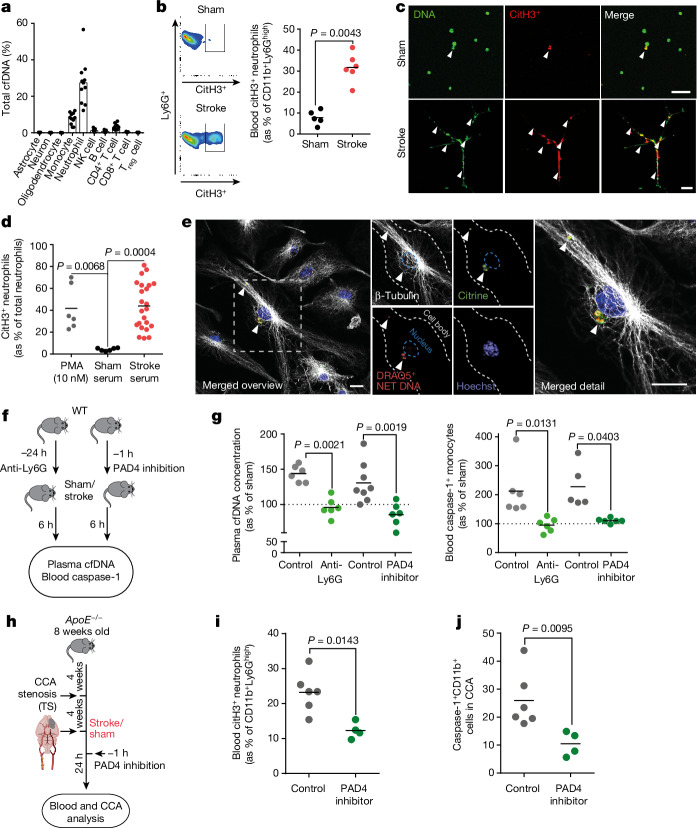
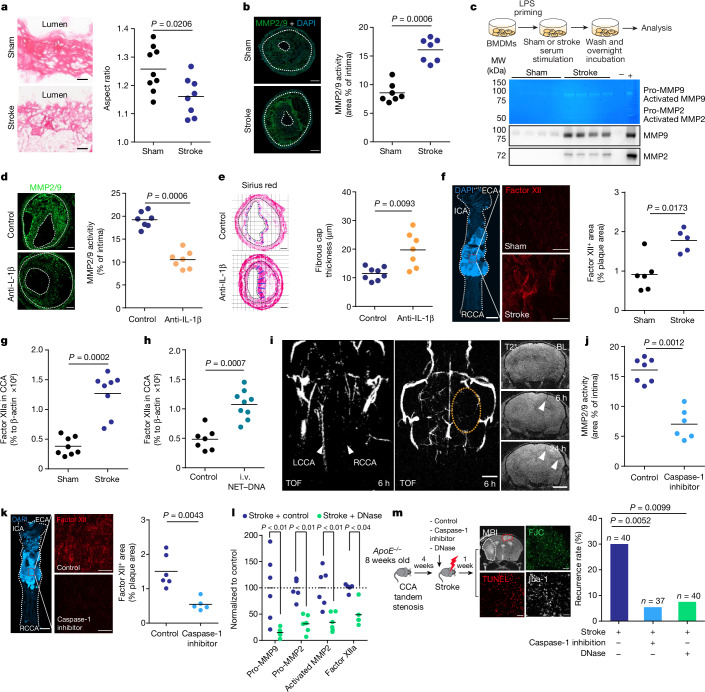
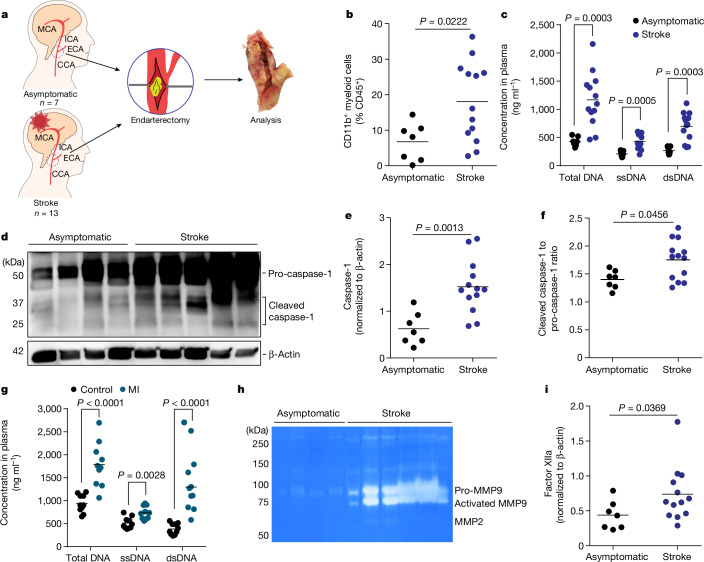
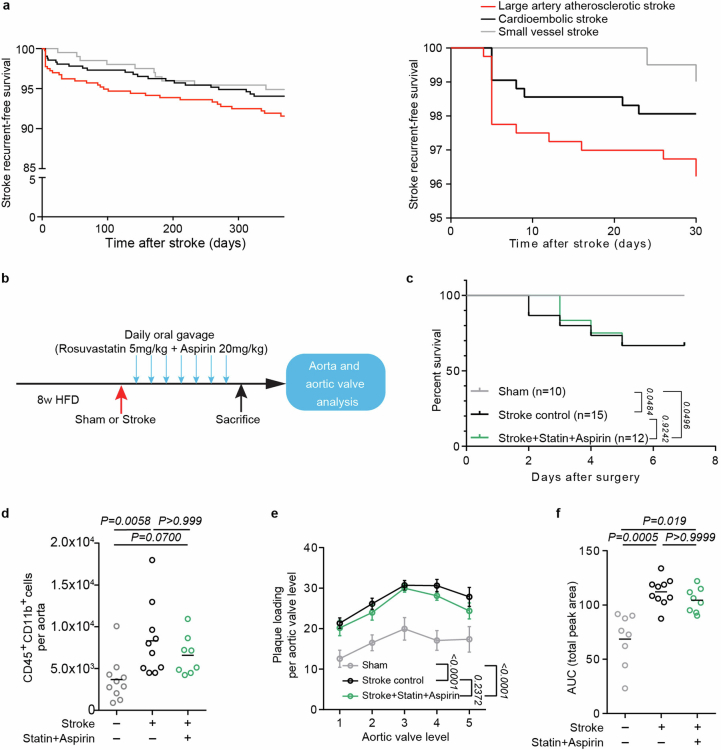
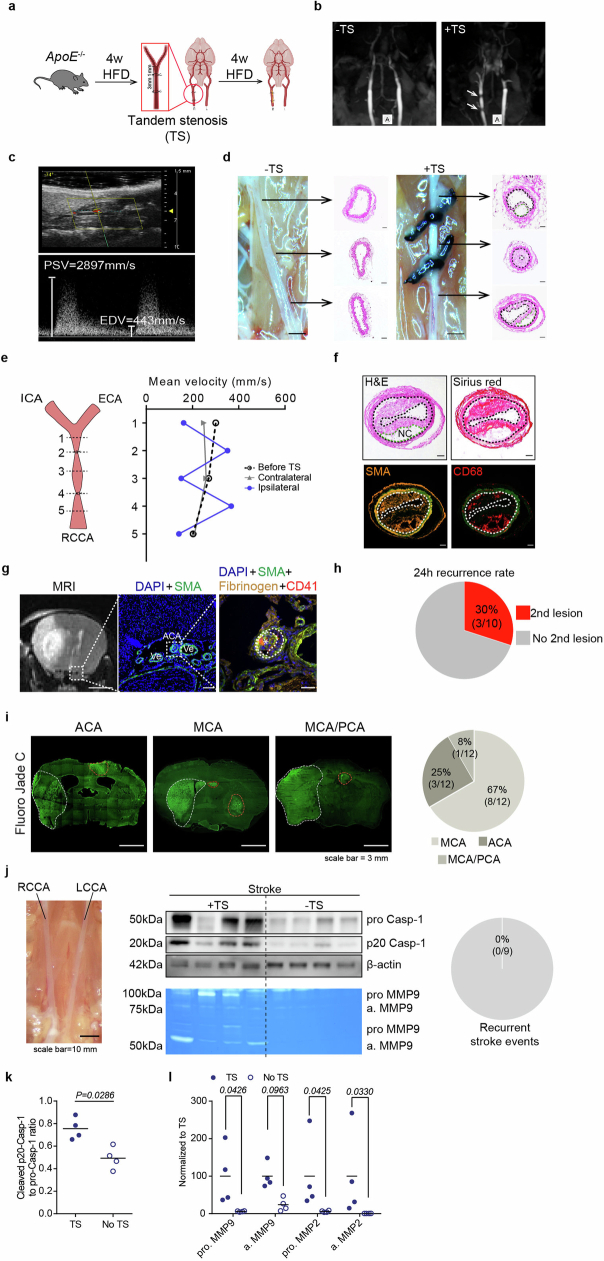
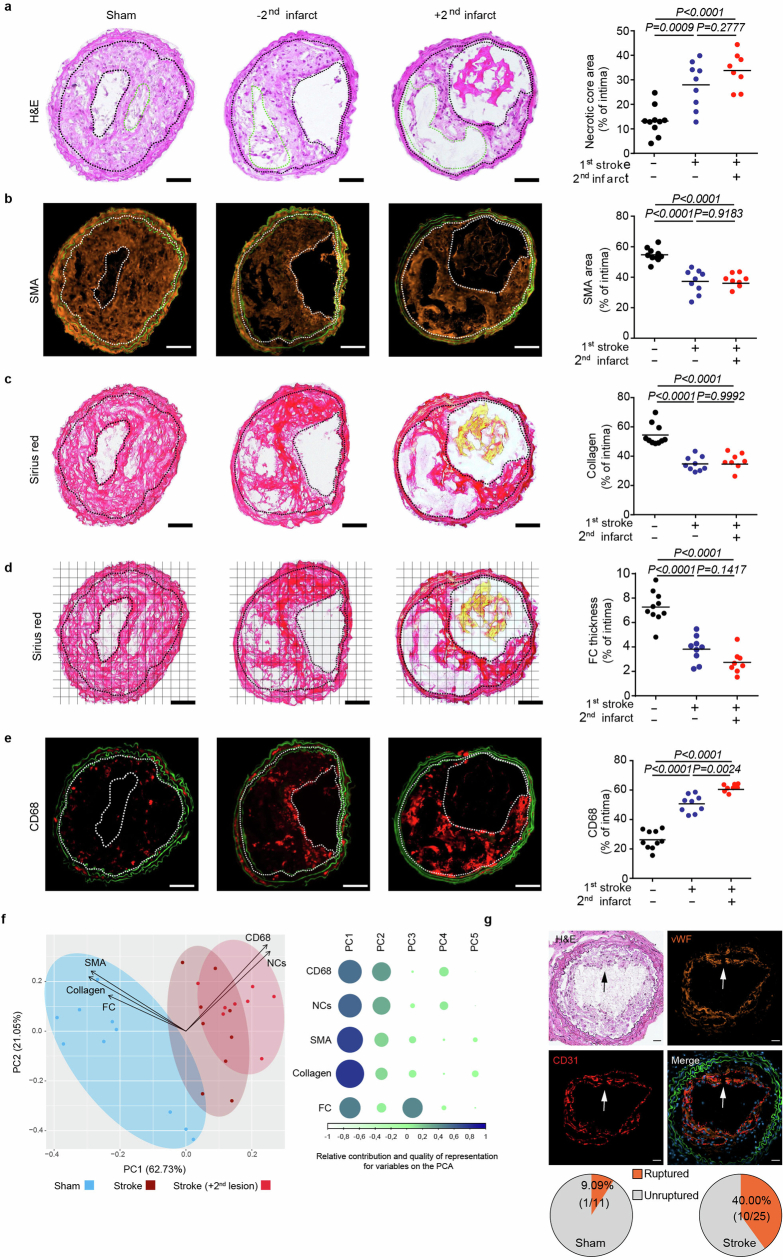
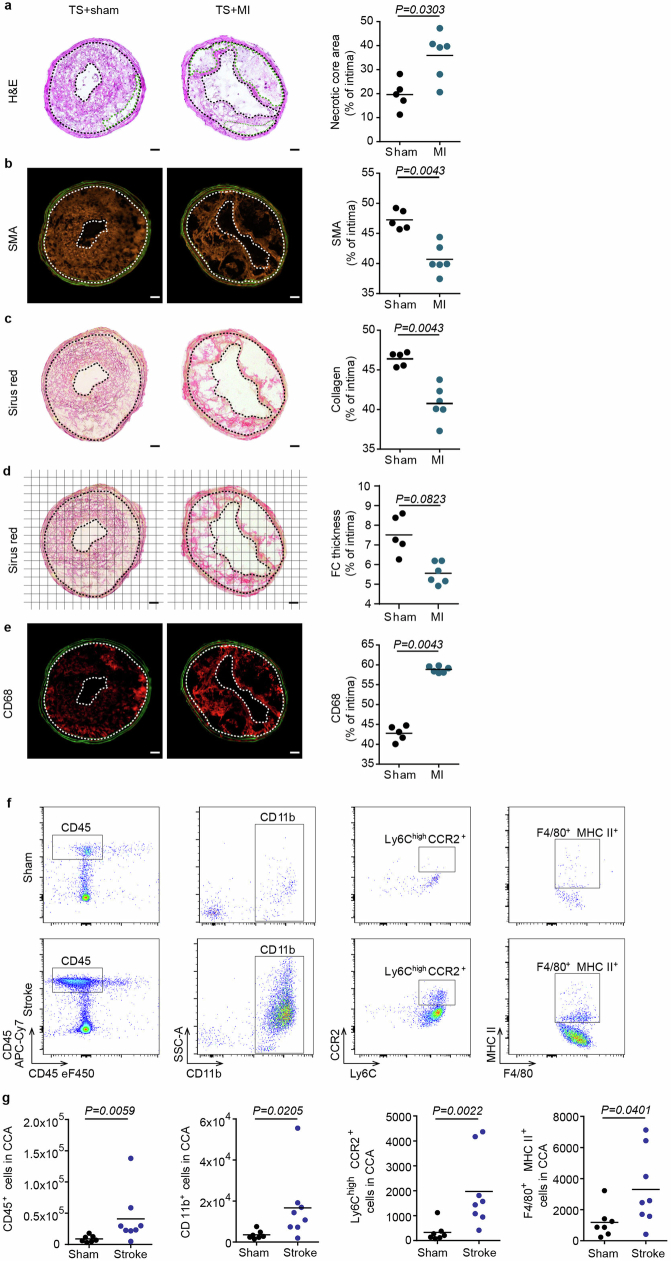
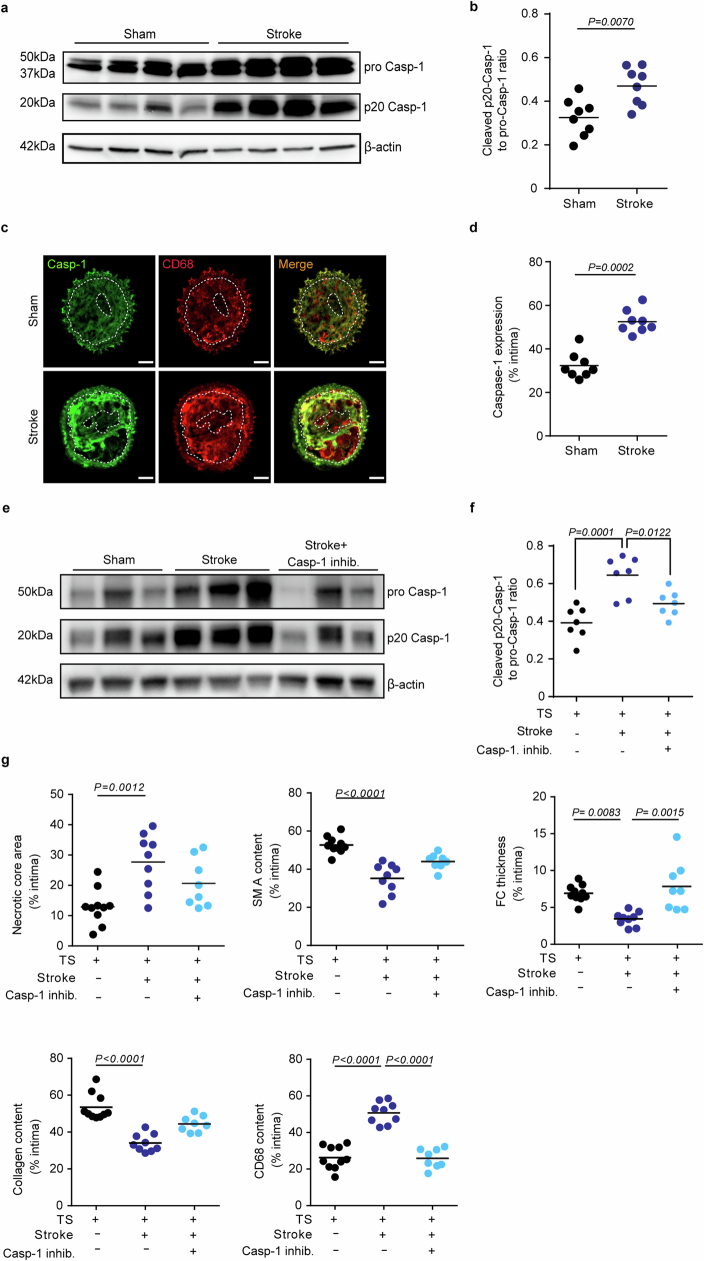
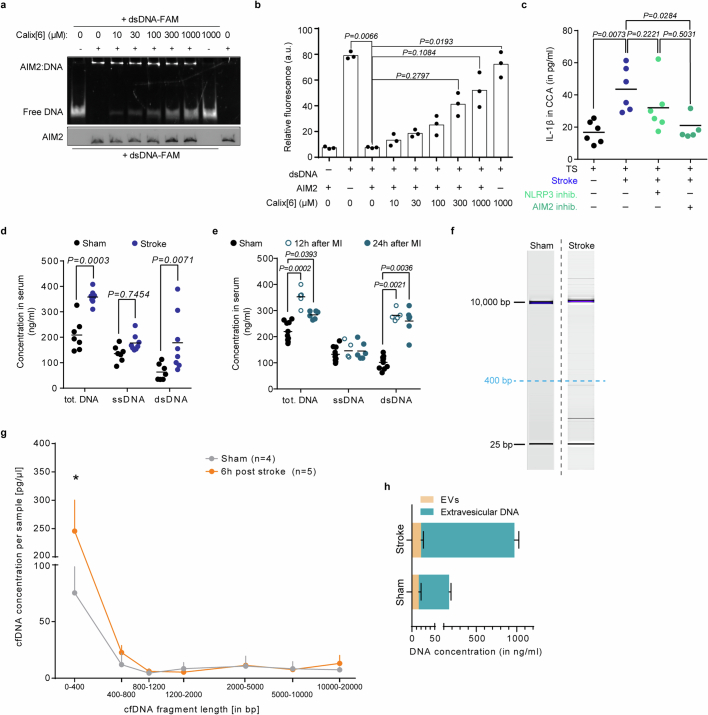
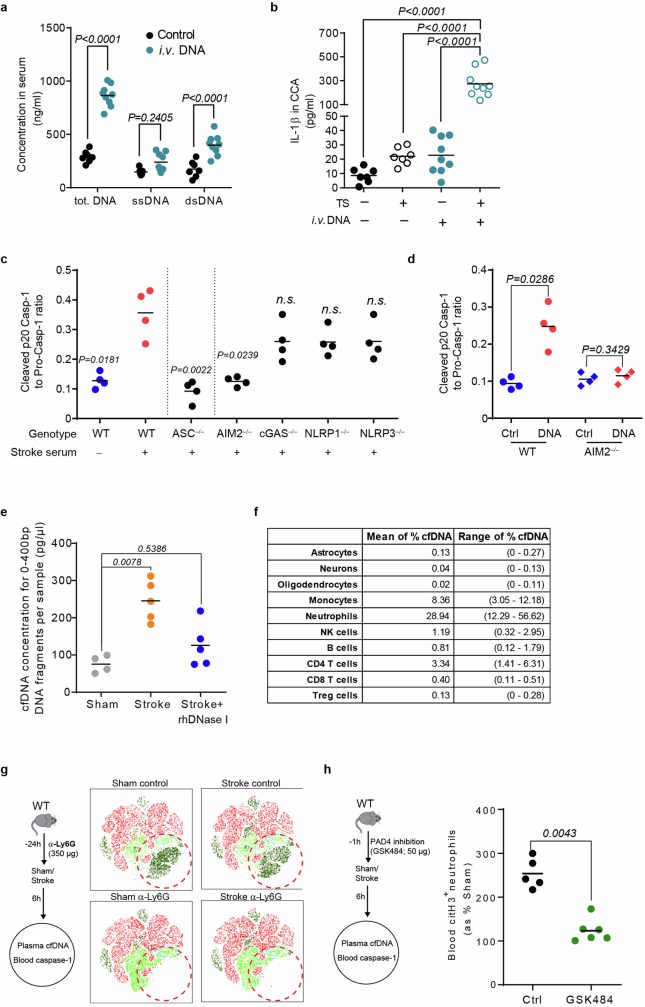
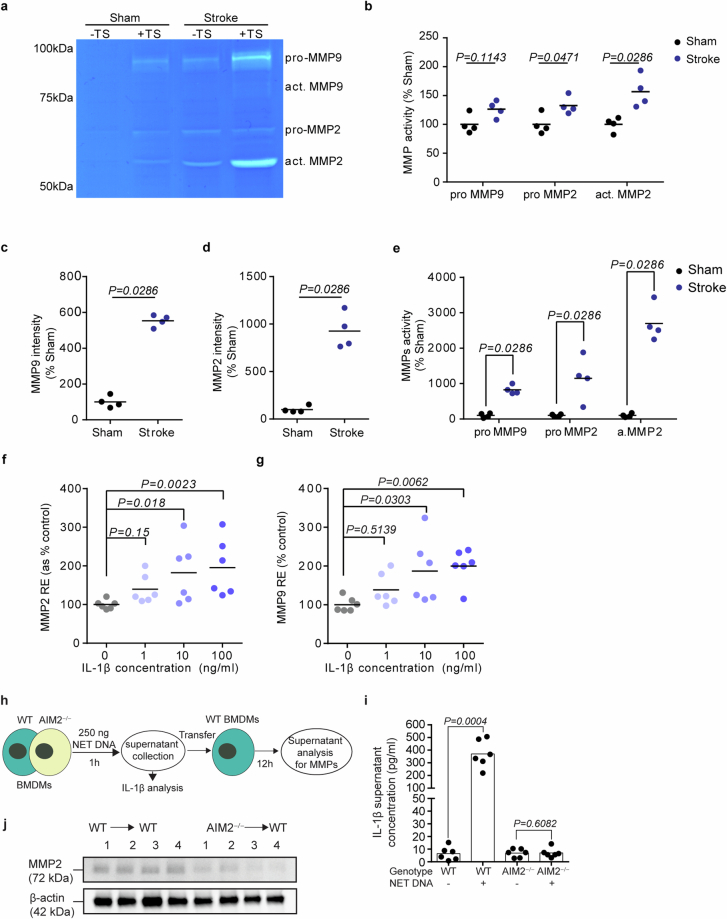
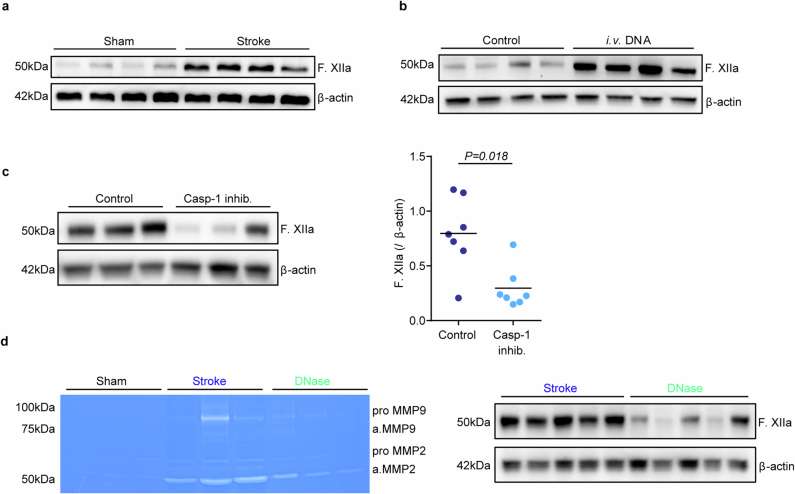
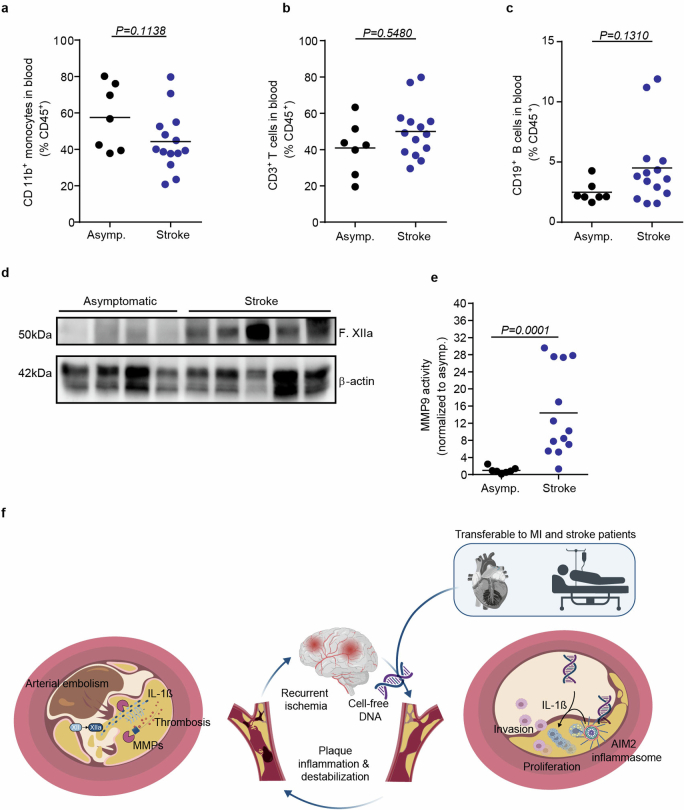
The risk of early recurrent events after stroke remains high despite currently established secondary prevention strategies1. Risk is particularly high in patients with atherosclerosis, with more than 10% of patients experiencing early recurrent events1,2. However, despite the enormous medical burden of this clinical phenomenon, the underlying mechanisms leading to increased vascular risk and recurrent stroke are largely unknown. Here, using a novel mouse model of stroke-induced recurrent ischaemia, we show that stroke leads to activation of the AIM2 inflammasome in vulnerable atherosclerotic plaques via an increase of circulating cell-free DNA. Enhanced plaque inflammation post-stroke results in plaque destabilization and atherothrombosis, finally leading to arterioarterial embolism and recurrent stroke within days after the index stroke. We confirm key steps of plaque destabilization also after experimental myocardial infarction and in carotid artery plaque samples from patients with acute stroke. Rapid neutrophil NETosis was identified as the main source of cell-free DNA after stroke and NET-DNA as the causative agent leading to AIM2 inflammasome activation. Neutralization of cell-free DNA by DNase treatment or inhibition of inflammasome activation reduced the rate of stroke recurrence after experimental stroke. Our findings present an explanation for the high recurrence rate after incident ischaemic events in patients with atherosclerosis. The detailed mechanisms uncovered here provide clinically uncharted therapeutic targets for which we show high efficacy to prevent recurrent events. Targeting DNA-mediated inflammasome activation after remote tissue injury represents a promising avenue for further clinical development in the prevention of early recurrent events.


Conflict of interest statement

The authors declare no competing interests.

Figures

Fig. 1
Fig. 1. Ischaemic events induce recurrent stroke and exacerbate plaque vulnerability.
a, Recurrence rates by incident stroke aetiology in the first month (days 0–30) and months 2–12 (days 31–360) in a population of 1,798 patients with stroke (log-rank test in Kaplan–Meier curves; Extended Data Fig. 1a). b, Experimental design. Eight-week-old high-cholesterol diet (HCD)-fed ApoE−/− mice underwent tandem stenosis (TS) surgery, and stroke or sham surgery 4 weeks later. The recurrence of secondary ischaemia in the contralateral hemisphere was examined by MRI and histological analysis. c, Representative MRI image (the white dashed line denotes the primary stroke area; the red dashed line indicates recurrent contralateral stroke). Fluoro Jade C (FJC; lower left panel) staining corresponding to MRI. Scale bars, 3 mm. Representative images of histological stainings (FJC, TUNEL and Iba-1) from control mice or mice with a secondary lesion (middle panels). Scale bars, 50 μm. Pie charts for stroke recurrence 7 days after sham or stroke surgery (n = 24 (sham) and n = 40 (stroke); red denotes with secondary lesion, and grey indicates without secondary lesion) are also shown (right panels). d, Representative images of a plaque rupture (the arrowheads in the Sirius red and collagen I stainings) with contiguous CCA thrombus stained for von Willebrand factor (vWF) and platelets (CD41). Chi-squared test (P < 0.0001) for occurrence of CCA thrombi and secondary brain lesions (n = 12 per group). Scale bars, 50 µm. e, Quantification of plaque vulnerability in CCA sections 7 days after sham or stroke surgery (analysis of variance (ANOVA); n = 9–10 per group). f, Experimental design as shown in panel b, but with induction of myocardial infarction (MI) instead of stroke (left), and quantification of plaque vulnerability (right; U-test; n = 5–6 per group). g,h, Experimental design and representative FACS plots (g) for quantification (h) of infiltrated leukocytes and Ly6Chigh and CCR2+ monocyte subpopulations in CCA 24 h after sham or stroke surgery (U-test; n = 6 per group). i.v., intravenous. i, Representative images (left) and quantification (right) of proliferating macrophages (ANOVA; n = 8–10 per group). Scale bars, 50 μm. e,f,h,i, Bars indicate the mean.
Fig. 2
Fig. 2. Stroke induces double-stranded DNA-dependent inflammasome activation in atherosclerotic plaques.
a,b, IL-1β concentrations (K-test, n = 5–7 per group; a) and caspase-1 activity (FAM660 flow cytometry; b) in CCA 24 h after sham or stroke surgery (U-test, n = 5–6 per group). c,d, Analysis of macrophage proliferation normalized to total cell counts (right; U-test, n = 6–7 per group; c) and analysis of infiltrated leukocytes (d) in CCA sections of control-treated or caspase-1 inhibitor (VX765)-treated mice 7 days after stroke (K-test; n = 5 per group). Scale bars in c, 50 μm. e, Picro Sirius red stainings for stroke (left) and quantification of plaque vulnerability (right; U-test; n = 8–9 per group). Scale bars, 50 µm. f,g, Immunoblot for caspase-1 cleavage in CCA lysates 24 h after sham, stroke, stroke + NLRP3 inhibitor (MCC950) or AIM2 inhibitor (4-sulfonic calix[6]arene) administration (f) and corresponding immunoblot quantification (ANOVA; n = 8 per group; g). h, Total cfDNA serum concentrations at indicated timepoints after stroke and naive mice (K-test; n = 5–8 per group). NS, not significant. i,j, Immunoblot (i) and quantification (j) of cleaved p20 caspase-1 in CCA lysates from HCD-fed ApoE−/− mice with tandem stenosis surgery alone (control) or 24 h after i.v. DNA injection (U-test; n = 7–9 per group). k, Immunoblot for ASC oligomerization of WT or AIM2−/− macrophages after stimulation with DNA. MW, molecular weight. l, Experimental design of Aim2WT or Aim2−/− bone marrow (BM) transplantation to Ldlr−/−:Mx1cre:c-mybfl/fl mice receiving i.v. DNA (top) and flow cytometry histograms (bottom) of caspase-1 activity in bone marrow recipients 24 h after i.v. DNA. HF, high fat; SSC-A, side scatter area. m,n, Immunoblot (m) and quantification (n) of cleaved p20 caspase-1 in CCA lysates of HCD-fed ApoE−/− with tandem stenosis surgery receiving 1,000 U i.v. DNase immediately before stroke (U-test; n = 6 per group, shown as a ratio to the mean of the control group). Raw membrane images of all immunoblots are in Supplementary Fig. 1. ae,g,h,j,n, Bars indicate the mean.
Fig. 3
Fig. 3. Neutrophil NETosis is the main source of post-stroke cfDNA.
a, Tissue-of-origin analysis using cell-type-specific methylation markers for cfDNA isolated from n = 10 patients with stroke within 24 h after symptom onset. NK, natural killer; Treg cell, regulatory T cell. b, Flow cytometry histograms (left) and quantification (right) of citrullinated histone 3 (citH3+) Ly6G+ neutrophils 4 h after sham or stroke (U-test; n = 5–6 per group). c, Microphotographs of mouse neutrophils stimulated with 25% sham or stroke serum for 4 h. The arrowheads indicate DNA+citH3+ NET formations. Scale bars, 50 µm. d, Quantification of phorbol 12-myristate 13-acetate (PMA)-stimulated, sham serum-stimulated or stroke serum-stimulated neutrophils, shown as citH3+ neutrophils of total cultured neutrophils (K-test; n = 6–23 replicates per group from 3 independent experiments). e, BMDMs from ASC–citrine reporter mice were incubated with 250 ng exogenous DRAQ5-labelled NET–DNA. Immunohistochemistry was used to visualize cytoplasmatic citrine+DRAQ5+ ASC–DNA specks. The cytoplasm and nucleus of the BMDMs were visualized using β-tubulin and Hoechst. Arrowheads indicate colocalization of ASC specks and DRAQ5+ NET DNA. Scale bars, 5 µm. f, Experimental design for anti-Ly6G neutrophil depletion and PAD4 inhibition before stroke. g, cfDNA concentration (shown as percentage normalized to sham) of mice with control, anti-Ly6G or PAD4 inhibitor treatment (left; K-test; n = 6–8 per group) and caspase-1 activity in blood monocytes (percentage of sham, indicated by dotted line) by flow cytometry (right; K-test; n = 5–8 per group). h, NETosis was inhibited using a PAD4 inhibitor before stroke in HCD-fed ApoE−/− with tandem stenosis. i, Quantification of citH3+Ly6G+ neutrophils 24 h after stroke surgery in blood (U-test; n = 4–6 per group). j, Flow cytometry analysis of caspase-1 activity in CD11b+ CCA monocytes 24 h after stroke (U-test; n = 4–6 per group). b,d,g,i,j, Bars indicate the mean.
Fig. 4
Fig. 4. Inhibition of post-stroke inflammasome activation prevents plaque destabilization and recurrent stroke events.
a, Collagen I orientation in fibrous caps using aspect ratio (AR > 1 is predominant orientation and AR ~ 1 is random orientation; U-test; n = 8–9). Scale bars, 50 µm. b, Quantification of MMP2/9 activity by in situ zymography on CCA sections 7 days after sham or stroke (U-test; n = 7). Scale bars, 50 μm. c, Experimental design (top), representative images (middle) for gelatin zymography and immunoblot (bottom) of MMP2/9 in culture medium (quantification in Extended Data Fig. 8c,d). d, In situ zymography of CCA sections 7 days after stroke, receiving control or IL-1β-specific antibodies (U-test; n = 7). Scale bars, 50 μm. e, Analysis of fibrous cap thickness between treatment groups (U-test; n = 7–8). Scale bars, 50 μm. f, Whole CCA en face immunohistology for factor XII 24 h after sham or stroke (U-test; n = 5–6). ECA, external carotid artery; ICA, internal carotid artery; RCCA, right CCA. Scale bars, 500 µm. g, Activated factor XII in CCA lysates 7 days after sham or stroke (U-test; n = 8). h, Factor XIIa in CCA lysates 24 h after i.v. DNA injection (U-test; n = 7–9). i, HCD-fed ApoE−/− with tandem stenosis surgery received i.v. DNA. Cerebral vascularization (TOF-MR angiography) and intravascular thrombus formation by in vivo MRI in HCD-fed ApoE−/−. Left CCA (LCCA) and (patent) right CCA (RCCA) are indicated by arrowheads (left); the orange dotted circle (middle panel) denotes the hypoperfused right middle cerebral artery territory. The arrowheads (right) indicate intravascular thrombi. Scale bars, 2 mm. BL, baseline. j, In situ zymography for MMP2/9 activity in CCA sections 7 days after stroke (U-test; n = 6–7). k, Factor XII+ area on CCA en face images between treatment groups (U-test; n = 5–6). Scale bars, 500 µm. l, Pro-MMP9, pro-MMP2, activated MMP2 and factor XIIa quantification in mice receiving 1,000 U DNase after stroke (U-test; n = 6, normalized to control, indicated by horizontal dotted line). m, Experimental design (left) and quantification of the 7-day recurrence rate between treatment groups (right; chi-squared test). Scale bars, 50 µm. a,b,dh,jl, Bars indicate the mean.
Fig. 5
Fig. 5. Stroke increases atherosclerotic plaque inflammation and MMP activity in patients.
a, Study layout illustrating the collection of endarterectomy samples from 7 asymptomatic patients with ICA stenosis and 13 patients with stroke undergoing endarterectomy of the symptomatic carotid artery in the acute phase after stroke. b, Flow cytometry analysis of plaques showing the percentage of CD11b+ myeloid cells out of total leukocytes (CD45+; U-test; n = 7–13 per group). c, Quantification of total cfDNA (total DNA), single-stranded DNA (ssDNA) and double-stranded DNA (dsDNA) in plasma (U-test; n = 7–13 per group). df, Immunoblot for caspase-1 cleavage in atherosclerotic plaque lysates of asymptomatic or symptomatic patients (d) and corresponding quantification of total caspase-1 (e, normalized to β-actin) and cleaved p20 caspase-1 (f, normalized to caspase-1; U-test; n = 7–13 per group). g, Plasma cfDNA concentrations in patients with myocardial infarction (U-test; n = 10 per group). h, Gelatine zymography of plaque lysates from asymptomatic or symptomatic patients (quantification in Extended Data Fig. 10e). i, Factor XIIa in plaque lysates from asymptomatic or symptomatic patients (U-test; n = 7–13 per group). b,c,eg,i, Bars indicate the mean.
Extended Data Fig. 1
Extended Data Fig. 1. Established secondary prevention fails to attenuate early post-stroke vascular inflammation and atheroprogression.
a. Kaplan-Meier curves for recurrence-free survival of stroke patients from the same cohorts (PROSCIS and DEMDAS/DEDEMAS) as shown in Fig. 1a. Recurrence-free survival is illustrated by etiology of the incident stroke for the full-time range of 1 year after the incident event (left) and magnified for the first post-stroke month (right). Recurrence risk is highest after large artery atherosclerosis stroke in the early (first week) after the incident event. b. Experimental design: 8 w-old HFD fed ApoE−/− mice underwent sham or stroke surgery. Mice were treated orally with either control or a combination of Rosuvastatin (5 mg/kg) and Aspirin (20 mg/kg) for 7 consecutive days after stroke. c. Kaplan-Meier survival curves of stroke control, statin and aspirin treated, or sham operated mice. Mantel-Cox test; n = 10 (sham), n = 15 (control), n = 12 (statin + aspirin treatment). d. Flow cytometry analysis of whole aorta cell suspensions for total monocyte (CD45+CD11b+) cell counts between control or treated mice after stroke compared to sham-operated mice (ANOVA, n = 8–10 per group). e, f. Quantification of aortic valve plaque load displayed no differences between stroke control and statin + aspirin-treated mice. Data is shown as e. percentage of plaque area per aortic valve level and f. area under the curve (ANOVA, n = 8–10 per group).
Extended Data Fig. 2
Extended Data Fig. 2. Animal model of rupture-prone CCA plaques.
a. Schematic illustration of the tandem stenosis (TS) model for induction of vulnerable atherosclerotic plaques: 8 w-old HFD fed ApoE−/− mice received tandem stenosis (TS) surgery on the right common carotid artery (RCCA). Mice were then fed with high fat diet for an additional 4 w. b. Representative images of CCA MRI TOF sequence 4w after mice received control or TS surgery. White arrows highlight the two ligations on the RCCA. c. Representative pulse-wave mode ultrasound image of the RCCA 4 w after TS, imaged at the location of proximal ligation at 40 MHz (upper panel). Corresponding CCA velocity waveform measured at the location of proximal ligation location 4 w after TS surgery (lower panel). PSV: peak systolic velocity, EDV: end diastolic velocity. d. Representative photograph of the CCA anatomy and corresponding H&E staining for each vessel segment 4 w after TS surgery of both CCAs (-TS represents contralateral (left) CCA without TS ligation; +TS represents ipsilateral (right) CCA with TS ligation, scale bar = 100 µm; H&E staining, scale bar = 50 µm). e. Schematic description of locations for blood flow measurement on the right CCA (ICA: internal carotid artery; ECA: external carotid artery; RCCA: right common carotid artery). Corresponding quantification of mean velocity in the CCA measured at both CCAs before and 4 w after TS surgery (right). f. Representative images of the unstable plaque in the right CCA 4 w after TS surgery (area between two dotted lines indicates intima area, green dotted line indicates necrotic core, scale bar = 50 µm). g. Representative T2 MRI image (left) and immunohistochemistry of a thrombus formation stained for smooth muscle actin (SMA), Fibrinogen and thrombocytes (CD41) in the ACA territory. h. 8-week-old ApoE−/− mice fed a high cholesterol diet (HCD-fed ApoE−/−) underwent tandem stenosis (TS) surgery, and stroke surgery 4w later. The recurrence of secondary ischemia in the contralateral hemisphere was examined by histological analysis 24 h after stroke surgery (n = 10 per group). i. Analysis of the vessel territory of secondary ischemic events in all mice from Fig. 1c. Vessel territories were defined as MCA, ACA or MCA/PCA territory (n = 12 per group). j. HCD-fed ApoE−/− mice did not undergo tandem stenosis (TS) surgery, but stroke surgery 4w later. Left: Representative microphotograph of the RCCA and LCCA without TS. Middle: Western blot analysis of caspase-1 cleavage and MMP2/9 zymography in the CCA without TS. Right: Detection of recurrent ischemic events in mice without TS, but stroke (n = 9 per group). Raw membrane images of immunoblots and zymography images with cropping indication can be found in Supplementary information 1. k. Quantification of cleaved caspase-1 p20 intensity normalized to b-actin in CCA lysates with or without TS surgery (U test, n = 4 per group). l. Quantification of MMP2 and MMP9 (pro- and active form) normalized to TS surgery in CCA lysates from mice with or without TS surgery (n = 4 per group; K test).
Extended Data Fig. 3
Extended Data Fig. 3. Stroke accelerates plaque destabilization and causes plaque rupture.
a. Representative microphotographs of CCA H&E staining. Area between two black dotted lines represents intima. Green dotted lines represent necrotic cores. Necrotic core area was quantified as the percentage of total intima area (ANOVA, n = 8–10 per group). b. Representative images of smooth muscle actin (SMA) immunofluorescence staining. SMA area was quantified as the percentage of total intima area (ANOVA, n = 8–10 per group). c. Representative microphotographs of Picro-Sirius red staining. Collagen area was quantified as the percentage of total intima area (ANOVA, n = 8–10 per group). d. Representative images of Picro-Sirus red stained CCA sections with the according grid for fibrous cap (FC) thickness quantification. FC thickness was quantified at the locations were the FC crossed the applied grid (ANOVA, n = 8–10 per group). e. Representative microphotographs of CD68 immunofluorescence staining. Images were segmented by thresholding to convert fluorescence signal into a binary image. CD68 area was quantified as the percentage of total intima area (ANOVA, n = 8–10 per group). f. Left: Principal component analysis (PCA) using CCA plaque vulnerability readouts from sham, stroke and stroke mice with detected secondary lesion found in a. to e. (n = 8–10 per group) Right: Contribution of the Plaque vulnerability readouts in principal component 1 to 5 (PC1 to PC5), weighted for their relative quality of representation in the PCA. g. Arrows indicate a disrupted fibrous cap in lesion. The pie charts illustrate the proportion of mice with ruptured CCA plaques 1 w after sham or stroke surgery (n = 11 or 25 mice per group)(all scale bars = 50 µm).
Extended Data Fig. 4
Extended Data Fig. 4. MI exacerbates plaque vulnerability and stroke leads to more cellular inflammation.
Representative microphotographs of H&E a., SMA b., Picro-Sirius red c., fibrous cap thickness analysis d. and CD68 e. staining in CCA sections 1 w after sham or myocardial infarction (MI) surgery (scale bar = 50 µm). Area between two dotted lines indicate intima area. Green dotted line represents necrotic core area. Corresponding quantification of necrotic core area, SMA, collagen and CD68 area 1w after sham or MI operated mice (quantification were performed as described in Extended Data Fig. 3, U test, n = 5–6 per group). f. Representative gating strategy for flow cytometry analysis of whole CCA cell suspensions 24 h after sham or stroke surgery. g. Flow cytometry analysis of CCA cell suspensions showing total leukocytes (CD45+), monocytes (CD11b+), proinflammatory subset (Ly6Chigh CCR2+) and macrophages (F4/80+ MHCII+) cell counts after experimental stroke compared to sham (U test, n = 7–8 per group).
Extended Data Fig. 5
Extended Data Fig. 5. Stroke induces inhibitable inflammasome activation in atherosclerotic plaques.
a. Representative immunoblot of different cleavage forms of caspase-1 in CCA lysates with TS 1w after sham or stroke surgery. b. Quantification of cleaved caspase-1 (p20 Casp-1) as ratio to pro caspase-1 (ProCasp-1; U test, n = 8 per group). c. Representative immunofluorescence staining of caspase-1 (Casp-1) in CCA sections 1 w after sham or stroke surgery (scale bar = 50 µm). Images were segmented by thresholding to convert fluorescence signal into a binary image. Area between two white dotted lines represent intima. d. Caspase-1 expression was quantified as the percentage of total intima area (U test, n = 8 per group). e. Representative immunoblot image of the different cleavage forms of caspase-1 (Casp-1) in CCA lysates 1 w after sham, stroke control and stroke + caspase-1 inhibitor (VX 765) administration. f. Quantification of cleaved p20 Casp-1 intensity normalized to β-actin in CCA lysates (+TS) 1 w in the three treatment groups (black: sham; blue: stroke; light blue: stroke + VX765, ANOVA, n = 7 per group). g. Quantification of necrotic core area, SMA, Fibrous cap thickness, collagen and CD68 area 1w after sham or stroke in the respective treatment groups (performed as shown in Extended Data Fig. 3, ANOVA, n = 8–10 per group). Raw membrane images of all immunoblots can be found in Supplementary Fig. 1.
Extended Data Fig. 6
Extended Data Fig. 6. Post-stroke plaque inflammasome activation is mediated by cell-free DNA.
a. Representative EMSA gel microphotograph of different Calixarene concentrations (0–1000 µM) interfering with the AIM2-dsDNA complex resulting in increased free DNA. b. Quantification of AIM2-free DNA based on its relative fluorescence in the EMSA assay (K test; n = 3 per group; 3 independent experiments). c. ELISA analysis of IL-1β in CCA lysates from mice with tandem stenosis (TS), 24 h after stroke in control-, NLRP3 inhibitor- (MCC950) or AIM2 inhibitor- (4-sulfonic calixarene) treated mice, and in sham operated mice (K test; n = 5–6 per group). d. Total cell-free DNA (cfDNA), single-stranded DNA (ssDNA) and double-stranded DNA (dsDNA) in mouse serum 24 h after sham or stroke surgery (U test, n = 7–8 per group). e. Total DNA, ssDNA and dsDNA in mice serum after sham or 12 h, 24 h after myocardial infarction (MI) surgery (black: sham; blue circle: 12 h after MI; blue dot: 24 h after MI, multiple t test, n = 5–10 per group). f. Representative gel electrophoresis photographs of cfDNA isolated from sham and stroke-operated mouse plasma. g. Quantification of electrophoresis-based cfDNA fragment length analysis of sham or stroke-operated mice (K test; n = 4–5 per group; 0–400 bp fragments: Sham vs Stroke: P < 0.0001). h. Quantification of extra-vesicular and intra-vesicular DNA after sham or stroke surgery (U test; EV DNA: Sham vs Stroke P = 0.1746; vesicle-free DNA: Sham vs Stroke P = 0.0079; n = 5 per group).
Extended Data Fig. 7
Extended Data Fig. 7. Early neutrophil activation after stroke drives systemic inflammasome activation.
a. total DNA, ssDNA and dsDNA in mouse serum were measured 24 h after control or i.v. DNA intravenous injection (multiple t test, control, n = 7; DNA challenge, n = 9). b. ELISA analysis for IL-1β in CCA lysates 24 h after i.v. DNA challenge (black, control; blue, DNA challenge, ANOVA, n = 7–9 per group). c. Caspase-1 cleavage was analyzed via western blotting in BMDMs primed (100 ng/ml LPS for 4 h) and stimulated for 2 h with 25% serum of stroke-operated WT mice. WT BMDMs were compared with BMDMs deficient for ASC, AIM2, cGAS, NLRP1 and NLRP3 (K test; n = 4 per group; 2–3 independent experiments). d. Caspase-1 cleavage in WT and AIM2-deficient BMDMs was analyzed by priming (100 ng/ml LPS for 4 h) and stimulating with 250 ng cell-free NET DNA for 2 h (K test; n = 4 per group; 2 independent experiments). e. Quantification of short-fragmented (0-400 bp) cfDNA from sham or stroke-operated mice which received rhDNase I treatment (1000U) immediately after stroke surgery (K test; n = 4–5 per group). f. Exact percentages (mean and range) of total cfDNA per cell population presented in Fig. 3a. g. Representative t-distributed stochastic neighbor embedding (tSNE) plot of antibody-based (α-Ly6G; 1A8) neutrophil depletion efficacy 24 h after antibody administration. h. Quantification of citrullinated Histone3+ (citH3+) neutrophils in control or PAD4 inhibitor treated mice. Data is presented as percentage of respective sham group (U test; n = 5–6 per group).
Extended Data Fig. 8
Extended Data Fig. 8. Stroke increases matrix metalloproteinase activity in atherosclerotic plaques.
a. Representative images of gelatin zymography of CCA lysates for MMP activity in mice 1w after sham or stroke surgery. The region of MMP activity appears as a clear band against dark blue background where the MMP has digested the gelatin substrate on the zymogram gel. b. MMP activity shown in a. was quantified as the gelatin digestion area 1 w after stroke surgery normalized to sham operated mice (multiple t test, n = 4 per group). c., d. Quantification of MMP9 and MMP2 intensity from immunoblot micrograph shown in Fig. 3b (normalized to sham stimulated, U test, n = 4 per group). e. MMP activity shown in Fig. 4c was quantified as the gelatin digestion area in the stroke serum-stimulated medium normalized to sham serum-stimulated group (t test, n = 4 per group). f. Relative expression (RE) of MMP2 expression in WT BMDMs after IL-1β stimulation was quantified as the percentage of the control group (H test, n = 6 per group). g. Relative expression (RE) for MMP9 mRNA in BMDMs after IL-1ß stimulation (H test, n = 6 per group). h. Schematic for NET DNA challenge on WT or AIM2−/− BMDMs and subsequent supernatant transfer to WT BMDMs for MMP expression. i. IL-1β supernatant concentration from WT and AIM2−/− BMDMs stimulated with NET DNA (n = 6 per group). j. Representative Immunoblot image of Supernatant MMP2 analysis from BMDM supernatants (n = 3 per group). Raw images of zymography with cropping indication can be found in Supplementary Fig. 1h.
Extended Data Fig. 9
Extended Data Fig. 9. Stroke initiates the intrinsic coagulation cascade at atherosclerotic plaques.
All analyses were performed on CCA lysates in mice with stenotic CCA plaques after TS surgery in HFD fed ApoE−/−. a. Representative immunoblot of activated Factor XII (F. XIIa) 1 w after stroke or sham surgery. b. Representative immunoblot micrograph of F. XIIa in CCA lysates 24 h after i.v. DNA challenge. c. Representative immunoblot of the F. XIIa in CCA lysates 24 h after stroke in mice treated with control treatment or caspase-1 inhibition (VX765). Corresponding quantification of F. XIIa intensity normalized to β-actin in CCA lysates 1 w after stroke in control- or caspase-1 inhibitor- treated mice (U test, n = 7 per group). d. Representative gelatin zymography of CCA lysates for MMP activity in mice 24 h after sham, stroke or stroke + rhDNase I treatment (left). Representative immunoblot of F. XIIa in +TS CCA lysates 24 h after surgery (right). Raw membrane images of immunoblots with cropping indication can be found in Supplementary Fig. 1j–n.
Extended Data Fig. 10
Extended Data Fig. 10. Blood leukocyte counts do not differ between stroke and asymptomatic patients with high-grade atherosclerosis.
a–c. Flow cytometry analysis of blood from asymptomatic patients or stroke patients showing the percentage of monocytes (CD11b+), T cells (CD3+) and B cells (CD19+) out of total leukocytes (CD45+) (U test, asymptomatic patients, n = 7; symptomatic patients, n = 13). d. Representative immunoblot from asymptomatic and stroke patients for F. XIIa and β-actin (Quantification can be found in Fig. 4i). e. Quantification of MMP9 activity normalized to the activity in asymptomatic patients (Representative image shown in Fig. 4h). Raw membrane images of immunoblots with cropping indication can be found in Supplementary Fig. 1q. f. Overview schematic: Stroke leads to the release of NETosis-derived cell-free DNA activating the AIM2 inflammasome and subsequent secretion of IL-1β. The release of IL-1β drives MMP expression in atherosclerotic plaque, leading to fibrous cap destabilization. The fibrous cap rupture initiates the activation of the intrinsic coagulation cascade resulting in atherothrombosis and subsequent arterio-arterial embolism with secondary brain infarctions.

Comment in

References

    1. Mohan, K. M. et al. Risk and cumulative risk of stroke recurrence: a systematic review and meta-analysis. Stroke42, 1489–1494 (2011). 10.1161/STROKEAHA.110.602615 - DOI - PubMed
    1. Touze, E. et al. Risk of myocardial infarction and vascular death after transient ischemic attack and ischemic stroke: a systematic review and meta-analysis. Stroke36, 2748–2755 (2005). 10.1161/01.STR.0000190118.02275.33 - DOI - PubMed
    1. World Health Organization. The top 10 causes of death. WHOhttps://www.who.int/news-room/fact-sheets/detail/the-top-10-causes-of-death (2020).
    1. Katan, M. & Luft, A. Global burden of stroke. Semin. Neurol.38, 208–211 (2018). 10.1055/s-0038-1649503 - DOI - PubMed
    1. Boulanger, M., Bejot, Y., Rothwell, P. M. & Touze, E. Long-term risk of myocardial infarction compared to recurrent stroke after transient ischemic attack and ischemic stroke: systematic review and meta-analysis. J. Am. Heart Assoc.7, e007267 (2018). 10.1161/JAHA.117.007267 - DOI - PMC - PubMed

MeSH terms

LinkOut - more resources