. 2024 Sep;633(8028):137-146.
doi: 10.1038/s41586-024-07769-3. Epub 2024 Aug 7.

Prognostic genome and transcriptome signatures in colorectal cancers

Affiliations

Prognostic genome and transcriptome signatures in colorectal cancers

Luís Nunes et al. Nature. 2024 Sep.

Abstract

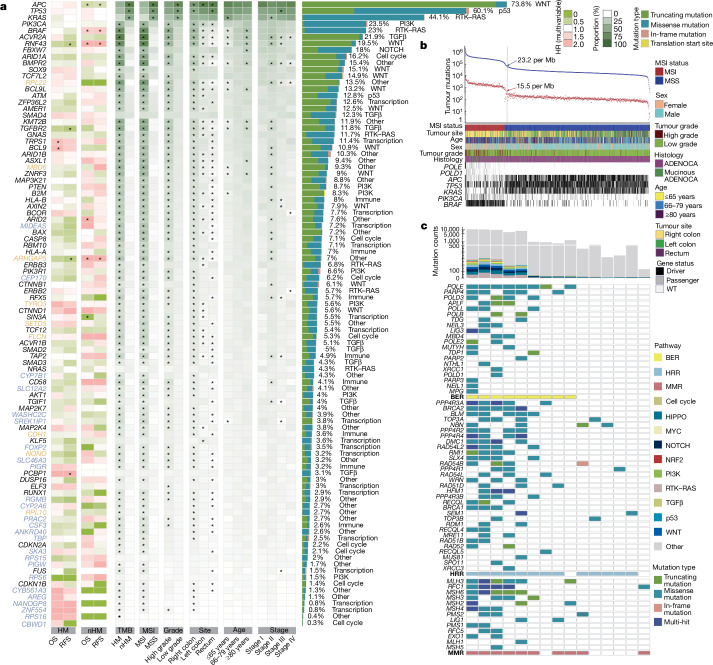
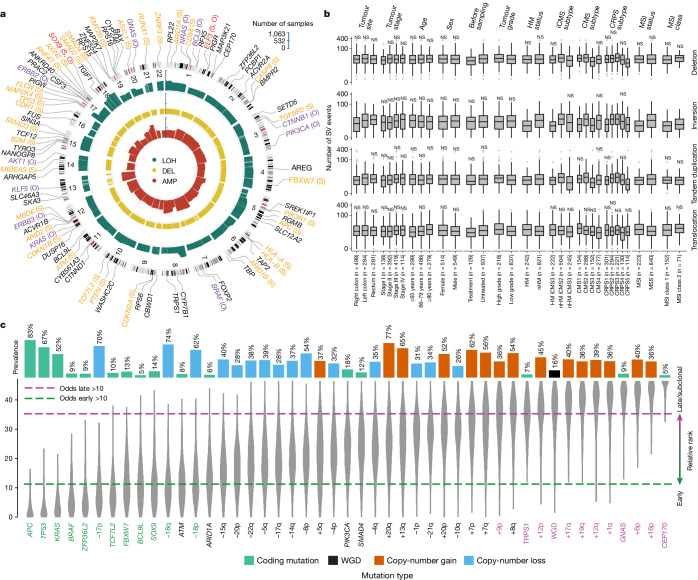
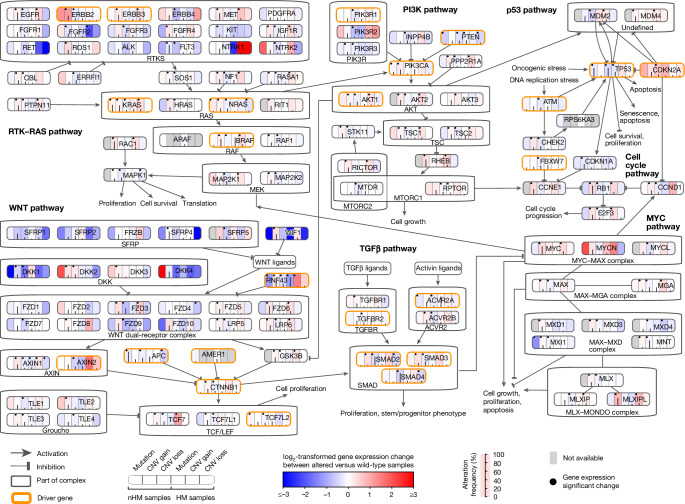
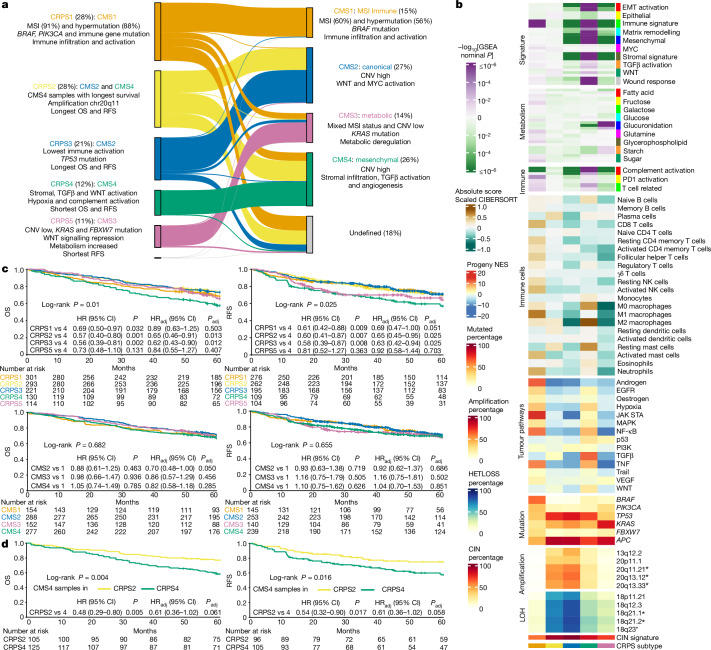
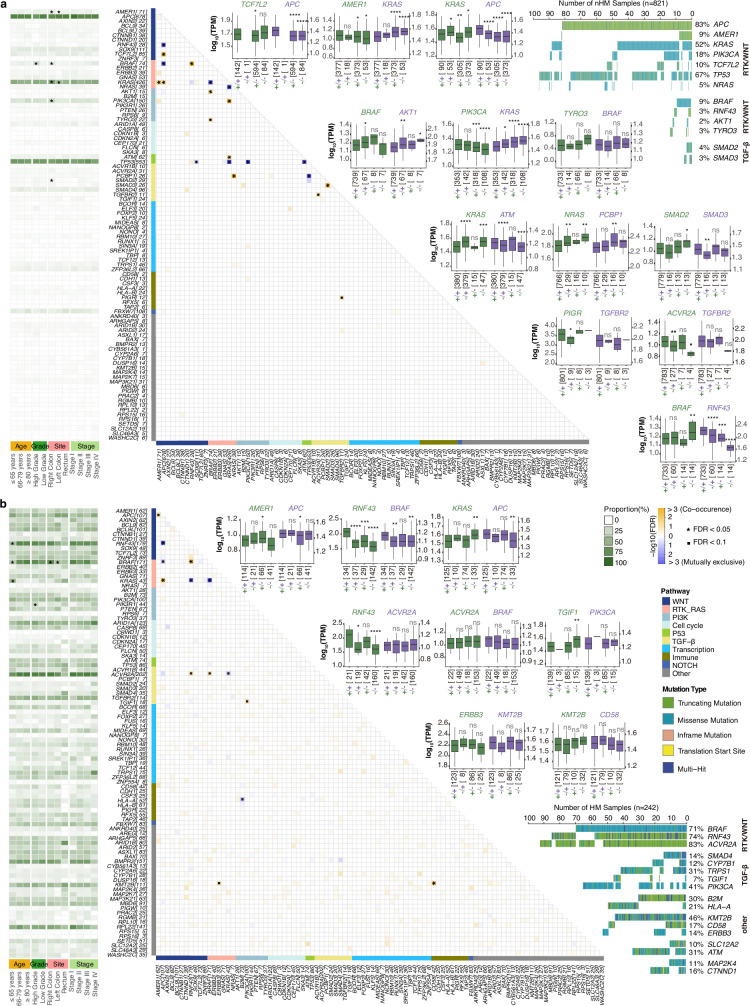
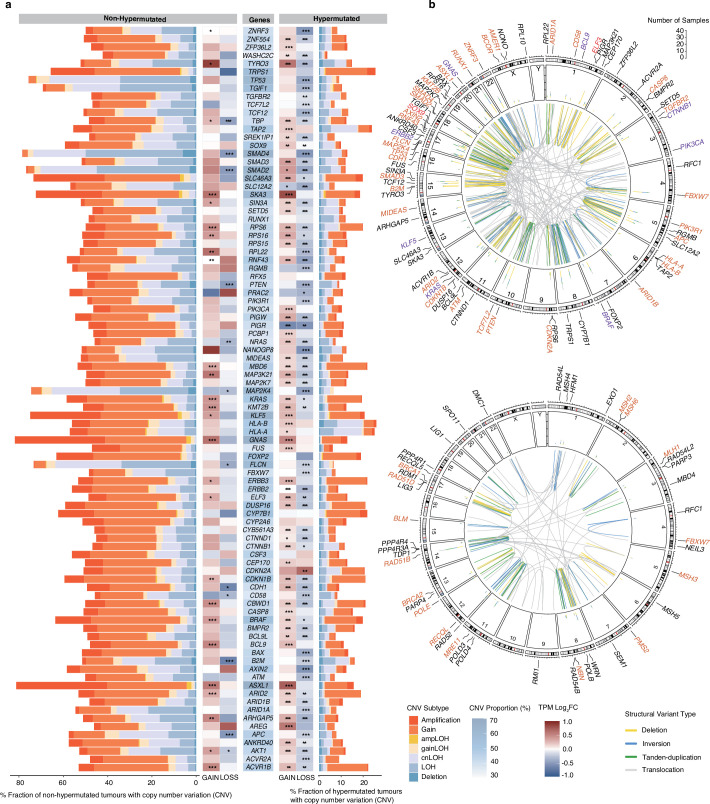
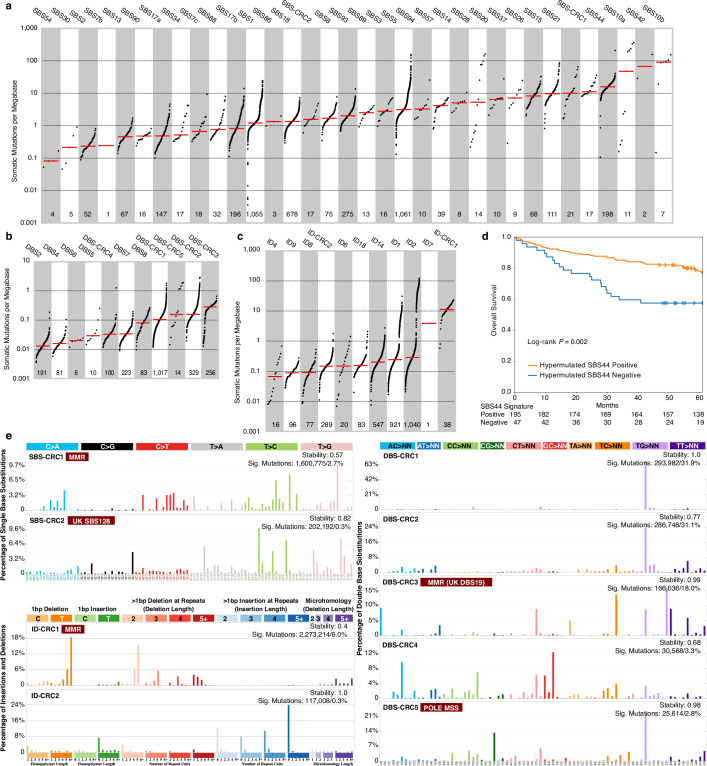
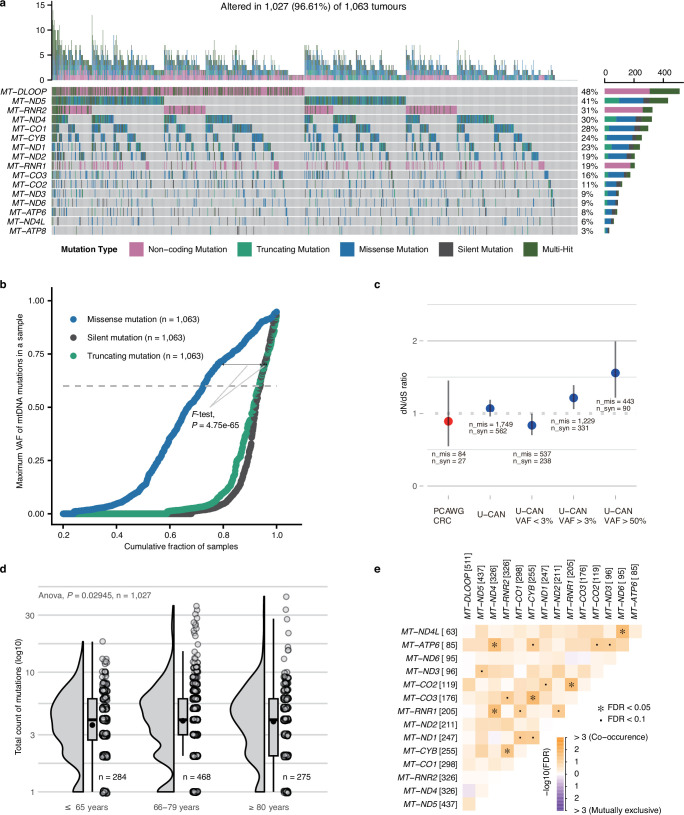
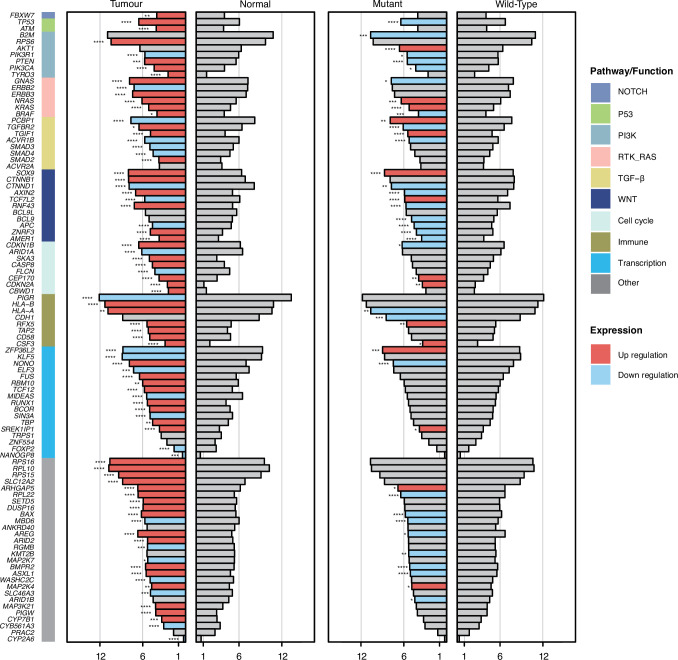
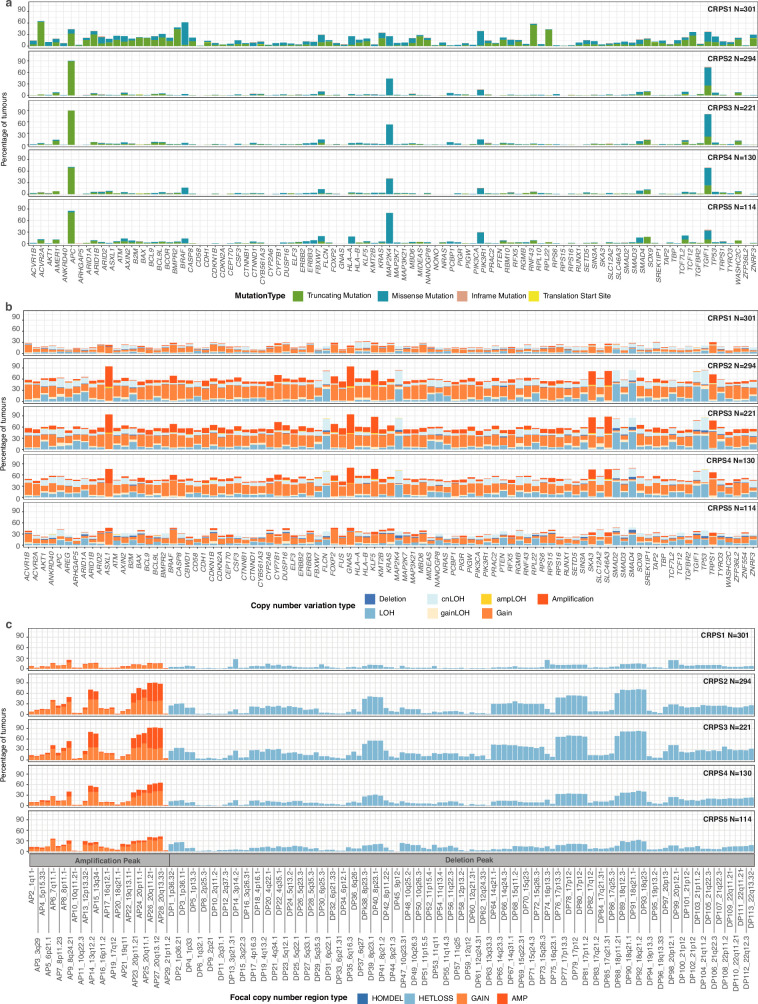
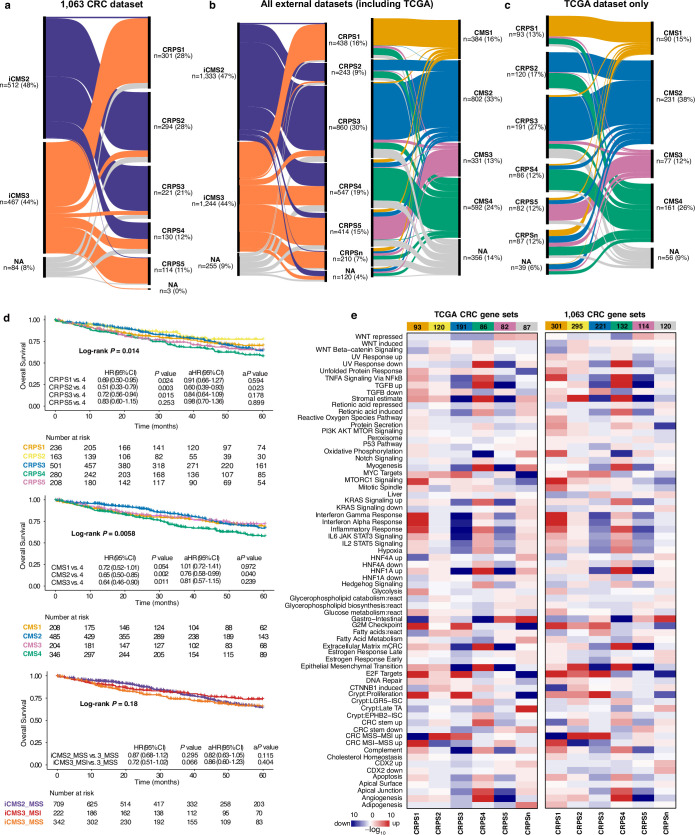
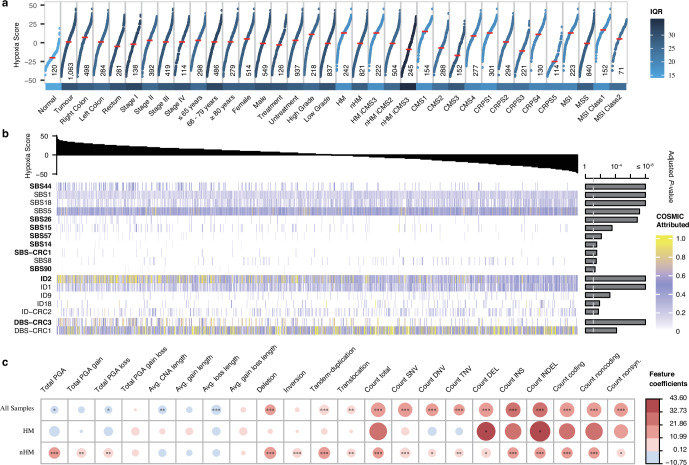
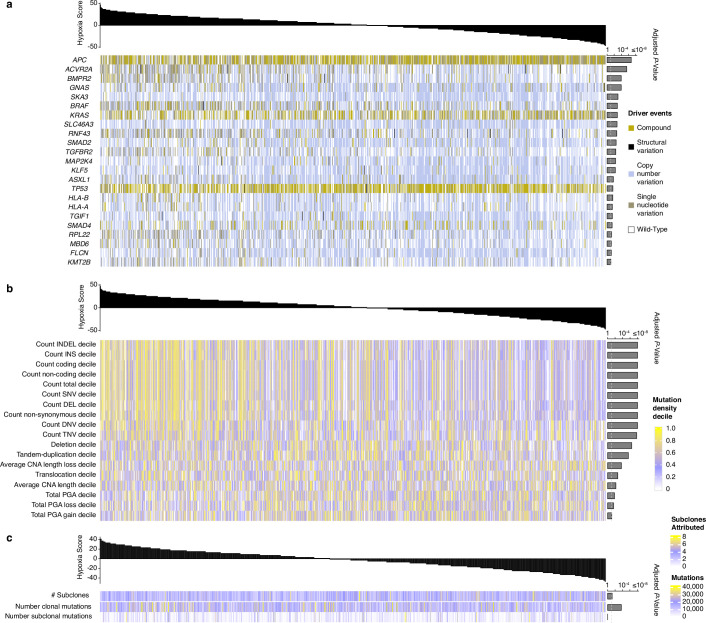
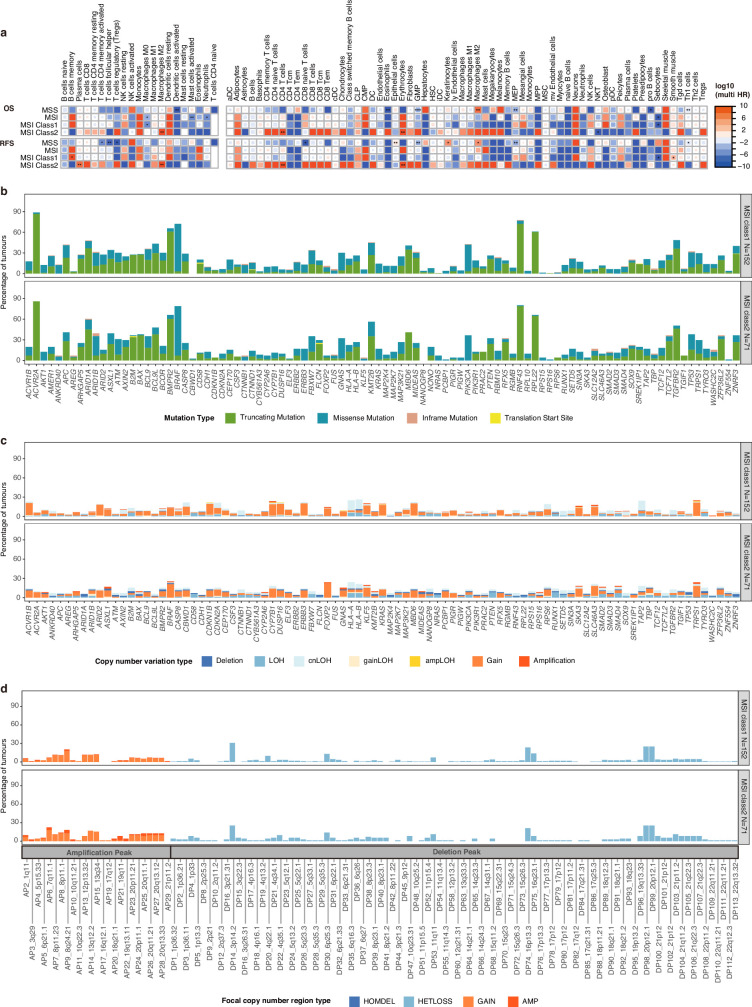
Colorectal cancer is caused by a sequence of somatic genomic alterations affecting driver genes in core cancer pathways1. Here, to understand the functional and prognostic impact of cancer-causing somatic mutations, we analysed the whole genomes and transcriptomes of 1,063 primary colorectal cancers in a population-based cohort with long-term follow-up. From the 96 mutated driver genes, 9 were not previously implicated in colorectal cancer and 24 had not been linked to any cancer. Two distinct patterns of pathway co-mutations were observed, timing analyses identified nine early and three late driver gene mutations, and several signatures of colorectal-cancer-specific mutational processes were identified. Mutations in WNT, EGFR and TGFβ pathway genes, the mitochondrial CYB gene and 3 regulatory elements along with 21 copy-number variations and the COSMIC SBS44 signature correlated with survival. Gene expression classification yielded five prognostic subtypes with distinct molecular features, in part explained by underlying genomic alterations. Microsatellite-instable tumours divided into two classes with different levels of hypoxia and infiltration of immune and stromal cells. To our knowledge, this study constitutes the largest integrated genome and transcriptome analysis of colorectal cancer, and interlinks mutations, gene expression and patient outcomes. The identification of prognostic mutations and expression subtypes can guide future efforts to individualize colorectal cancer therapy.


Conflict of interest statement

Authors declare no competing interests.

Figures

Fig. 1
Fig. 1. Somatic mutation analysis of 1,063 CRC genomes identifies 96 driver genes.
Somatic mutations were called (Methods) and significantly mutated genes were identified using dNdScv. a, The 96 genes mutated at a significant level in this cohort. The association of driver genes with survival (HR) is shown for HM and nHM tumours (multivariable Cox regression). The association of driver genes with clinical and genomic features is shown by the proportion of tumours affected (Fisher’s exact test). *FDR-adjusted P < 0.05. The mutation type and prevalence is indicated on the right, including a description of the affected pathway. Colour keys for HR for OS and RFS, and for genomic feature proportions are shown on the far right. Genes that were not previously designated as drivers in CRC (orange) or in any cancer type (blue) are indicated. b, The prevalence of total (blue) and non-synonymous (red) mutations in each tumour. Cut-offs for HM and nHM are indicated (grey line). The clinical features and mutation status for selected genes are shown at the bottom. Mutations that are considered to be drivers are either probably oncogenic mutations annotated by OncoKB or hotspots catalogued by Cancer Hotspots. c, DNA damage response (DDR) gene mutations in the 15 out of 21 HM tumour cases that were MSS. Not all DNA damage response genes included here can be interpreted as the direct cause of the high TMB in these MSS samples. Top, the total non-synonymous mutation counts for each sample are coloured by the affected oncogenic pathways. ADENOCA, adenocarcinoma; BER, base excision repair; HRR, homologous recombination repair; MMR, mismatch repair.
Fig. 2
Fig. 2. Structural variation and relative timing of somatic events in CRC.
a, Gene CNVs in driver genes displayed by type: LOH (green), deletion (yellow) and amplification (red). The bar height is proportional to the fraction of tumours with respective alteration. The 91 autosomal driver genes are indicated as oncogenes (O; purple), tumour suppressor genes (S; orange), both (S, O; red) or genes with an unknown role (black), and are displayed by genomic location. b, The SV landscape for deletions, inversions, tandem duplications and translocations displayed by clinical, genomic and transcriptomic features. The boxes represent the interquartile ranges (IQRs) between the first and third quartiles, the centre line represents the median, and the whiskers extend to 1.5× the IQR from the top and bottom of the box. Statistical analysis was performed using two-sided Wilcoxon rank-sum tests; *FDR-adjusted P < 0.05, **FDR-adjusted P < 0.01, ***FDR-adjusted P < 0.001, ****FDR-adjusted P < 0.0001. c, The prevalence and relative timing of driver gene mutations and SVs in 801 nHM CRC tumours by PhylogicNDT. Early/clonal (green), intermediate (black) and late/subclonal (purple) alterations are indicated. WGD, whole-genome duplication.
Fig. 3
Fig. 3. Integrative analysis of somatic alterations and gene expression levels in CRC signalling pathways.
The frequencies of somatic alterations, including mutations and copy-number (CNV) loss and gain for each gene in nHM and HM tumours. Red (log2[fold change (FC)] > 0) and blue (log2[FC] < 0) colour intensities represent the log-transformed FC between mutated and wild-type tumours by type of somatic alteration (mutation, CNV gain and CNV loss for nHM and HM samples). Somatic alteration frequencies are indicated by the black line in each column. Black dots show gene expression changes with FDR-adjusted P < 0.05 (two-sided Wilcoxon rank-sum test). Driver genes are marked by orange borders.
Fig. 4
Fig. 4. Refined prognostic subtypes derived from 1,063 CRC transcriptomes.
The characteristics of the five distinct CRPSs obtained from unsupervised classification of tumour transcriptome data. a, Comparison of CRPS to the CMSs for the same dataset. The proportion of samples assigned to each subtype is shown as the percentage of the total number of tumours. The main molecular and clinical characteristics for each CRPS and CMS subgroup are indicated. b, Transcriptomic characteristics of 1,063 samples according to their CRPS classification. Prognostic focal CNV cytobands that are differentially altered in CRPS are indicated by asterisks (P < 0.05, multivariable Cox regression in nHM tumours). c, Kaplan–Meier survival curves (log-rank test) for overall (stages I–IV) and recurrence-free (stages I–III) survival in CRPS (top) and CMS (bottom) groups. d, Kaplan–Meier survival curves (log-rank test) for CMS4 samples allocated to CRPS2 and CMS4 samples allocated to the CRPS4 group. Adjusted HR (HRadj) and P values (Padj) or HR and P values were calculated using multivariable Cox regression with or without adjustment for tumour stage. CIN, chromosomal instability.
Extended Data Fig. 1
Extended Data Fig. 1. Mutually exclusive and co-occurring gene mutations in the 96 colorectal cancer driver genes displayed by hypermutation status.
Significant pairs of genes with mutually exclusive or co-occurring mutations were detected in a, non-hypermutated (n = 821) and b, hypermutated (n = 242) tumours with Fisher’s Exact test adjusted by Benjamini-Hochberg False Discovery Rate (* FDR < 0.05 and ▪ FDR < 0.1). The number of patients with the mutation is shown inside brackets next to the gene name. Association of genes with clinical features with indication of the proportion of tumours affected is shown to the left (* FDR P < 0.05). Oncoplots display mutually exclusive and co-occurring driver gene mutations grouped by pathway with gene mutation prevalence shown to the right. The expression levels (log10(TPM)) of each pair of genes with co-occurring mutations were compared between wild-type samples (control group, +/+), samples carrying mutations of one gene (+/− or −/+) and samples carrying mutations of both genes (−/−) in the pair. Names of paired genes are indicated on the top of boxes and their colours correspond to colours of “+” or “−”. The number of samples for each group is shown at the bottom of each box. The boxes represent the interquartile ranges (IQRs) between the first and third quartiles, the centre line represents the median, and the whiskers extend 1.5 times the IQR from the top and bottom of the box (* P < 0.05, ** P < 0.01, *** P < 0.001, **** P < 0.0001, Two-sided Wilcoxon Rank Sum Test).
Extended Data Fig. 2
Extended Data Fig. 2. Copy number and structural variation landscape for the 96 driver genes.
a, Copy number variation subtypes were called by facetsSuite. RNA expression level (TPM Log2FC) in samples with gains or losses of the driver gene were compared with that of wild-type samples (*FDR < 0.05, ** FDR < 0.01, *** FDR < 0.001, Two-sided Wilcoxon Rank Sum Test). b, Structural variants affecting driver genes (top) and DNA damage repair genes (bottom). Circos plots with counts (middle ring) for deletions (yellow), inversions (blue), tandem-duplications (green) and translocations (grey), displayed by gene and chromosomal location. CNV, copy number variation; LOH, loss of heterozygosity; cnLOH, copy number neutral LOH; ampLOH, amplification LOH.
Extended Data Fig. 3
Extended Data Fig. 3. Identification of novel and prognostic somatic mutational signatures.
De novo signature extraction and Cosmic signature decomposition by SigProfilerExtraction. Signatures of (a) single-base substitution, (b) doublet-base substitution, (c) and small insertion and deletion sorted by median (red line) mutational burden per megabase with each dot representing one tumour and the number of tumours with each signature indicated below. d, Overall survival of patients with stage I-IV hypermutated tumours (n = 242) having the DNA mismatch repair SBS44 signature with Kaplan-Meier curves and log-rank test. e, SigProfilerExtraction profiles for the novel and SBS-CRC2, doublet-base substitution DBS-CRC1, DBS-CRC2, DBS-CRC3, DBS-CRC4 and DBS-CRC5 and small insertion and deletion ID-CRC1 and ID-CRC2 signatures. SBS, single-base substitution; DBS, doublet-base substitution; ID, small insertions and deletions; MMR, mismatch repair; MSS, microsatellite stable.
Extended Data Fig. 4
Extended Data Fig. 4. Somatic mutational landscape of mitochondrial genomes in colorectal cancer.
a, Oncoplot of somatic mitochondrial DNA gene (rows) mutations in 1,027 (97%) of the 1,063 sequenced tumours (columns). The TMB for each sample is presented at the top and the number of tumours with the mutation is shown on the right, coloured by mutation type. b, Variant allele frequency (VAF) accumulation curves for missense, silent and truncating mitochondria mutations (one-tailed F-test). c, dN/dS ratio for mtDNA somatic missense mutations by different VAF cut-offs. The numbers of missense and silent mutations for different VAF cut-offs were indicated. The error bars represent the 95% confidence intervals of the dN/dS ratio (likelihood). d, Total amount of mitochondrial mutations displayed per age group with one-way ANOVA comparison. The boxes represent the interquartile ranges (IQRs) between the first and third quartiles, the centre line represents the median, and the whiskers extend 1.5 times the IQR from the top and bottom of the box. The numbers of tumours in each age group are shown at the bottom of the box plots and mean values are shown as black dots. e, Mutually exclusive or co-occurring mitochondrial gene mutations in all tumours with Fisher’s Exact test adjusted by Benjamini-Hochberg False Discovery Rate (* FDR < 0.05 and ▪ FDR < 0.1). The number of patients with the mutation is shown inside brackets next to the gene name.
Extended Data Fig. 5
Extended Data Fig. 5. Gene expression profiles of the 96 driver genes.
Mean expression of driver genes in normal colorectal tissues (n = 120) versus tumours (n = 1,063) (left panel) and in wild-type (WT) versus mutant tumours (right panel). Genes were sorted by pathways/functions. Significance for differential gene expression was tested with Two-sided Wilcoxon Rank Sum Test FDR (* FDR < 0.05, ** FDR < 0.01, *** FDR < 0.001, **** FDR < 0.0001). Bars represented as log2(mean TPM + 1).
Extended Data Fig. 6
Extended Data Fig. 6. Somatic mutations and copy number variation in colorectal cancer prognostic subtypes (CRPS).
a, Somatic mutations in 96 driver genes for the 1,063 colorectal tumours displayed by CRPS subtype. b, Frequency and type of somatic copy number variation in 96 driver genes displayed by CRPS subtype. c, Focal copy number regions displayed by CRPS subtype determined by GISTIC if Q < 0.1. LOH, loss of heterozygosity; cn, copy number neutral; AMP, amplification; HOMDEL, homozygous deletion; HETLOSS, heterozygous deletion.
Extended Data Fig. 7
Extended Data Fig. 7. Validation of CRPS for colorectal tumour classification.
a, Comparison of CRPS to iCMS in this cohort. b-c, In total, eleven external CRC datasets (n = 2,832 samples) from NCBI GEO and NCI Genomic Data Commons were uniformly processed and transformed to pathway profiles with ssGSEA. Comparison of CRPS, CMS and iCMS classification for all external datasets (b) and the TCGA COAD/READ dataset only (c). The samples were coloured after their CMS subtype. d, Overall survival shown by CRPS, CMS and iCMS subgroups for external datasets, calculated with Kaplan-Meier curves and log-rank test. Adjusted HR (aHR) and P (aP) values or HR and P values were calculated by multivariable Cox with or without adjustment for tumour stage. e, Comparison of CMS Gene-Set activities using CMScaller (version: v0.9.2) for the TCGA dataset (left) and this cohort (right) displayed by CRPS subgroup (columns). Upregulation marked in red and downregulation in blue for each activity by row. NA, undefined subtype.
Extended Data Fig. 8
Extended Data Fig. 8. Hypoxia in colorectal cancer is associated with mismatch repair deficiency and genomic structural variation.
a, Hypoxia scores based on the Buffa mRNA abundance signature for 1,063 tumour and 120 normal CRC tissues, displayed by clinical, genomic and transcriptomic features. For each group, the median hypoxia score is marked (horizontal red line) and variability is coloured according to the interquartile range (IQR). b, Association of hypoxia score (top) with mutational signatures (bottom) coloured by normalized COSMIC signature activity attributed to each sample. Adjusted FDR P-values shown to the right and significance threshold indicated by dotted line (F-test full and null models’ comparison, FDR < 0.05). Signatures that showed positive correlation with the hypoxia score are shown in bold, the remainder showed negative correlation with the score. c, Association of hypoxia scores with somatic structural variants, displayed by hypermutation status. Size and colour of the dots represent regression coefficients of the full model * FDR < 0.05, ** FDR < 0.01, *** FDR < 0.001 (F-test full and null models’ comparison). IQR, interquartile range; PGA, percentage of genome with copy number alterations; CNA, copy number alterations; SNV, single nucleotide variation; DNV, double nucleotide variation; TNV, triple nucleotide variation; DEL, deletion; INS, insertion; INDEL, insertion and deletion.
Extended Data Fig. 9
Extended Data Fig. 9. Hypoxia correlation with mutations, structural variants and mutational clonality.
Hypoxia scores based on the Buffa mRNA abundance signature were calculated for all tumours (top) and correlated with (a) mutations in the 96 driver genes, (b) mutation burden and somatic structural variants, and (c) numbers of mutations attributed as clonal and subclonal. Adjusted FDR P-values shown to the right and significance threshold indicated by dotted line (F-test full and null models’ comparison, FDR < 0.05). PGA, percentage of genome with copy number alterations; CNA, copy number alterations; SNV, single nucleotide variation; DNV, double nucleotide variation; TNV, triple nucleotide variation; DEL, deletion; INS, insertion; INDEL, insertion and deletion.
Extended Data Fig. 10
Extended Data Fig. 10. Survival, somatic mutations and copy number variation in two classes of MSI tumours.
a, Overall and recurrence free survival displayed by mismatch repair status and MSI class for cells predicted by CIBERSORT (left) and xCell (right) algorithms. Univariable Cox regression was performed on cell types that showed expression in at least 5 patients with survival data, and statistically significant differences (* P < 0.05, ** P < 0.01, and *** P < 0.001) were further tested by multivariable Cox regression with co-variates including tumour site, treatment status, tumour stage, age groups, and tumour grade. The hazard ratio values are indicated by colour intensity. b, Percentage of tumours with somatic mutations in 96 driver genes for MSI class 1 (top) and class 2 (bottom) cases. c, Percentage of tumours with somatic copy number variation of 96 driver genes for MSI class 1 (top) and class 2 (bottom) cases. d, Percentage of tumours with focal copy number regions (Q < 0.1) gained or lost, determined by GISTIC in the MSI class 1 (top) and class 2 (bottom) cases. LOH, loss of heterozygosity; cn, copy number neutral; AMP, amplification; HOMDEL, homozygous deletion; HETLOSS, heterozygous deletion.

References

    1. Vogelstein, B. et al. Cancer genome landscapes. Science339, 1546–1558 (2013). 10.1126/science.1235122 - DOI - PMC - PubMed
    1. Sung, H. et al. Global cancer statistics 2020: GLOBOCAN estimates of incidence and mortality worldwide for 36 cancers in 185 countries. CA Cancer J. Clin.71, 209–249 (2021). 10.3322/caac.21660 - DOI - PubMed
    1. Sjöblom, T. et al. The consensus coding sequences of human breast and colorectal cancers. Science314, 268–274 (2006). 10.1126/science.1133427 - DOI - PubMed
    1. Cancer Genome Atlas Network. Comprehensive molecular characterization of human colon and rectal cancer. Nature487, 330–337 (2012). 10.1038/nature11252 - DOI - PMC - PubMed
    1. Zhao, Q. et al. Comprehensive profiling of 1015 patients’ exomes reveals genomic-clinical associations in colorectal cancer. Nat. Commun.13, 2342 (2022). 10.1038/s41467-022-30062-8 - DOI - PMC - PubMed

MeSH terms

Substances