Comparative Study
. 2024 Sep;26(5):499-518.
doi: 10.1007/s40272-024-00647-5. Epub 2024 Aug 7.

Comparison of Different Doses of Oral and Ocular Propranolol for Retinopathy of Prematurity: A Network Meta-Analysis

Affiliations
Comparative Study

Comparison of Different Doses of Oral and Ocular Propranolol for Retinopathy of Prematurity: A Network Meta-Analysis

Amparo Ortiz-Seller et al. Paediatr Drugs. 2024 Sep.

Abstract

Objective: The efficacy and safety of propranolol for retinopathy of prematurity (ROP) remain under debate. This network meta-analysis (NMA) focuses on whether a ranking may be established for different dose levels of propranolol as treatment of ROP in terms of stage progression as the primary outcome, with appearance of plus disease and need for anti-vascular endothelial growth factors (anti-VEGFs) or laser therapy as secondary endpoints.

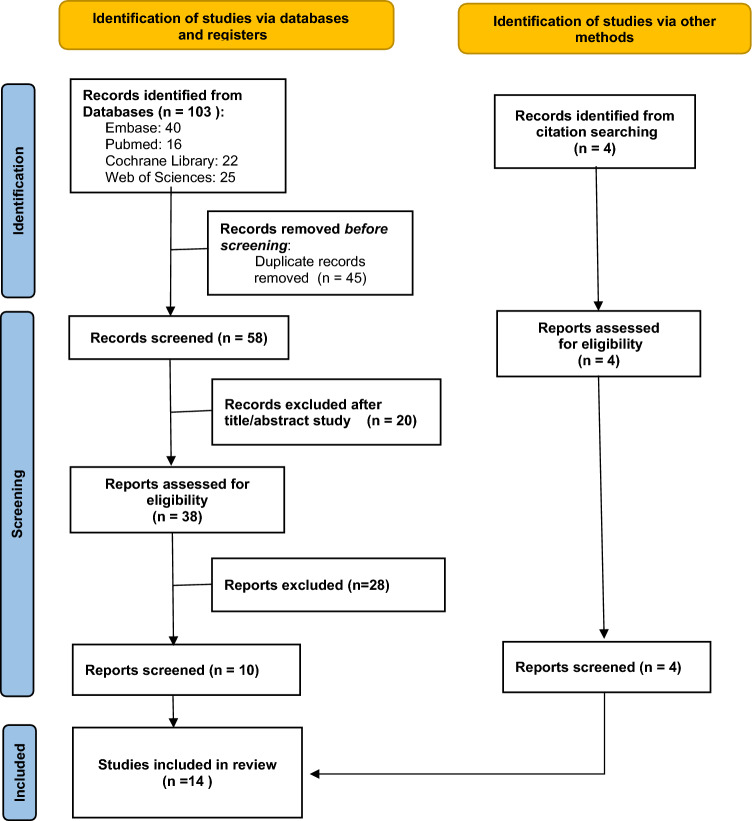
Methods: Fourteen studies (10 randomised controlled trials, three single-arm trials and one retrospective observational study) of 474 patients treated with oral or ocular propranolol were retrieved from databases up to April 2024. Meta-insight and model-based NMA were undertaken to evaluate the propranolol dose-response relationship. Studies were evaluated for model fit, risk of bias and Confidence of evidence In Network Meta-Analysis (CINeMA). Effect sizes were determined as odds ratio (OR) with 95% credible interval (CrI).

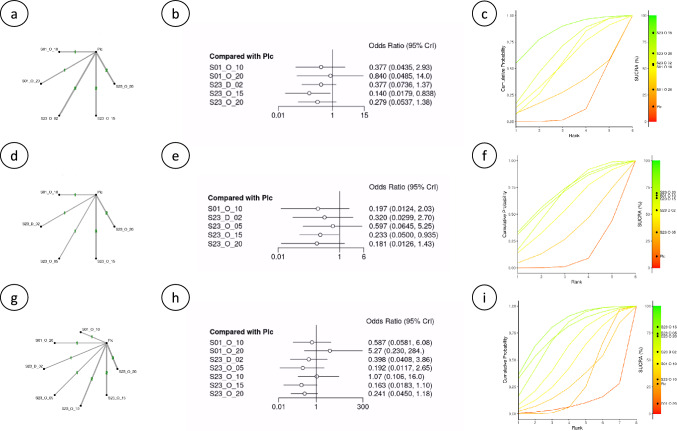
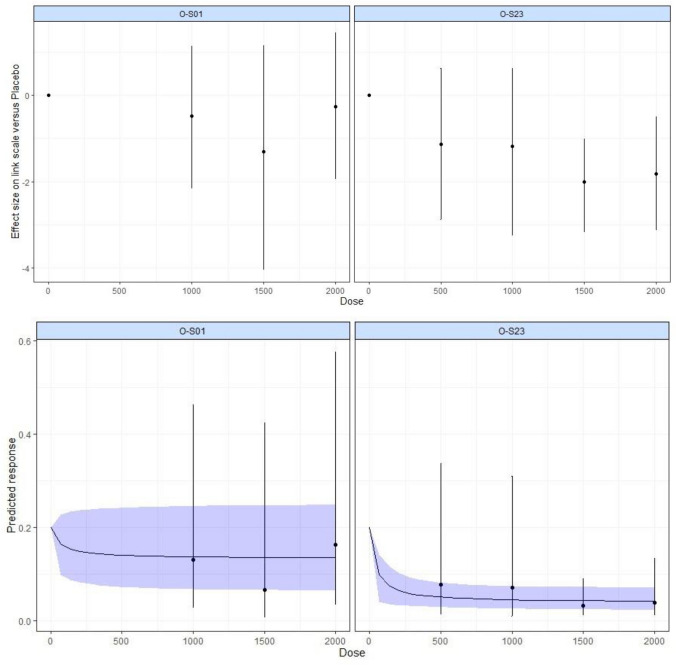
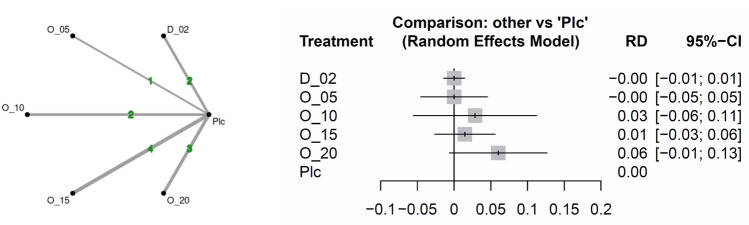
Results: Bayesian analysis showed a trend towards improved effects for propranolol given at late stages (stages 2-3; S23) of ROP progression compared with its administration at earlier stages (stages 0-1; S01). OR values for oral propranolol 1.5 and 2 mg/kg/day given at S23 were 0.13 (95% CrI 0.04-0.37) and 0.16 (95% CrI 0.04-0.61), respectively, while given at S01 were 0.28 (95% CrI 0.02-2.96) and 0.78 (95% CrI 0.14-4.43), respectively. Similarly, OR of eye propranolol 0.2% at S23 was 0.37 (95% CrI 0.09-1.00) versus an S01 OR of 0.64 (95% CrI 0.21-2.04). Surface under the cumulative ranking curve (SUCRA) analyses confirmed best probability values for oral propranolol 1.5-2 mg/kg followed by eye propranolol 0.2%, all at S23. Model-based NMA showed nonlinearity in the dose-response for oral propranolol with a trend to greater maximal effect for its administration at late versus early stages. For secondary endpoints, lower risk values were found with oral propranolol 1.5 mg/kg/day at S23 for progression to plus disease (OR 0.14; 95% CrI 0.02-0.84) and need for anti-VEGFs (OR 0.23; 95% CrI 0.05-0.93) and laser (OR 0.16; 95% CrI 0.02-1.10) therapies also followed by eye propranolol 0.2%, and a similar profile was obtained with SUCRA analysis. Lower doses (0.5-1.0 mg/kg/day) of oral propranolol retained efficacy. Threat of adverse events was estimated as risk difference versus control with no difference for eye propranolol 0.2% and oral propranolol 0.5 mg/kg/day, modest increases of risk for oral propranolol 1.0 and 1.5 mg/kg/day and the highest risk difference for oral propranolol 2.0 mg/kg/day (0.06; 95% CI -0.01 to 0.13).

Conclusion: A diminished risk of disease progression and need for additional treatment was obtained with propranolol in ROP, but safety is a potential concern. Propranolol eye micro-drops (0.2%) can be as efficacious as oral propranolol. Nonetheless, the evidence is limited due to the paucity and quality of the available studies.


Conflict of interest statement

The authors (AO, PM, PR, EM, JLO) declare no financial or non-financial interests that are directly or indirectly related to this work.

Figures

Fig. 1
Fig. 1
PRISMA flow chart of literature search and selection with numbers for included and excluded studies
Fig. 2
Fig. 2
Effects of propranolol on the stage progression of retinopathy of prematurity (ROP) as the primary outcome. The upper panels (ad) correspond to effects of propranolol analysed without separation by stages of disease progression, and the lower panels (eh) indicate results for separate analyses of propranolol given at earlier (stages 0 to 1) vs later stages (stages 2 and 3) of ROP. Panels a and e: Network plot. Number on the lines indicate the number of studies conducted for each comparison. Panels b and f: Forest plot depicting the effect estimates (odds ratio) for stage progression with the corresponding 95% credible intervals (95% CrI) for each treatment compared with placebo/control (Plc). Panels c and g: The Litmus Rank-O-Gram presents a cumulative rank-o-gram alongside a litmus strip of the Surface Under the Cumulative RAnking curve (SUCRA) values. Highest values and cumulative curves correspond to a better position in the ranking and are situated nearer the top. Panels d and h: Radial SUCRA plots. Size of the nodes represent number of patients and thickness of lines indicate number of studies conducted. Abbreviations for propranolol treatments: D_02: 0.2% eye micro-drops; O_05: oral 0.5 mg/kg/day; O_10: oral 1.0 mg/kg/day; O_15: oral 1.5 mg/kg/day; O_20: oral 2.0 mg/kg/day; S01_D_02: eye drops 0.2% given at stages 0–1; S01_O_10: oral 1.0 mg/kg/day given at stages 0–1; S01_O_15: oral 1.5 mg/kg/day given at stages 0–1; S01_O_20: oral 2.0 mg/kg/day given at stages 0–1; S23_D_02: eye drops 0.2% given at stages 2–3; S23_O_05: oral 0.5 mg/kg/day given at stages 2–3; S23_O_10: oral 1.0 mg/kg/day given at stages 2–3; S23_O_15: oral 1.5 mg/kg/day given at stages 2–3; S23_O_20: oral 2.0 mg/kg/day given at stages 2–3
Fig. 3
Fig. 3
Effects of propranolol on the secondary outcomes. Upper (ac), middle (df) and lower (gi) panels correspond to analysis of plus disease appearance, need for treatment with an anti-VEGF agent, and requirement for laser therapy, respectively. Panels on the left side show the corresponding network plots; middle panels show forest plots with odds ratio and 95% credible intervals (CrI) compared with placebo/control (Plc); and panels on the right side show the Litmus Rank-O-Gram with a litmus strip of the Surface Under the Cumulative RAnking curve (SUCRA) values. Values nearer the top represent a better ranking position. Abbreviations for propranolol treatments: D_02: 0.2% eye micro-drops; O_05: oral 0.5 mg/kg/day; O_10: oral 1.0 mg/kg/day; O_15: oral 1.5 mg/kg/day; O_20: oral 2.0 mg/kg/day; S01_D_02: eye drops 0.2% given at stages 0–1; S01_O_10: oral 1.0 mg/kg/day given at stages 0–1; S01_O_15: oral 1.5 mg/kg/day given at stages 0–1; S01_O_20: oral 2.0 mg/kg/day given at stages 0–1; S23_D_02: eye drops 0.2% given at stages 2–3; S23_O_05: oral 0.5 mg/kg/day given at stages 2–3; S23_O_10: oral 1.0 mg/kg/day given at stages 2–3; S23_O_15: oral 1.5 mg/kg/day given at stages 2–3; S23_O_20: oral 2.0 mg/kg/day given at stages 2–3
Fig. 4
Fig. 4
Dose–response relationship for oral propranolol on the primary outcome (stage progression of retinopathy of prematurity [ROP]) plotted with the model-based, network meta-analysis (MBNMA) software programme. The upper panels represent the observed effects for the different doses of propranolol in reducing the rate of stage progression. The x-axis represents the dose (μg/kg/day) and the y-axis shows the effect size of the observed responses (odds ratio [OR] with 95% credible interval [CrI] as natural logarithm). Lower panels represent the dose–response prediction plots. The solid lines represent the mean predictions as a function of dose of oral propranolol. Shaded areas represent the 95% CrI. The embed points represent the mean observed values with their variation. Oral propranolol was administered at early (stages 0 and 1) and late (stages 2 and 3) stages of progression of ROP as indicated by the respective legends O-S01 and O-S23 at the upper part of each of the panels
Fig. 5
Fig. 5
Risk differences for adverse events after propranolol. Left panel: Network plot of included studies. Right panel: Frequentist forest plot showing pairwise risk differences versus placebo/control (Plc) for total counts of adverse events. Effect estimates are shown with their 95% confidence intervals (95% CI)

References

    1. Hellström A, Smith LE, Dammann O. Retinopathy of prematurity. Lancet. 2013;382(9902):1445–57. 10.1016/S0140-6736(13)60178-6. 10.1016/S0140-6736(13)60178-6 - DOI - PMC - PubMed
    1. Chen J, Zhu Y, Li L, Lv J, Li Z, Chen X, Chen X, Huang S, Xie R, Zhang Y, Ye G, Luo R, Shen X, Fu M, Zhuo Y. Visual impairment burden in retinopathy of prematurity: trends, inequalities, and improvement gaps. Eur J Pediatr. 2024. 10.1007/s00431-024-05450-5. 10.1007/s00431-024-05450-5 - DOI - PubMed
    1. Scarboro SD, Harper CA 3rd, Karsaliya G, Ghoraba H, Moshfeghi DM, Al-Khersan H, Robles-Holmes HK, Fan KC, Berrocal AM, Hoyek S, Patel NA, Sbrocca R, Capone A Jr, Drenser KA, Wood EH. The incidence and timing of treatment-requiring retinopathy of prematurity in nanopremature and micropremature infants in the United States: a national multicenter retrospective cohort study. Ophthalmol Retina. 2024;8(3):279–87. 10.1016/j.oret.2023.10.003. 10.1016/j.oret.2023.10.003 - DOI - PubMed
    1. Zhang L, Buonfiglio F, Fiess A, Pfeiffer N, Gericke A. Retinopathy of prematurity-targeting hypoxic and redox signaling pathways. Antioxidants (Basel). 2024;13(2):148. 10.3390/antiox13020148. 10.3390/antiox13020148 - DOI - PMC - PubMed
    1. Bancalari A, Schade R. Update in the treatment of retinopathy of prematurity. Am J Perinatol. 2022;39(1):22–30. 10.1055/s-0040-1713181. 10.1055/s-0040-1713181 - DOI - PubMed

MeSH terms

LinkOut - more resources