

Comparing robotic and open partial nephrectomy under the prism of surgical precision: a meta-analysis of the average blood loss rate as a novel variable
- PMID: 39112829
- PMCID: PMC11306375
- DOI: 10.1007/s11701-024-02060-z
Comparing robotic and open partial nephrectomy under the prism of surgical precision: a meta-analysis of the average blood loss rate as a novel variable
Abstract
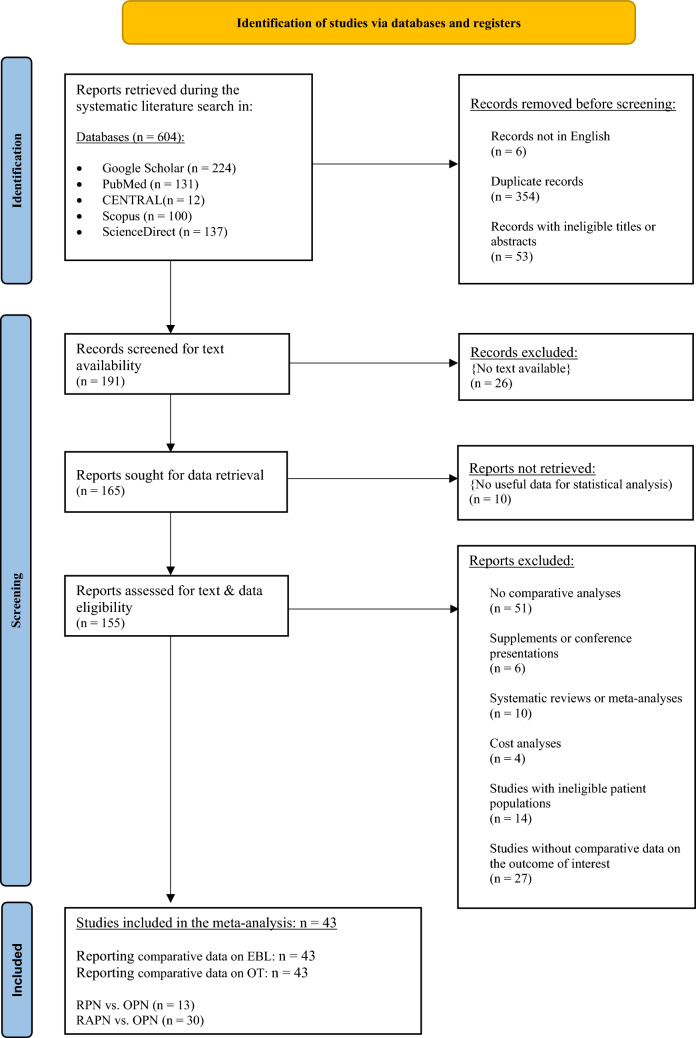
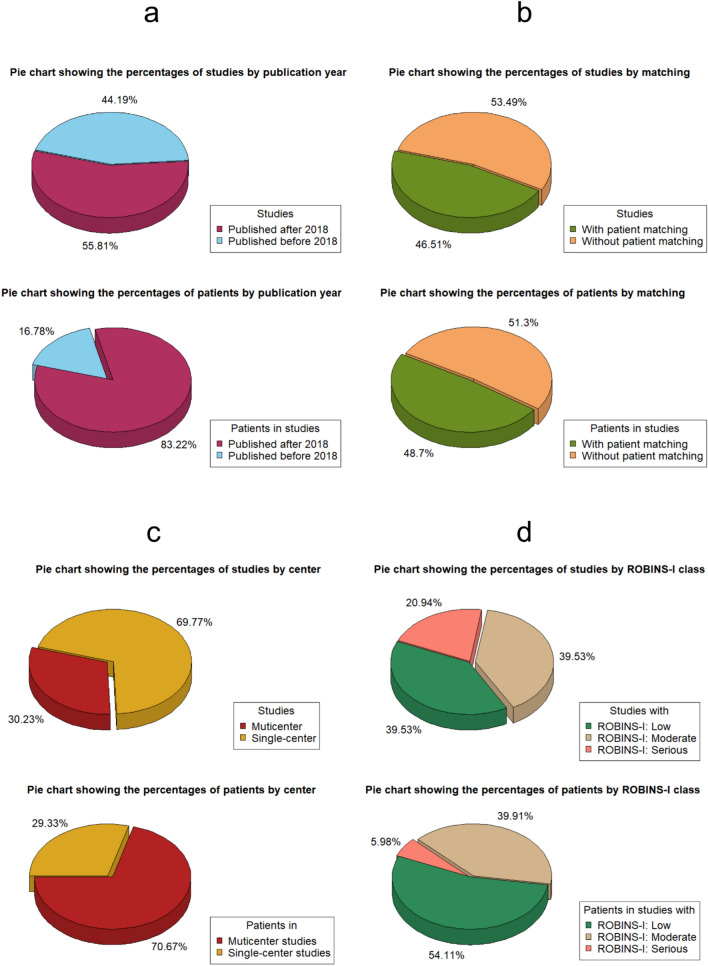
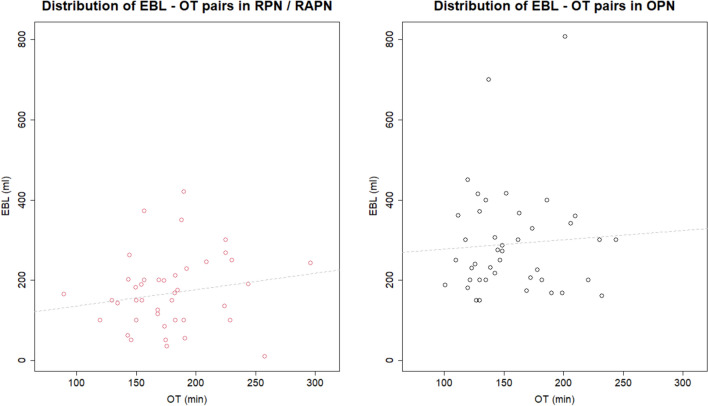
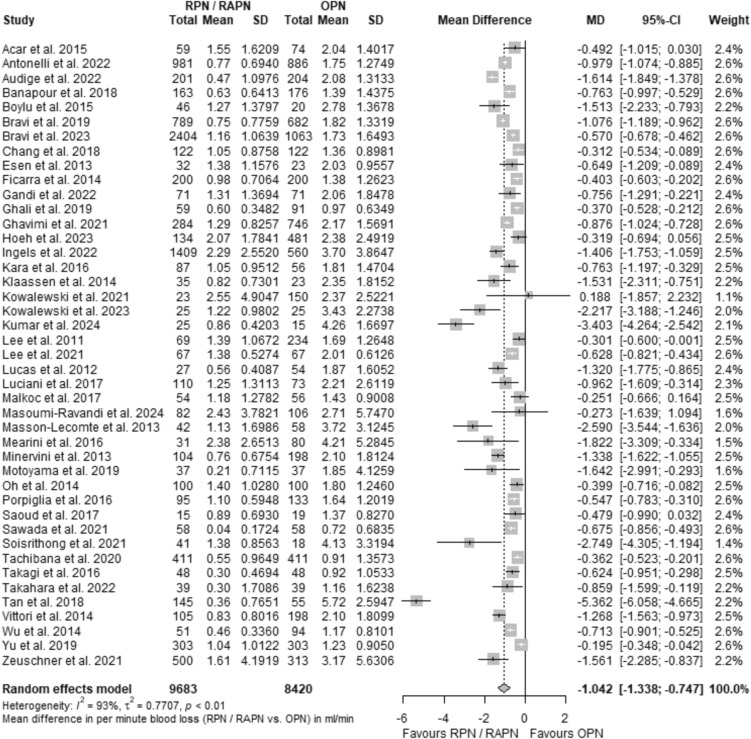
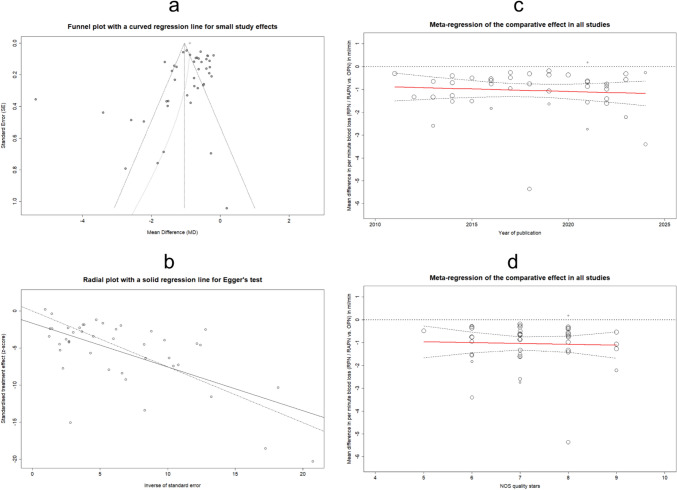
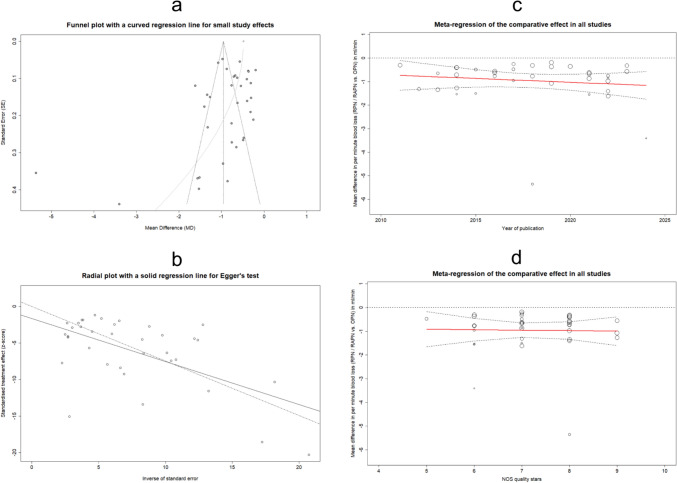
Exploration of surgical precision in robotic procedures is extensive, yet lacks a unified framework for comparability. This study examines tissue handling precision by comparing the per-minute blood loss rate between robotic and open partial nephrectomy. A literature search from August 2022 to June 2024 identified 43 relevant studies providing data on estimated blood loss and procedure duration. The expected values and standard errors of these variables were used to compute the per-minute blood loss rate (Q). Meta-analytical methods estimated pooled and subgroup-level mean differences, favoring robotic surgery (MDQ = - 1.043 ml/min, CI95% = [- 1.338; - 0.747]). Subgroup analyses by publication year, patient matching, referral center count, and ROBINS-I status consistently supported this advantage. Sensitivity analyses confirmed the above benefit in studies with increased accuracy in reported results (MDQ = - 0.957 ml/min, CI95% = [- 1.269; - 0.646]), low risk of bias involving matched comparisons (MDQ = - 0.563 ml/min, CI95% = [- 0.716; - 0.410]), large sample sizes and increased statistical power (MDQ = - 0.780 ml/min, CI95% = [- 1.134; - 0.425]), and multicenter analyses with patient matching (MDQ = - 0.481 ml/min, CI95% = [- 0.698; - 0.263]). The subsequent analysis of correlation between the original variables suggested a slight reduction in the robotic advantage when the latter were proportionally related. Multilevel meta-regression at both temporal and qualitative scales consistently indicated a comparative benefit of the robotic approach. Potentially, lower per-minute blood loss compared to open surgery suggests that robotic partial nephrectomy demonstrates enhanced precision in tissue handling.
Keywords: Nephron-sparing surgery; Partial nephrectomy; Robot-assisted surgery; Robotic surgery; Surgical precision.
© 2024. The Author(s).
Conflict of interest statement
The authors declare that there is no conflict of interest.
Figures


Similar articles
-
Impact of Surgical Factors on Robotic Partial Nephrectomy Outcomes: Comprehensive Systematic Review and Meta-Analysis.J Urol. 2018 Aug;200(2):258-274. doi: 10.1016/j.juro.2017.12.086. Epub 2018 Mar 24. J Urol. 2018. PMID: 29580709
-
Robot-assisted laparoscopic versus open partial nephrectomy in patients with chronic kidney disease: A propensity score-matched comparative analysis of surgical outcomes.Int J Urol. 2017 Jul;24(7):505-510. doi: 10.1111/iju.13363. Epub 2017 May 14. Int J Urol. 2017. PMID: 28503809
-
Predictors of renal function after open and robot-assisted partial nephrectomy: A propensity score-matched study.Int J Urol. 2019 Mar;26(3):377-384. doi: 10.1111/iju.13879. Epub 2018 Dec 24. Int J Urol. 2019. PMID: 30582218
-
Retroperitoneal Robot-Assisted Versus Open Partial Nephrectomy for cT1 Renal Tumors: A Matched-Pair Comparison of Perioperative and Early Oncological Outcomes.Clin Genitourin Cancer. 2018 Apr;16(2):e391-e396. doi: 10.1016/j.clgc.2017.09.010. Epub 2017 Oct 3. Clin Genitourin Cancer. 2018. PMID: 29074284
-
Impact of Host Factors on Robotic Partial Nephrectomy Outcomes: Comprehensive Systematic Review and Meta-Analysis.J Urol. 2018 Oct;200(4):716-730. doi: 10.1016/j.juro.2018.04.079. Epub 2018 May 3. J Urol. 2018. PMID: 29730203
Cited by
-
Global trends and hotspots in robot-assisted laparoscopic surgery for gastrointestinal diseases: a bibliometric and visualization.J Robot Surg. 2025 Sep 2;19(1):547. doi: 10.1007/s11701-025-02722-6. J Robot Surg. 2025. PMID: 40892132
References
-
- Mearini L, Nunzi E, Vianello A, Di Biase M, Porena M (2016) Margin and complication rates in clampless partial nephrectomy: a comparison of open, laparoscopic and robotic surgeries. J Robot Surg 10:135–144. 10.1007/s11701-016-0584-x - PubMed
-
- Kowalewski K-F, Müller D, Kirchner M, Brinster R, Mühlbauer J, Abate MAS et al (2021) Robotic-assisted versus conventional open partial nephrectomy (Robocop): a propensity score-matched analysis of 249 patients. Urol Int. 10.1159/000513189 - PubMed
-
- Artsitas S, Artsitas D, Segkou I, Tsourouflis G, Dimitroulis D, Nikiteas N (2022) Considering “Trifecta” as a single outcome when comparing robotic with open partial nephrectomy: a mathematical model of volume conservation and systematic review. In Vivo 36:2558–2578. 10.21873/invivo.12992 - PMC - PubMed
-
- Saoud R, El Hajj A, Shahait M, Bulbul M, Nasr R, Wazzan W et al (2017) Comparative analysis of robotic-assisted partial nephrectomy versus open partial nephrectomy during the initial robotic learning curve: does the end justify the means? World J Nephrol Urol 5:79–82. 10.14740/wjnu286w
-
- Masson-Lecomte A, Yates DR, Hupertan V, Haertig A, Chartier-Kastler E, Bitker MO et al (2013) A prospective comparison of the pathologic and surgical outcomes obtained after elective treatment of renal cell carcinoma by open or robot-assisted partial nephrectomy. Urol Oncol 31:924–929. 10.1016/j.urolonc.2011.08.004 - PubMed
Publication types
MeSH terms
LinkOut - more resources
Full Text Sources
