. 2024 Aug 7;23(1):286.
doi: 10.1186/s12933-024-02390-0.

Association between triglyceride-glucose related indices and all-cause and cause-specific mortality in the general population: a cohort study

Affiliations

Association between triglyceride-glucose related indices and all-cause and cause-specific mortality in the general population: a cohort study

Shan Li et al. Cardiovasc Diabetol. .

Abstract

Background: Although triglyceride-glucose (TyG) index is a reliable indicator of insulin resistance and cardiometabolic disease, its effectiveness in predicting mortality risk has not been adequately validated. We aimed to investigate the association between the TyG-related indices and all-cause and cause-specific mortality in the general population.

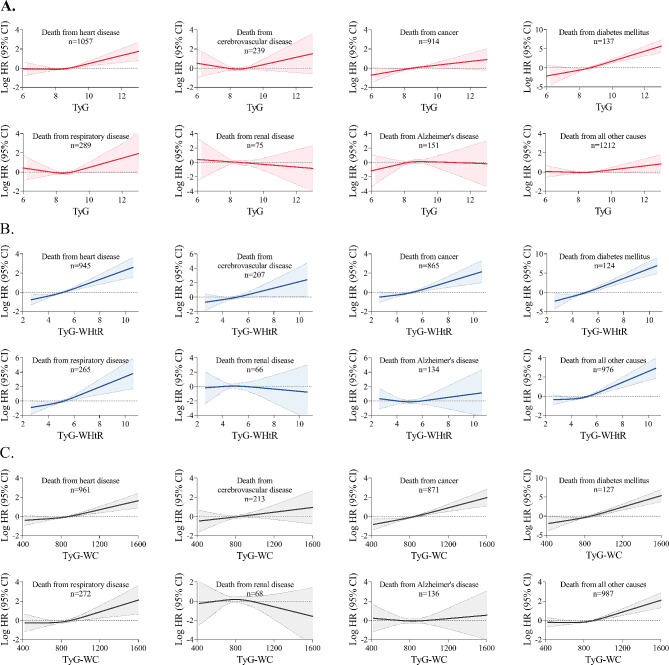
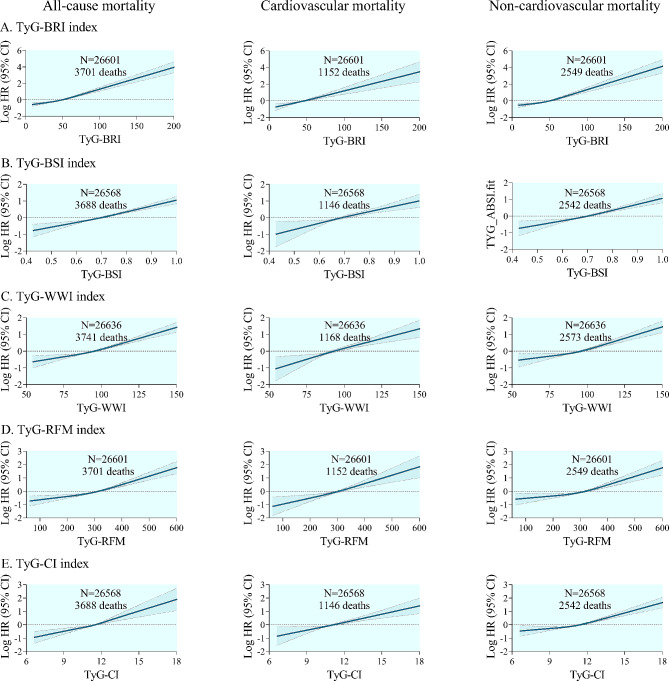
Methods: A total of 27,642 individuals were included from the National Health and Nutrition Examination Survey (NHANES) between 1999 and 2018. Three indicators were constructed, including the TyG index, TyG combined with waist-to-height ratio (TyG-WHtR), and TyG combined with waist circumference (TyG-WC). Mortality data was acquired through the linkage of NHANES data with National Death Index records. Weighted Cox proportional hazards models were used to estimate the independent association between the TyG-related indices and mortality. Nonlinear associations were explored using restricted cubic splines.

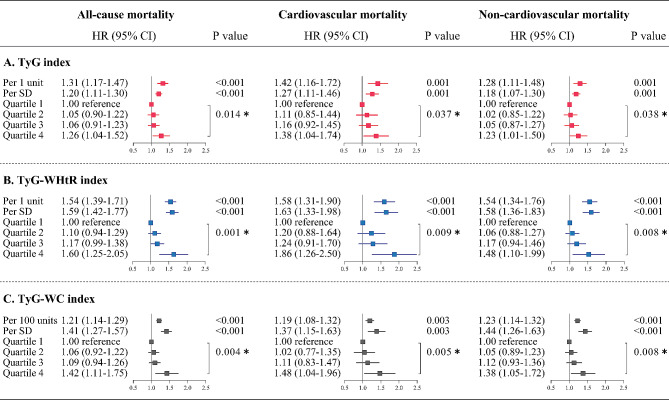
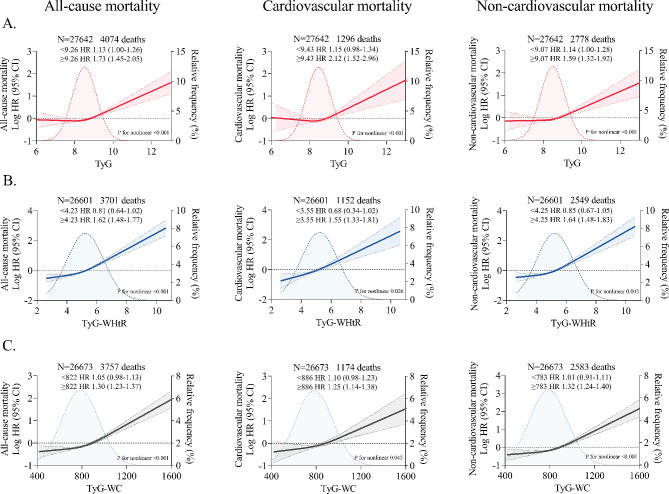
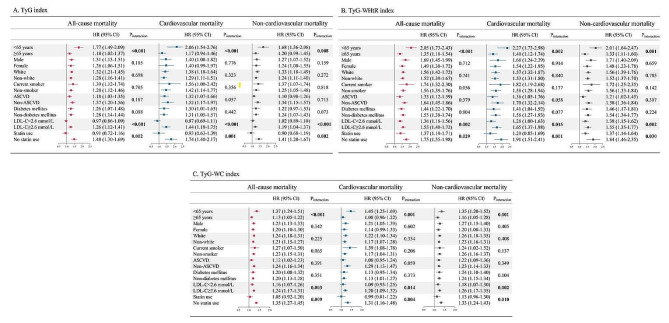
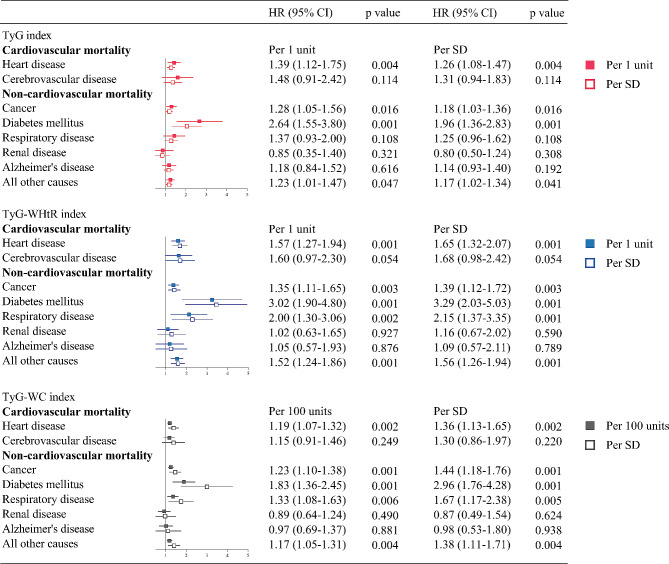
Results: Multivariable adjusted models showed a progressive increase in all-cause and cause-specific mortality across quartiles of the TyG-related indices. Compared with the lowest quartile of the TyG index, the highest quartile had adjusted hazard ratios of 1.26 (95% CI 1.04-1.52) for all-cause mortality, 1.38 (1.04-1.74) for cardiovascular mortality, and 1.23 (1.01-1.50) for non-cardiovascular mortality, respectively. For the TyG-WHtR index, the corresponding hazard ratios were 1.60 (1.25-2.05), 1.86 (1.26-2.50), and 1.48 (1.10-1.99), respectively. For the TyG-WC index, the corresponding hazard ratios were 1.42 (1.11-1.75), 1.48 (1.04-1.96), and 1.38 (1.05-1.72), respectively. The associations between the three TyG-related indices and all-cause, cardiovascular and non-cardiovascular mortality were J-shaped. Interaction tests revealed significant effect modification by age, low-density lipoprotein cholesterol (LDL-C) level, and statin use (all P values < 0.05).

Conclusions: The TyG-related indices were independent predictors of all-cause and cause-specific mortality in the general population. Young individuals should be particularly vigilant, whereas low LDL-C levels and statin use are potentially protective.

Keywords: All-cause mortality; Anthropometric measure; Cause-specific mortality; Triglyceride-glucose index; Waist circumference; Waist-to-height ratio.


Conflict of interest statement

The authors declare no competing interests.

Figures

Fig. 1
Fig. 1
Cox proportional hazards regression analyses for the association of TyG-related indices with all-cause and cause-specific mortality. All-cause and cause-specific mortality for quartiles of A TyG index, B TyG-WHtR index, and C TyG-WC index. Adjusted for age, sex, ethnicity, BMI, systolic blood pressure, smoking status, alcohol consumption, diabetes mellitus, ASCVD, COPD, chronic heart failure, chronic renal disease, cancer, total cholesterol, HDL-C, LDL-C, albumin, eGFR, statin use, and insulin or antihyperglycemic drugs. ∗P value for trend. Effect sizes for per SD and per 1 unit or per 100 units increase in TyG-related indices were also shown separately. BMI body mass index, ASCVD atherosclerotic cardiovascular disease, COPD chronic obstructive pulmonary disease, HDL high-density lipoprotein, LDL low-density lipoprotein
Fig. 2
Fig. 2
Restricted cubic spline curve for the association of TyG-related indices with all-cause and cause-specific mortality. All-cause and cause-specific mortality for A TyG index, B TyG-WHtR index, and C TyG-WC index. Solid lines represent hazard ratios, and dashed lines represent 95% confidence intervals. Adjusted for age, sex, ethnicity, BMI, systolic blood pressure, smoking status, alcohol consumption, diabetes mellitus, ASCVD, COPD, chronic heart failure, chronic renal disease, cancer, total cholesterol, HDL-C, LDL-C, albumin, eGFR, statin use, and insulin or antihyperglycemic drugs. The shaded areas in the background show the distribution of TyG-related indices in the population. Two-piece Cox proportional hazards models were used to estimate the risk inflection point, and effect sizes for per 1 unit (TyG index and TyG-WHtR index) or per 100 units (TyG-WC index) increase in TyG-related indices before and after the inflection point were shown separately
Fig. 3
Fig. 3
Stratified analyses of the associations between TyG-related indices and mortality. All-cause and cause-specific mortality in different strata as functions of 1-unit increase in A TyG index and B TyG-WHtR index or a 100-unit increase in C TyG-WC index. Adjusted for age, sex, ethnicity, BMI, systolic blood pressure, smoking status, alcohol consumption, diabetes mellitus, ASCVD, COPD, chronic heart failure, chronic renal disease, cancer, total cholesterol, HDL-C, LDL-C, albumin, eGFR, statin use, and insulin or antihyperglycemic drugs
Fig. 4
Fig. 4
Cox proportional hazards regression analyses for the association of TyG-related indices with cause-specific mortality subcategories. Adjusted for age, sex, ethnicity, BMI, systolic blood pressure, smoking status, alcohol consumption, diabetes mellitus, ASCVD, COPD, chronic heart failure, chronic renal disease, cancer, total cholesterol, HDL-C, LDL-C, albumin, eGFR, statin use, and insulin or antihyperglycemic drugs
Fig. 5
Fig. 5
Restricted cubic spline curve for the association of TyG-related indices with cause-specific mortality subcategories. A TyG index, B TyG-WHtR index, and C TyG-WC index. Solid lines represent hazard ratios, and dashed lines represent 95% confidence intervals. Adjusted for age, sex, ethnicity, BMI, systolic blood pressure, smoking status, alcohol consumption, diabetes mellitus, ASCVD, COPD, chronic heart failure, chronic renal disease, cancer, total cholesterol, HDL-C, LDL-C, albumin, eGFR, statin use, and insulin or antihyperglycemic drugs
Fig. 6
Fig. 6
Restricted cubic spline curve for the association of other TyG-derived indices with all-cause and cause-specific mortality. All-cause and cause-specific mortality for A TyG-BRI index, B TyG-BSI index, C TyG-WWI index, D TyG-RFM index, and E TyG-CI index. Solid lines represent hazard ratios, and dashed lines represent 95% confidence intervals. Adjusted for age, sex, ethnicity, BMI, systolic blood pressure, smoking status, alcohol consumption, diabetes mellitus, ASCVD, COPD, chronic heart failure, chronic renal disease, cancer, total cholesterol, HDL-C, LDL-C, albumin, eGFR, statin use, and insulin or antihyperglycemic drugs. BRI body roundness index, BSI body shape index, WWI weight-adjusted-waist index, RFM relative fat mass, CI conicity index

References

    1. World health statistics. 2024: monitoring health for the SDGs, sustainable development goals. [https://www.who.int/data/gho/publications/world-health-statistics. Accessed 21 May 2024.].
    1. Mastrototaro L, Roden M. Insulin resistance and insulin sensitizing agents. Metab Clin Exp. 2021;125:154892. 10.1016/j.metabol.2021.154892 - DOI - PubMed
    1. Wheatcroft SB, Williams IL, Shah AM, Kearney MT. Pathophysiological implications of insulin resistance on vascular endothelial function. Diabet Med: J Br Diabet Assoc. 2003;20(4):255–68.10.1046/j.1464-5491.2003.00869.x - DOI - PubMed
    1. Jia G, DeMarco VG, Sowers JR. Insulin resistance and hyperinsulinaemia in diabetic cardiomyopathy. Nat Rev Endocrinol. 2016;12(3):144–53. 10.1038/nrendo.2015.216 - DOI - PMC - PubMed
    1. Bloomgarden ZT. Measures of insulin sensitivity. Clin Lab Med. 2006;26(3):611–33 vi. 10.1016/j.cll.2006.06.007 - DOI - PubMed

Publication types

MeSH terms

LinkOut - more resources