. 2024 Aug 7;22(1):391.
doi: 10.1186/s12964-024-01774-9.

Concomitant targeting of FLT3 and SPHK1 exerts synergistic cytotoxicity in FLT3-ITD+ acute myeloid leukemia by inhibiting β-catenin activity via the PP2A-GSK3β axis

Affiliations

Concomitant targeting of FLT3 and SPHK1 exerts synergistic cytotoxicity in FLT3-ITD+ acute myeloid leukemia by inhibiting β-catenin activity via the PP2A-GSK3β axis

Ling Jiang et al. Cell Commun Signal. .

Abstract

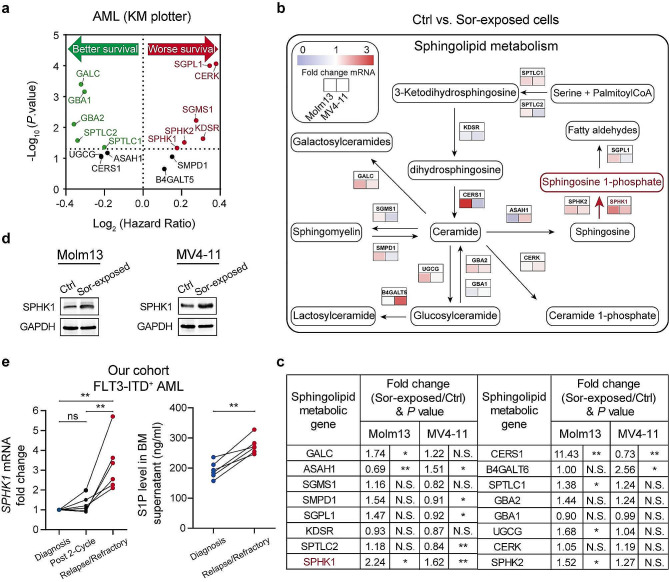
Background: Approximately 25-30% of patients with acute myeloid leukemia (AML) have FMS-like receptor tyrosine kinase-3 (FLT3) mutations that contribute to disease progression and poor prognosis. Prolonged exposure to FLT3 tyrosine kinase inhibitors (TKIs) often results in limited clinical responses due to diverse compensatory survival signals. Therefore, there is an urgent need to elucidate the mechanisms underlying FLT3 TKI resistance. Dysregulated sphingolipid metabolism frequently contributes to cancer progression and a poor therapeutic response. However, its relationship with TKI sensitivity in FLT3-mutated AML remains unknown. Thus, we aimed to assess mechanisms of FLT3 TKI resistance in AML.

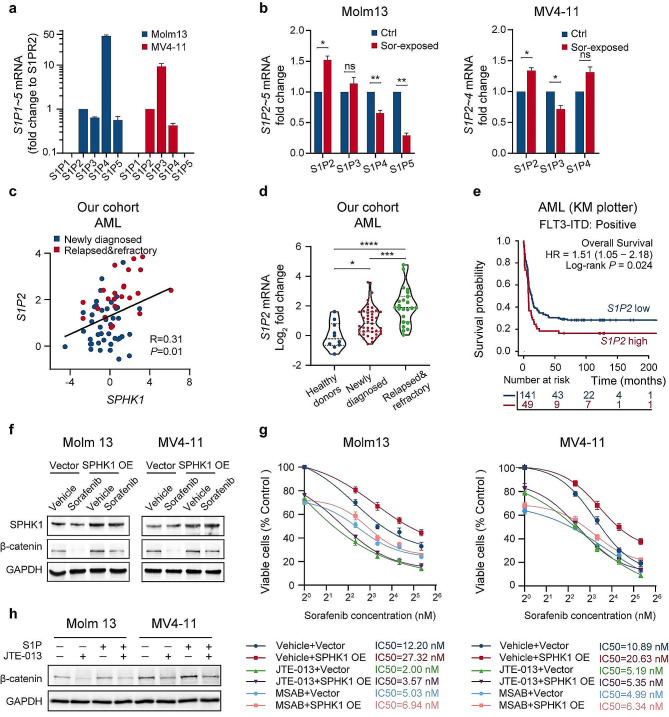
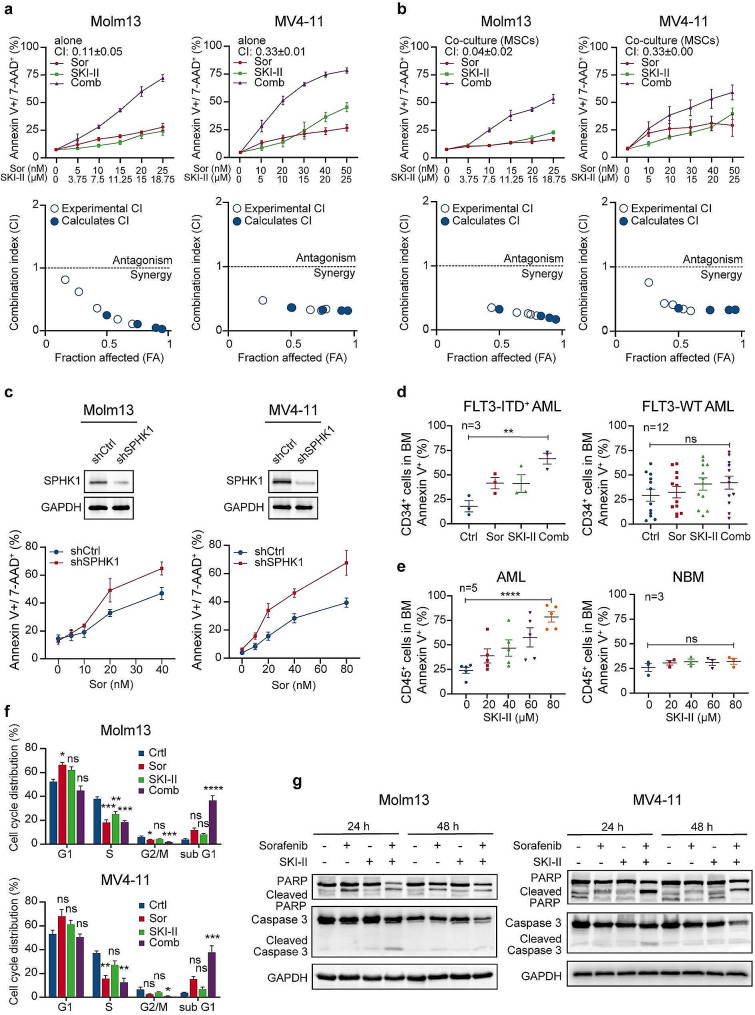
Methods: We performed lipidomics profiling, RNA-seq, qRT-PCR, and enzyme-linked immunosorbent assays to determine potential drivers of sorafenib resistance. FLT3 signaling was inhibited by sorafenib or quizartinib, and SPHK1 was inhibited by using an antagonist or via knockdown. Cell growth and apoptosis were assessed in FLT3-mutated and wild-type AML cell lines via Cell counting kit-8, PI staining, and Annexin-V/7AAD assays. Western blotting and immunofluorescence assays were employed to explore the underlying molecular mechanisms through rescue experiments using SPHK1 overexpression and exogenous S1P, as well as inhibitors of S1P2, β-catenin, PP2A, and GSK3β. Xenograft murine model, patient samples, and publicly available data were analyzed to corroborate our in vitro results.

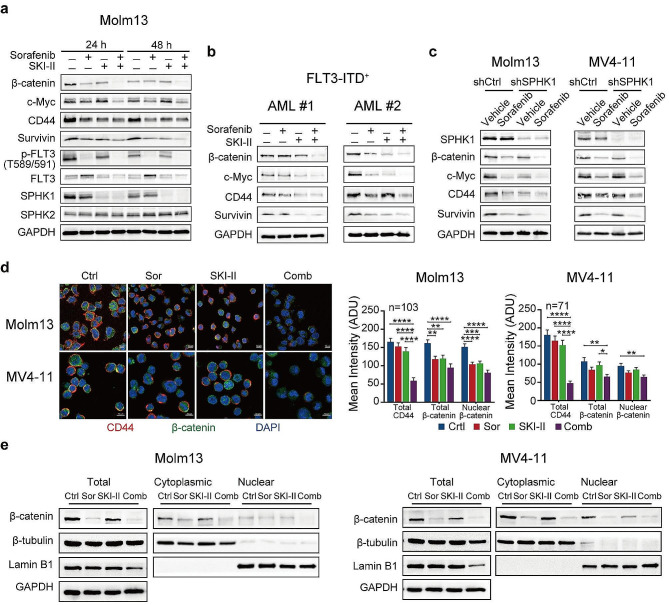
Results: We demonstrate that long-term sorafenib treatment upregulates SPHK1/sphingosine-1-phosphate (S1P) signaling, which in turn positively modulates β-catenin signaling to counteract TKI-mediated suppression of FLT3-mutated AML cells via the S1P2 receptor. Genetic or pharmacological inhibition of SPHK1 potently enhanced the TKI-mediated inhibition of proliferation and apoptosis induction in FLT3-mutated AML cells in vitro. SPHK1 knockdown enhanced sorafenib efficacy and improved survival of AML-xenografted mice. Mechanistically, targeting the SPHK1/S1P/S1P2 signaling synergizes with FLT3 TKIs to inhibit β-catenin activity by activating the protein phosphatase 2 A (PP2A)-glycogen synthase kinase 3β (GSK3β) pathway.

Conclusions: These findings establish the sphingolipid metabolic enzyme SPHK1 as a regulator of TKI sensitivity and suggest that combining SPHK1 inhibition with TKIs could be an effective approach for treating FLT3-mutated AML.

Keywords: Acute myeloid leukemia; FLT3; SPHK1; Sphingolipid; Tyrosine kinase inhibitor; Β-catenin.


Conflict of interest statement

The authors declare no competing interests.

Figures

Fig. 1
Fig. 1
FLT3-ITD+ AML cells exhibit changes in sphingolipid metabolism changes upon long-term FLT3 inhibition. (a) Experimental scheme. Exposure of Molm13 cells to gradually increasing concentrations of sorafenib for 3 months, followed by LC/MS and RNA-seq analysis. (b) Lipidomic profiles in sorafenib-exposed Molm13 cells revealed via LC-MS and expressed as fold-change (FC) compared to parental cells (n = 4 biological replicates). (c) Heatmap showing differentially expressed genes in the Gene Ontology category associated with sphingolipid metabolism in TKI resistant FLT3-ITD+ AML cells. (d) GSEA of the upregulated genes signatures in sorafenib resistant MV4-11 cells (normalized enrichment score [NES] > 1; adj.P < 0.05). (e) Schematic of the four major sphingolipid metabolites. (fh) Lipidomic analysis of parental and sorafenib-exposed Molm13 cells via LC-MS-based targeted metabolomics (n = 4 biological replicates). Data are presented as the mean ± SEM. Ctrl, control; Sor, sorafenib; ns, non-significant difference.*p < 0.05
Fig. 2
Fig. 2
Long-term sorafenib treatment upregulates the SPHK1/S1P axis in FLT3-ITD+ AML cells. (a) Volcano plot illustrating the hazard ratio (Log2) and P value (-Log10) between overall survival and the expression of 16 sphingolipid metabolic genes in AML (KM Plotter database). Genes linked to poor prognosis are highlighted in red. (b) Metabolic network of the sphingolipid metabolic reactions, together with main metabolites and 16 selected sphingolipid metabolic genes. Expression heatmap of the 16 selected sphingolipid genes in sorafenib-exposed Molm13 and MV4-11 cells compared to in their parental cells. (c) Average fold change and statistical analysis of the expression of 16 sphingolipid metabolism genes between sorafenib-exposed cell lines and their parental cells. (d) Western blot analysis of SPHK1 expression in both sorafenib-treated (3 months) cell lines as compared to their parental cells. (e) qRT-PCR analysis of SPHK1 expression in BM mononuclear blasts and ELISA detection of S1P levels in BM supernatant (n = 6, our cohort) from paired primary diagnosis, post 2-cycle of chemotherapy, and relapsed/refractory FLT3-ITD+ AML patients. Data are presented as the mean ± SEM. Ctrl, control; Sor, sorafenib; N.S., non-significant difference.*p < 0.05, **p < 0.01
Fig. 3
Fig. 3
SPHK1/S1P axis upregulates β-catenin signaling and maintains leukemia cell survival. (a) GSEA of the upregulated genes signatures in FLT3-mutated AML patients with high SPHK1 expression (NES > 1; adj.P < 0.05) from the TCGA cohort. (b) Pearson correlation between SPHK1 and CTNNB1 expression in AML patient samples determined via qRT-PCR (n = 66, our cohort). (c) qRT-PCR analysis of relative CTNNB1 expression in healthy donors (n = 10) and AML patients (n = 66) from our cohort. Values are shown as log2 fold-change relative to healthy donors. (d) ELISA detection of S1P levels in lysates from Molm13 and MV4-11 cells treated with SKI-II (20 µM) for 24 h. (e) Western blot analysis of Molm13 cells after treatment with the indicated concentrations of SKI-II for 24, 48, and 72 h. (f) Western blot analysis of primary FLT3-ITD+ AML blasts treated with the indicated concentrations of SKI-II (48 h). (g) Apoptosis in Molm13 and MV4-11 cells pretreated with or without exogenous BSA-conjugated S1P (1 µM, added once every 3 h for 24 h) for 2 h, followed by treatment with SKI-II (25 µM) for 24 h. (h) Western blot analysis of Molm13 and MV4-11 cells treated with SKI-II (20 µM), S1P (1 µM), or both for 24 h. Data are presented as the mean ± SEM. Ctrl, control. *p < 0.05, **p < 0.01
Fig. 4
Fig. 4
SPHK1/S1P enhances β-catenin signaling via the S1P2 receptor. (a) qRT-PCR analysis of S1P1-5 expression in Molm13 and MV4-11 cells. (b) qRT-PCR analysis of S1P receptor expression in sorafenib-exposed cell lines and their parental cells. (c) Pearson correlation between S1P2 and SPHK1 expression in AML patient samples determined via qRT-PCR (n = 66, our cohort). (d) qRT-PCR analysis of relative S1P2 expression in healthy donors (n = 10), newly diagnosed AML patients (n = 43), and relapsed/refractory AML patients (n = 23) from our cohort. Values are shown as log2 fold-change relative to healthy donors. (e) Overall survival of FLT3-ITD+ AML patients with high or low S1P2 expression (n = 190, KM plotter database). (f) Molm13 and MV4-11 cells, transduced with empty vectors (Vector) or SPHK1-expressing vectors (SPHK1 OE), were treated with sorafenib (15 or 30 nM) for 24 h and subjected to western blot to detect the indicated proteins. (g) Molm13 and MV4-11 cells were transduced with Vector or SPHK1 OE and then treated with either the vehicle (dimethyl sulfoxide), JTE-013 (S1P2 inhibitor, 20 µM), or MSAB (β-catenin inhibitor, 3 µM), followed by culture with increasing doses of sorafenib for 24 h. Cell viability was measured using a CCK-8 assay. Median inhibitory concentration (IC50) values for sorafenib are shown at bottom. (h) Western blot analysis in Molm13 and MV4-11 cells treated with JTE-013 (20 µM), S1P (1 µM), or both for 24 h. Data are presented as the mean ± SEM. Ctrl, control; Sor, sorafenib; ns, non-significant difference. *p < 0.05, **p < 0.01, ***p < 0.001, ****p < 0.0001
Fig. 5
Fig. 5
Targeting SPHK1 impairs AML survival and synergizes with TKIs to suppress FLT3-ITD+ AML cell proliferation. (a) Box plots visualize the cancer dependency on SPHK1 in different cancer lines (shown in the parenthesis) across different cancer types in the DepMap database. Cell lines with a chronos score < 0 (red line) exhibit SPHK1 dependency. Molm13 (b, d) and MV4-11 (c, e) cells were treated with FLT3 TKI (sorafenib or quizartinib), SKI-II, or both for 48 h. Cell viability was measured using an CCK-8 assay. Combinatorial Index (CI) blots are shown on the right. CI < 1 indicates a synergistic effect. Data are presented as the mean ± SEM. Ctrl, control; Sor, sorafenib; Comb, combination
Fig. 6
Fig. 6
SPHK1 inhibition synergistically enhances the TKI-induced apoptosis of FLT3-ITD+ AML cells and CD34+ AML stem cells. Apoptosis in Molm13 and MV4-11 cells without (a) or with (b) mesenchymal stem cells (MSCs) co-culture, following treatment with sorafenib, SKI-II, or both for 48 h. CI blots are shown at bottom. CI < 1 indicates a synergistic effect. (c) Apoptosis in Molm13 and MV4-11 cells expressing control shRNA (shCtrl) or SPHK1 shRNA (shSPHK1) upon sorafenib treatment for 48 h. SPHK1 depletion was confirmed via western blot. (d) Apoptosis of CD34+ cells among FLT3-ITD+ and FLT3-WT AML blasts treated with sorafenib (2 µM), SKI-II (30 µM), or both for 48 h. (e) Apoptosis of CD45+ cells among AML and normal bone marrow (NBM) blasts treated with increasing doses of SKI-II, as indicated, for 48 h. (f) Cell cycle analysis of Molm13 or MV4-11 cells treated with sorafenib (15 or 30 nM), SKI-II (20 µM), or both for 24 h. (g) Levels of cleaved caspase 3 and PARP were analyzed by western blot in Molm13 and MV4-11 cells treated with sorafenib (15 or 30 nM), SKI-II (20 µM), or both for 24 and 48 h. Data are presented as the mean ± SEM. Ctrl, control; Sor, sorafenib; Comb, combination. *p < 0.05, **p < 0.01, ***p < 0.001, ****p < 0.0001
Fig. 7
Fig. 7
SPHK1 knockdown enhances sorafenib activity in Molm13-GFP/Luc xenograft NCG mice. (a) Experimental scheme. NCG mice were injected intravenously with 5 × 105 Molm13-GFP/Luc cells expressing shCtrl or shSPHK1. After engraftment was confirmed, mice were treated daily with vehicle or sorafenib for 4 weeks. (bc) Bioluminescent imaging (b) and quantification (c) at designated time points. (d) Spleen sizes of mice (n = 3/group). (e) Flow cytometric analysis of human CD45+ leukemia cells in mouse BM and spleen after a 14-day treatment (n = 3/group). (f) Kaplan–Meier survival curve of mice (n = 7/group). Data are presented as the mean ± SEM. Sor, sorafenib; *p < 0.05, **p < 0.01, ****p < 0.0001
Fig. 8
Fig. 8
Combined SPHK1 inhibitor and TKI treatment suppresses β-catenin signaling, reducing β-catenin nuclear localization. (a) Western blot analysis of Molm13 cells after treatment with sorafenib (15 nM), SKI-II (20 µM), or both for 24 and 48 h. (b) Western blot analysis of primary FLT3-ITD+ AML blasts treated with sorafenib (2 µM), SKI-II (20 µM), or both for 48 h. (c) Western blot analysis of Molm13 and MV4-11 cells expressing shCtrl or shSPHK1 following sorafenib (15 or 30 nM) treatment for 24 h. (d) Confocal images and quantification of total CD44, total β-catenin, and nuclear β-catenin levels in Molm13 or MV4-11 cells treated with sorafenib (15 or 30 nM), SKI-II (20 µM), or both for 48 h. Scale bars indicate 10 μm. (e) β-catenin expression in total, cytoplasmic, and nuclear fractions was analyzed by western blot in Molm13 or MV4-11 cells treated with sorafenib (15 or 30 nM), SKI-II (20 µM), or both for 48 h, as determined via western blot. Data are presented as the mean ± SEM. Ctrl, control; Sor, sorafenib; Comb, combination. *p < 0.05, **p < 0.01, ***p < 0.001, ****p < 0.0001
Fig. 9
Fig. 9
Co-targeting SPHK1 and FLT3 stimulates β-catenin degradation via PP2A-GSK3β axis. (ab) Western blot analysis of Molm13 and MV4-11 cells after treatment with (a) sorafenib (15 or 30 nM) or (b) quizartinib (1.2 or 2.4 nM) either alone or in combination with SKI-II (20 µM) for 24 and 48 h. (c) Western blot analysis of Molm13 and MV4-11 cells expressing shCtrl or shSPHK1 upon sorafenib (15 or 30 nM) treatment for 24 h. (de) Western blot analysis of Molm13 and MV4-11 cells after treatment with SKI-II (20 µM) in the absence/presence of (d) okadaic acid (OA, PP2A inhibitor; 10 nM) or (e) TWS119 (GSK3β inhibitor; 10 µM) for 24 h
Fig. 10
Fig. 10
Schematic model illustrating the mechanism of combined inhibition of FLT3 and SPHK1. When FLT3-ITD+ AML cells are exposed to long-term FLT3 inhibitors, the SPHK1/S1P/S1P2 signaling is upregulated, leading to the inactivation of the PP2A-GSK3β axis. Subsequently, activated β-catenin translocates to the nucleus, facilitating the transcription of its target genes, thereby promoting the maintenance of FLT3-ITD+ AML upon TKI treatment (left panel). However, concomitant targeting of SPHK1 and FLT3 signaling disrupts the inhibitory effect of SPHK1 on the PP2A-GSK3β axis and facilitates β-catenin degradation, thus significantly enhances FLT3 inhibitor-induced killing of leukemic cells (right panel)

Similar articles

References

    1. Ley TJ, Miller C, Ding L, Raphael BJ, Mungall AJ, Robertson AG, Hoadley K, Triche TJ, Laird PW, Baty JD, et al. Genomic and epigenomic landscapes of adult de novo acute myeloid leukemia. N Engl J Med. 2013;368(22):2059–74. 10.1056/NEJMoa1301689 - DOI - PMC - PubMed
    1. Choudhary C, Olsen JV, Brandts C, Cox J, Reddy PNG, Böhmer FD, Gerke V, Schmidt-Arras D-E, Berdel WE, Müller-Tidow C, et al. Mislocalized activation of oncogenic RTKs switches downstream signaling outcomes. Mol Cell. 2009;36(2):326–39. 10.1016/j.molcel.2009.09.019 - DOI - PubMed
    1. Gebru MT, Wang H-G. Therapeutic targeting of FLT3 and associated drug resistance in acute myeloid leukemia. J Hematol Oncol. 2020;13(1):155. 10.1186/s13045-020-00992-1 - DOI - PMC - PubMed
    1. Yang X, Sexauer A, Levis M. Bone marrow stroma-mediated resistance to FLT3 inhibitors in FLT3-ITD AML is mediated by persistent activation of extracellular regulated kinase. Br J Haematol. 2014;164(1):61–72. 10.1111/bjh.12599 - DOI - PMC - PubMed
    1. Piloto O, Wright M, Brown P, Kim K-T, Levis M, Small D. Prolonged exposure to FLT3 inhibitors leads to resistance via activation of parallel signaling pathways. Blood. 2007;109(4):1643–52. 10.1182/blood-2006-05-023804 - DOI - PMC - PubMed

MeSH terms