. 2024 Aug 7;12(1):24.
doi: 10.1186/s40170-024-00348-0.

The polyunsaturated fatty acid docosahexaenoic affects mitochondrial function in prostate cancer cells

Affiliations

The polyunsaturated fatty acid docosahexaenoic affects mitochondrial function in prostate cancer cells

Guilherme Henrique Tamarindo et al. Cancer Metab. .

Abstract

Background: Prostate cancer (PCa) shows a rewired metabolism featuring increased fatty acid uptake and synthesis via de novo lipogenesis, both sharply related to mitochondrial physiology. The docosahexaenoic acid (DHA) is an omega-3 polyunsaturated fatty acid (PUFA) that exerts its antitumoral properties via different mechanisms, but its specific action on mitochondria in PCa is not clear. Therefore, we investigated whether the DHA modulates mitochondrial function in PCa cell lines.

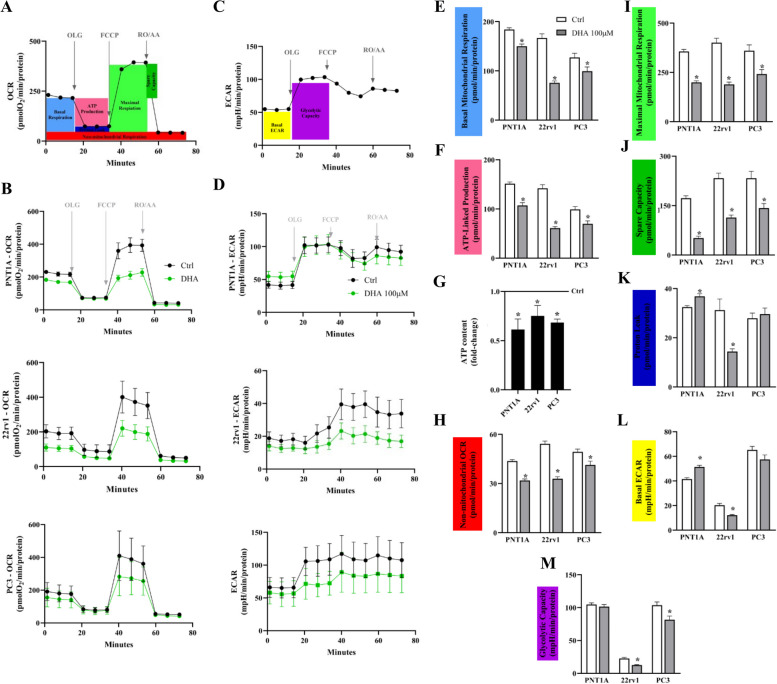
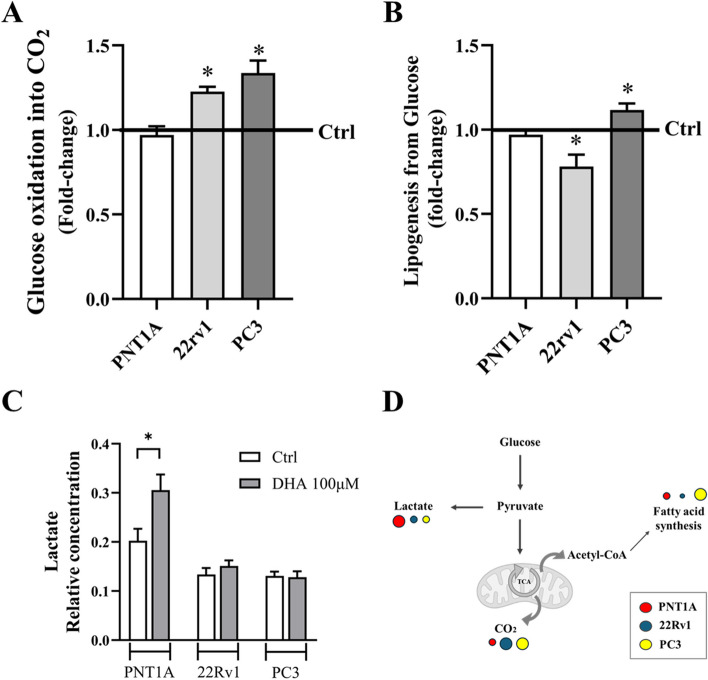
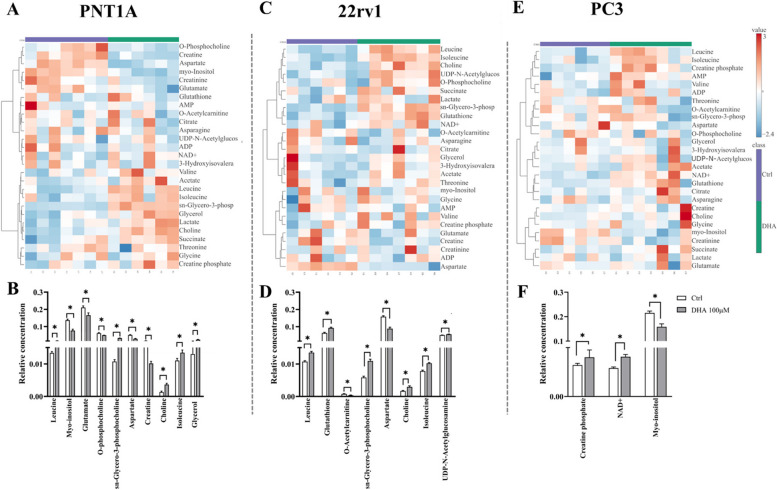
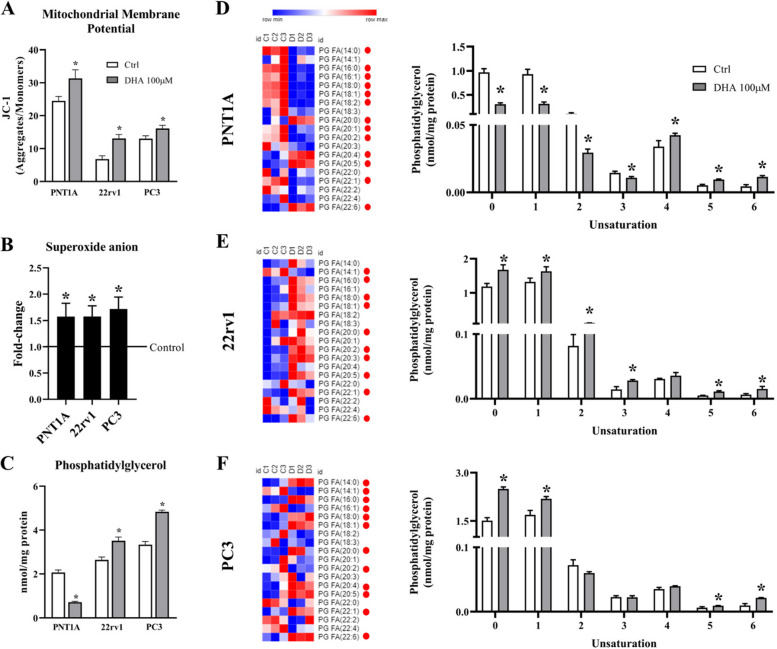
Methods: Here, we evaluated mitochondrial function of non-malignant PNT1A and the castration-resistant (CRPC) prostate 22Rv1 and PC3 cell lines in response to DHA incubation. For this purpose, we used Seahorse extracellular flux assay to assess mitochondria function, [14C]-glucose to evaluate its oxidation as well as its contribution to fatty acid synthesis, 1H-NMR for metabolite profile determination, MitoSOX for superoxide anion production, JC-1 for mitochondrial membrane polarization, mass spectrometry for determination of phosphatidylglycerol levels and composition, staining with MitoTracker dye to assess mitochondrial morphology under super-resolution in addition to Transmission Electron Microscopy, In-Cell ELISA for COX-I and SDH-A protein expression and flow cytometry (Annexin V and 7-AAD) for cell death estimation.

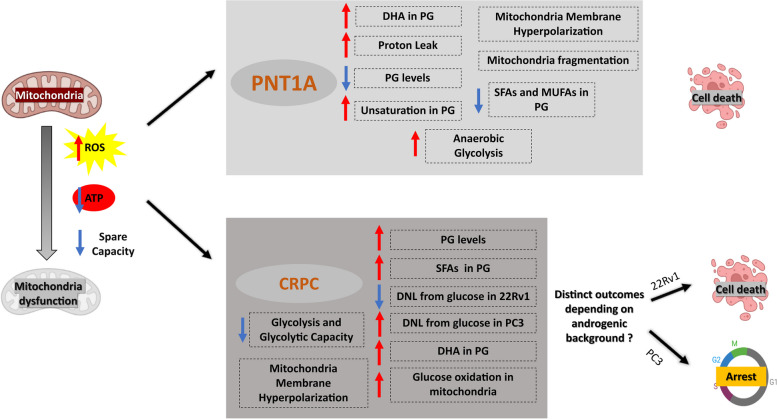
Results: In all cell lines DHA decreased basal respiratory activity, ATP production, and the spare capacity in mitochondria. Also, the omega-3 induced mitochondrial hyperpolarization, ROS overproduction and changes in membrane phosphatidylglycerol composition. In PNT1A, DHA led to mitochondrial fragmentation and it increased glycolysis while in cancer cells it stimulated glucose oxidation, but decreased de novo lipogenesis specifically in 22Rv1, indicating a metabolic shift. In all cell lines, DHA modulated several metabolites related to energy metabolism and it was incorporated in phosphatidylglycerol, a precursor of cardiolipin, increasing the unsaturation index in the mitochondrial membrane. Accordingly, DHA triggered cell death mainly in PNT1A and 22Rv1.

Conclusion: In conclusion, mitochondrial metabolism is significantly affected by the PUFA supplementation to the point that cells are not able to proliferate or survive under DHA-enriched condition. Moreover, combination of DHA supplementation with inhibition of metabolism-related pathways, such as de novo lipogenesis, may be synergistic in castration-resistant prostate cancer.

Keywords: Docosahexaenoic acid; Lipid metabolism; Mitochondria; Omega-3 polyunsaturated fatty acids; Prostate cancer cells.


Conflict of interest statement

The authors declare no competing interests.

Figures

Fig. 1
Fig. 1
DHA induces mitochondria dysfunction in PNT1A and castration-resistant prostate cells. A Example of Oxygen Consumption Rates (OCR) calculated for each respiratory parameter from Seahorse data and (B) their representative profiles for each cell line after normalization. C Example of Extracellular Acidification Rate (ECAR) calculated for each respiratory parameter from Seahorse data and (D) their representative profiles for each cell line after normalization. Black and green lines show control and DHA-treated cells, respectively. E Basal Mitochondrial Respiration without any inhibitors indicated mitochondria activity reduction. F OCR required for ATP-linked production and (G) ATP content, measured by mono-oxygenation of luciferin. H Non-mitochondrial respiration OCR. I Maximum Mitochondrial Respiration and (J) Spare capacity showed that DHA decreased the bioenergetic reserve. K Proton Leak. OCR values show mean and SEM of pmolO2/minute/protein (n = 20, two independent experiments) while ATP content indicates fold-change relative to control (n = 9, three independent experiments). L Basal ECAR and (M) ECAR under oligomycin inhibition, suggesting glycolytic capacity. Values show mpH/minute/protein O.D. and SEM (n = 20, two independent experiments). Legend: Ctrl – vehicle incubation; DHA – docosahexaenoic acid; *—statistically different from control (p < 0.05) after unpaired t-test
Fig. 2
Fig. 2
DHA affects glucose metabolism. A [14C]-CO2 production from [14C]-glucose oxidation is increased in castrated-resistant cells. [14C] cells. B Lipogenesis from [14C]-glucose carbons is decreased in 22Rv1, increased in PC3 and unchanged in PNT1A cells.[14C]-CO2 [14C]ant cells. Values shown as mean of fold-change of CPM/viable cells related to control (vehicle) and SEM. C Lactate intracellular levels from 1H-NMR experiment. Values were shown as mean of relative concentration to sum and SEM. D Proposed rewire of glucose metabolism. Large circles mean increase while smaller circles decrease in PNT1A (red), 22Rv1 (blue) and PC3 (yellow). Legend: Ctrl – vehicle incubation; DHA – docosahexaenoic acid; *—statistically different from control (p < 0.05) after unpaired t-test
Fig. 3
Fig. 3
DHA changed the metabolites profile. Heatmap and relative quantification of assigned metabolites for (AB) PNT1A, (CD) 22Rv1 and (EF) PC3 identified by 1H-NMR after incubation with DHA at 100 µM for 48 h. Heatmaps were generated using z-score and features were clustered. Red squares mean increased concentration while blue decreased. Values in the bar graphs show the mean of relative concentration to sum and SEM (n = 6/group at least, three independent experiments) for statistically significant metabolites. Legend: NAD +—nicotinamide adenine dinucleotide; Ctrl – vehicle incubation; DHA – docosahexaenoic acid; *—statistically different from control (p < 0.05 and FDR = 0.1) after unpaired t-test
Fig. 4
Fig. 4
DHA leads to mitochondria hyperpolarization, O2•− overproduction and changes in phosphatidylglycerol composition. A Increase in mitochondria membrane potential after DHA incubation, assessed with JC-1 dye. Values show the mean of J-aggregates to monomers ratio and SEM (n = 9). B O2•− overproduction determined by MitoSOX Red. Values show the mean of fold-change relative to control and SEM (n = 9). C Phosphatidylglycerol concentrations in each cell line after DHA or vehicle incubation. Values show the mean of nmol/mg of protein and SEM (n = 3). D-F Heat maps on the left display the most significant phosphatidylglycerol fatty acid composition determined by mass spectrometry. Red squares in each row mean increase and blue decrease in concentration (nmol/mg protein) scaled to z-score. Red dots showed statistically different compared to the control. Graphs on the right side indicate the sum by unsaturation in among all PG detected. Values show mean of nmol/mg protein and SEM (n = 3). Three independent experiments were performed for statistical analysis. Legend: Ctrl – vehicle incubation; DHA – docosahexaenoic acid; FA – fatty acid; PG – phosphatidylglycerol; *—statistically different from control (p < 0.05) after unpaired t-test
Fig. 5
Fig. 5
DHA induces mitochondria fragmentation in PNT1A and organelle damage in CRPC cells. A Mitochondria network in red and nuclei in blue (Nu) evidenced by MitoTracker Orange CMTMRos dye and Hoechst 33342, respectively. Arrows point to elongated mitochondria, whereas arrowhead to the fragmented. Images were captured at 400 × magnification. B Ultrastructure of prostate cells by TEM. Images validate mitochondrial fragmentation in the first two columns (bar 2 μm) and damage in the third (bar 200 nm). C Expression of Succinate dehydrogenase A (SDH-A), a nuclei-encoded protein, (D) Subunit I of Complex IV (COX-I), a mitochondria-encoded, and (E) COX-I to SDH-A ratio. Values show the mean of Relative Fluorescence Units (RFU) per cell and SEM. Three independent experiments were performed for statistical analysis. Legend: Ctrl – vehicle incubation; DHA – docosahexaenoic acid; Nu – nucleus; LD – lipid droplet; Mt – mitochondria; ER – endoplasmic reticulum; * – statistically different from control (p < 0.05) after unpaired t-test
Fig. 6
Fig. 6
DHA triggers apoptosis in PNT1A and 22Rv1, but not in PC3. Representative flow cytometry charts for (A-C) PNTA, (D-F) 22Rv1 and (G-I) PC3 cell populations. DHA induced apoptosis in 22Rv1 and PNT1A which was not clear for PC3. Two independent experiments were performed and acquired 2 × 104 events. Values were shown as mean of fold-change to vehicle incubation and SD. Representative cytograms were plotted in the first (vehicle) and second column (DHA) with mean of events in each gate. Legend: Annexin V-/7-AAD- – viable population; Annexin V-/7-AAD +—potentially necrosis; Annexin V + /7-AAD- – early apoptosis; Annexin V + /7-AAD + – late apoptosis. Legend: Ctrl – vehicle incubation; DHA – docosahexaenoic acid; evts – events
Fig. 7
Fig. 7
Summary. DHA led to mitochondria dysfunction in non-malignant and CRPC cell lines by inducing ROS, impairment of ATP production and spare capacity. Such effect led to distinct outcomes depending on the molecular background. DHA turned PNT1A cells more glycolytic, increased proton leak and induced to changes in the mitochondrial membrane composition that raised the unsaturation status hence more susceptible to oxidative damage. Also, the omega-3 induced mitochondria fragmentation. In CRPC cells, DHA induced reprogramming of glucose metabolism, especially by decreasing glycolytic capacity, a crucial route for biosynthesis in proliferating cells, and shifting glucose towards its oxidation in mitochondria. In 22Rv1 it decreased de novo lipogenesis (DNL) while increased in PC3. However, the androgenic background seemed to determine the outcome of these alterations, being cell death triggered in PNT1A and 22Rv1 and cell cycle arrest in PC3. Legend: ROS – reactive oxygen species; ATP – adenosine triphosphate; CRPC – castrated-resistant prostate cancer; AR – androgen receptor; PG – phosphatidylglycerol; SFAs – saturated fatty acids; MUFAs – monounsaturated fatty acids; DHA – docosahexaenoic acid

References

    1. Siegel RL, Miller KD, Fuchs HE, Jemal A. Cancer statistics, 2022. CA Cancer J Clin. 2022;72:7–33. 10.3322/caac.21708 - DOI - PubMed
    1. Mansinho A, Macedo D, Fernandes I, Costa L. Castration-resistant prostate cancer: mechanisms, targets and treatment. Adv Exp Med Biol. 2018;1096:117–33. 10.1007/978-3-319-99286-0_7 - DOI - PubMed
    1. Rawla P. Epidemiology of prostate cancer. World J Oncol. 2019;10:63–89. 10.14740/wjon1191 - DOI - PMC - PubMed
    1. Ryan CJ, Tindall DJ. Androgen receptor rediscovered: the new biology and targeting the androgen receptor therapeutically. J Clin Oncol. 2011;29:3651–8. 10.1200/JCO.2011.35.2005 - DOI - PubMed
    1. Vellky JE, Ricke WA. Development and prevalence of castration-resistant prostate cancer subtypes. Neoplasia. 2020;22:566–75. 10.1016/j.neo.2020.09.002 - DOI - PMC - PubMed

LinkOut - more resources