. 2024 Sep;15(27):1929-1945.
doi: 10.1111/1759-7714.15396. Epub 2024 Aug 7.

Novel circular RNA hsa_circ_0036683 suppresses proliferation and migration by mediating the miR-4664-3p/CDK2AP2 axis in non-small cell lung cancer

Affiliations

Novel circular RNA hsa_circ_0036683 suppresses proliferation and migration by mediating the miR-4664-3p/CDK2AP2 axis in non-small cell lung cancer

Rui Liu et al. Thorac Cancer. 2024 Sep.

Abstract

Background: The aim of the present study was to investigate the function of novel circular RNA hsa_circ_0036683 (circ-36683) in non-small cell lung cancer (NSCLC).

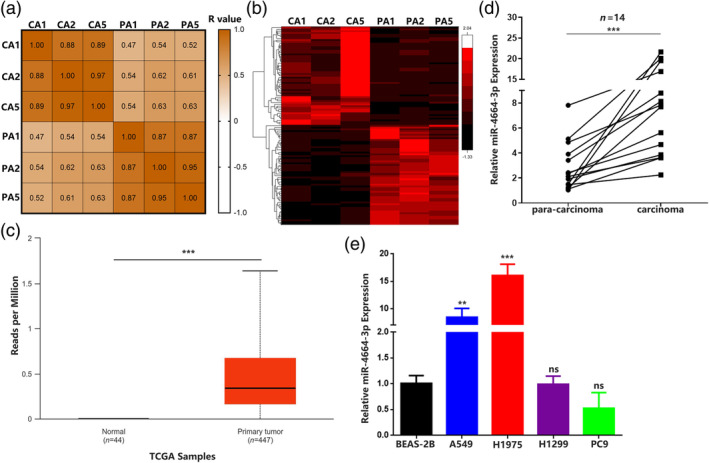
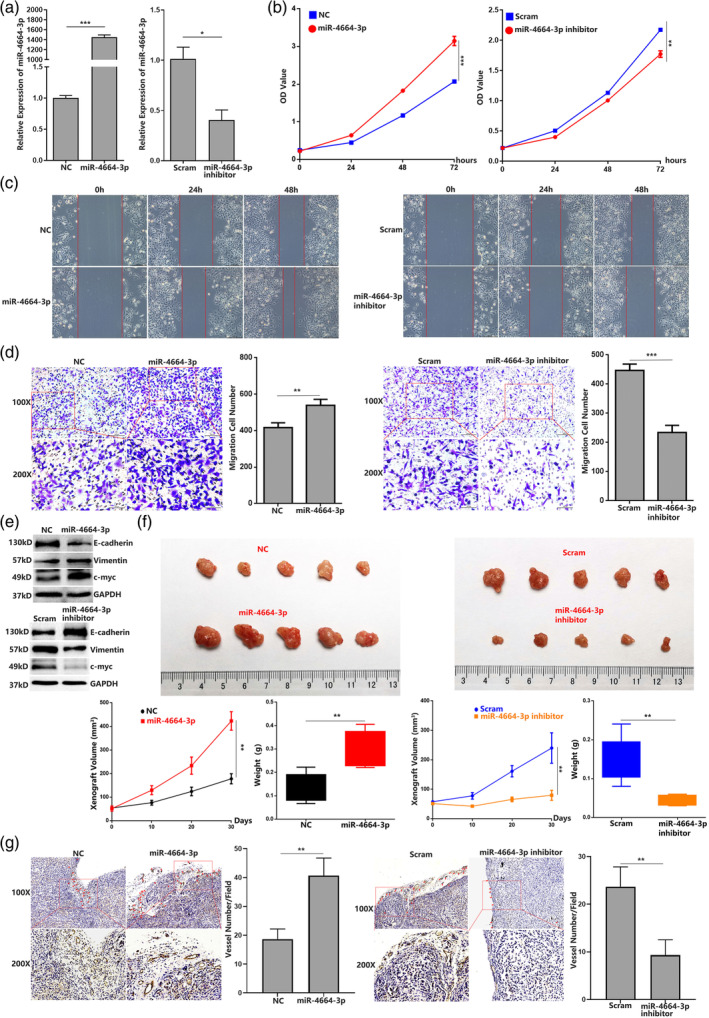
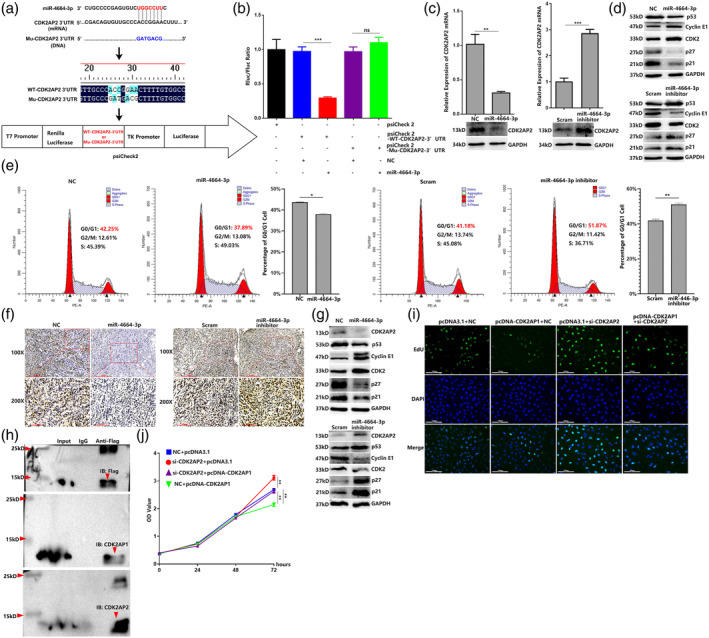
Methods: RNA sequencing was used to screen out differentially expressed miRNAs. Expression levels of miR-4664-3p and circ-36683 were evaluated in lung carcinoma cells and tissues by quantitative reverse transcription-polymerase chain reaction (qRT-PCR). The effects of miR-4664-3p and circ-36683 on proliferation and migration were assessed using cell counting kit-8 (CCK-8), wound healing and transwell migration assays and xenograft experiments. The targeting relationship of circ-36683/miR-4664-3p/CDK2AP2 was assessed by luciferase reporter assays, western blot, qRT-PCR and argonaute2-RNA immunoprecipitation (AGO2 RIP). Co-immunoprecipitation (Co-IP), 5-ethynyl-2'-deoxyuridine (EdU) staining and CCK-8 were used to validate the indispensable role of CDK2AP2 in suppressing cell proliferation as a result of CDK2AP1 overexpression.

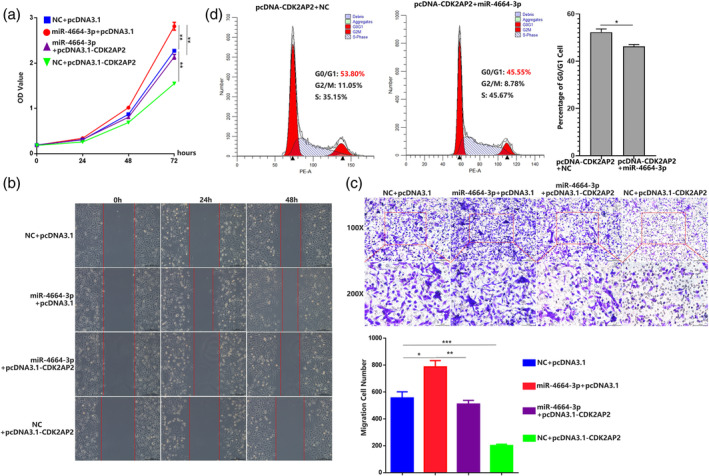
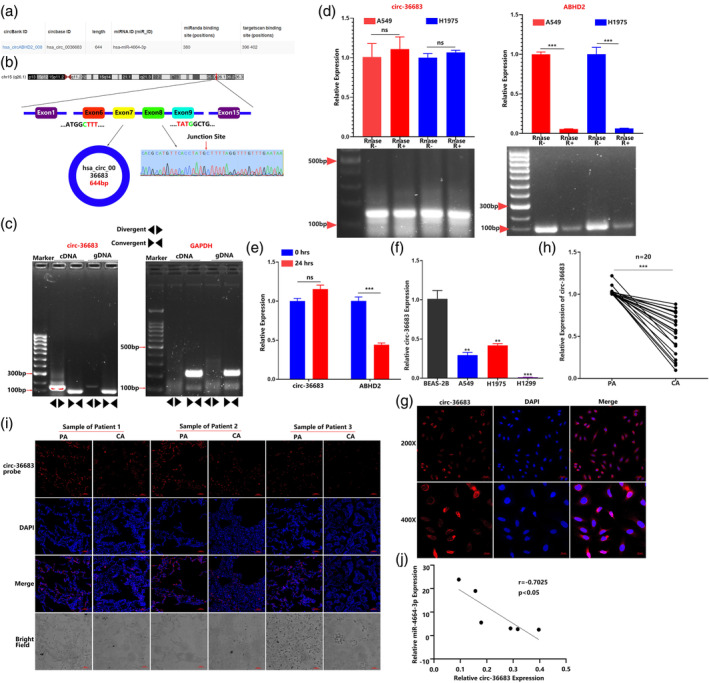
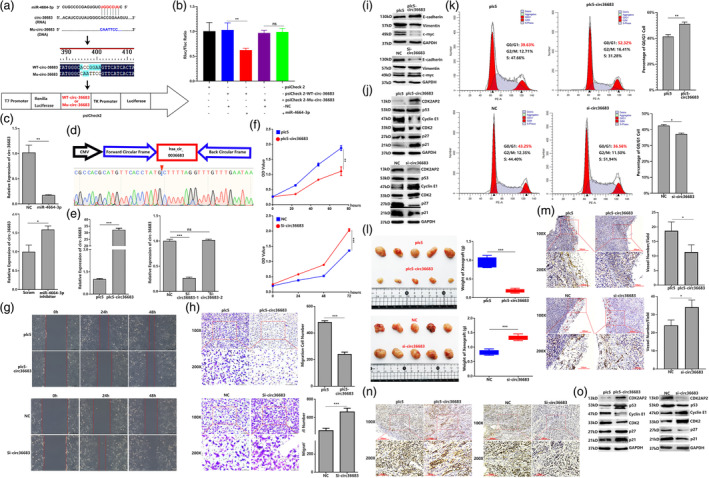
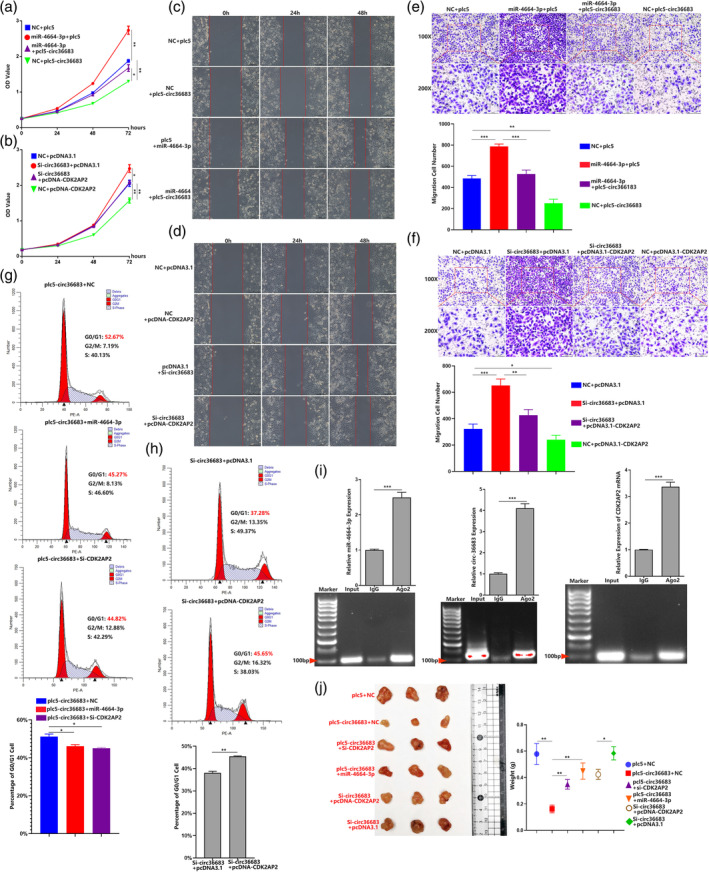
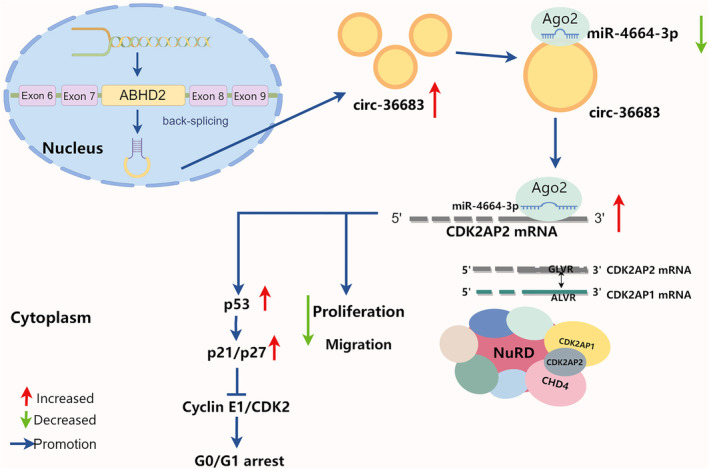
Results: By RNA sequencing, miR-4664-3p was screened out as an abnormally elevated miRNA in NSCLC tissues. Transfection of miR-4664-3p could promote cell proliferation, migration and xenograft tumor growth. As a target of miR-4664-3p, CDK2AP2 expression was downregulated by miR-4664-3p transfection and CDK2AP2 overexpression could abolish the proliferation promotion resulting from miR-4664-3p elevation. Circ-36683, derived from back splicing of ABHD2 pre-mRNA, was attenuated in NSCLC tissue and identified as a sponge of miR-4664-3p. The functional study revealed that circ-36683 overexpression suppressed cell proliferation, migration and resulted in G0/G1 phase arrest. More importantly, the antioncogenic function of circ-36683 was largely dependent on the miR-4664-3p/CDK2AP2 axis, through which circ-36683 could upregulate the expression of p53/p21/p27 and downregulate the expression of CDK2/cyclin E1.

Conclusion: The present study revealed the antioncogenic role of circ-36683 in suppressing cell proliferation and migration and highlighted that targeting the circ-36683/miR-4664-3p/CDK2AP2 axis is a promising strategy for the intervention of NSCLC.

Keywords: CDK2AP2; NSCLC; cell cycle; hsa_circ_0036683; miR‐4664‐3p.


Conflict of interest statement

The authors declare that they have no conflicts of interest concerning this article.

Figures

FIGURE 1
FIGURE 1
Hsa_miR_4664‐3p levels are significantly upregulated in non‐small cell lung cancer (NSCLC) tissue and cell lines. (a) Pearson's correlation matrix of microRNA expression in three NSCLC tissues and paired normal tissues. (b) MicroRNA expression differential analysis in three NSCLC tissues and paired normal tissues by RNA sequencing. (c) Relative expression of miR‐4664‐3p in 447 lung adenocarcinoma tissues and 44 normal tissues from TCGA. (d) Quantitative reverse transcription‐polymerase chain reaction (qRT‐PCR) analysis of miR‐4664‐3p levels in NSCLC tissues and corresponding paracarcinoma tissues (n = 14). Data are expressed as median (interquartile range); Mann–Whitney U test. (e) qRT‐PCR analysis of miR‐4664‐3p levels in A549, H1975, H1299, PC9, and BEAS‐2B cells; analysis of variance (ANOVA) test. Data are expressed as mean ± SD for triplicate experiments, ***p < 0.001, **p < 0.01.
FIGURE 2
FIGURE 2
MiR‐4664‐3p can not only promote the proliferation and migration in vitro but also facilitate tumor growth and angiogenesis in the xenograft. (a) Quantitative reverse transcription‐polymerase chain reaction (qRT‐PCR) analysis of miR‐4664‐3p level in A549 cells with transfection of miR‐4664‐3p mimic, miR‐4664‐3p inhibitor or scrambled; student's t‐test. (b) Cell counting kit‐8 (CCK‐8) assay of A549 in 72 h post‐transfection of miR‐4664‐3p mimic, miR‐4664‐3p inhibitor, or scrambled; analysis of variance (ANOVA) test. (c) Wound‐healing assay of A549 in 48 h post‐transfection of miR‐4664‐3p mimic, miR‐4664‐3p inhibitor or scrambled. (d) Transwell migration assay of A549 at 24 h post‐transfection of miR‐4664‐3p mimic, miR‐4664‐3p inhibitor or scrambled; student's t‐test. (e) Western blot detection of proliferation and migration related factors (proliferating cell nuclear antigen [PCNA], E‐cadherin, and vimentin) in miR‐4664‐3p mimic, miR‐4664‐3p inhibitor, or scrambled‐treated A549 cells. (f) Images of the xenograft formed by A549 cells treated by miR‐4664‐3p, miR‐4664‐3p inhibitor, or scramble, quantitative analysis of xenograft volume growth and tumor weight. (g) Neovascularization analysis by CD31 immunohistochemical staining in the xenograft, quantifying blood vessels on one field from each xenograft; student's t‐test. Data are expressed as mean ± SD for triplicated fields, ***p < 0.001, **p < 0.01.
FIGURE 3
FIGURE 3
MiR‐4664‐3p can promote the cell cycle and target‐downregulate CDK2AP2 expression, which is an essential component for CDK2AP1 function. (a) TargetScan analysis predicted that the CDK2AP2 mRNA‐3′‐UTR is targeted by miR‐4664‐3p. CDK2AP2 mRNA 3′‐UTR or mutated CDK2AP2 mRNA 3′‐UTR was cloned into psiCHECK2. (b) Dual‐luciferase gene reporter assay of miRNA cotransfection with psiCHECK2 containing CDK2AP2 mRNA 3′‐UTR or mutated CDK2AP2 mRNA 3′‐UTR; analysis of variance (ANOVA) test. (c) Quantitative reverse transcription‐polymerase chain reaction (qRT‐PCR) and western blot detection of CDK2AP2 in miR‐4664‐3p, miR‐4664‐3p inhibitor, or scramble‐treated A549 cells. (d) Western blot detection of the p53/p21/p27/CDK2/cyclin E1 axis in miR‐4664‐3p, miR‐4664‐3p inhibitor, or scramble‐treated A549 cells. (e) Cell cycle analyzed by flow cytometry in miR‐4664‐3p mimic, miR‐4664‐3p inhibitor, or scrambled‐treated A549 cells; student's t‐test. (f) CDK2AP2 expression in xenografts analyzed by immunohistochemistry (IHC). (g) Western blot detection of the CDK2AP2/p53/p21/p27/CDK2/cyclin E1 axis in xenografts. (h) Co‐immunoprecipitation (Co‐IP) assay detecting the interaction between CDK2AP2 and CDK2AP1 in Flag‐pcDNA‐CDK2AP1 transfected cells. (i) 5‐ethynyl‐2′‐deoxyuridine (EdU) assay of A549 cells with cotransfection of pcDNA3.1 + NC, pcDNA‐CDK2AP1 + NC, pcDNA3.1 + si‐CDK2AP2 or pcDNA‐CDK2AP1+ si‐CDK2AP2. (j) Cell counting kit‐8 (CCK‐8) assay of A549 in 72 h post‐transfection of pcDNA3.1 + NC, pcDNA‐CDK2AP1 + NC, pcDNA3.1 + si‐CDK2AP2 or pcDNA‐CDK2AP1+ si‐CDK2AP2; analysis of variance (ANOVA) test. Data are expressed as mean ± SD for triplicate experiments. ***p < 0.001, **p < 0.01, *p < 0.05.
FIGURE 4
FIGURE 4
Overexpression of CDK2AP2 abrogates the oncogenic function of miR‐4664‐3p. (a) Cell counting kit‐8 (CCK‐8) assay of A549 in 72 h post‐transfection of NC+ pcDNA3.1, miR‐4664‐3p + pcDNA3.1, miR‐4664‐3p + pcDNA‐CDK2AP2 or NC + pcDNA‐CDK2AP2; analysis of variance (ANOVA) test. (b) Wound‐healing assay of A549 in 48 h post‐transfection of NC+ pcDNA3.1, miR‐4664‐3p + pcDNA3.1, miR‐4664‐3p + pcDNA‐CDK2AP2 or NC + pcDNA‐CDK2AP2. (c) Transwell migration assay of A549 at 24 h post‐transfection of NC+ pcDNA3.1, miR‐4664‐3p + pcDNA3.1, miR‐4664‐3p + pcDNA‐CDK2AP2 or NC + pcDNA‐CDK2AP2; ANOVA test. (d) Cell cycle analyzed by flow cytometry in A549 cells with cotransfection of NC + pcDNA‐CDK2AP2 or miR‐4664‐3p + pcDNA‐CDK2AP2; student's t‐test. Data are expressed as mean ± SD for triplicate experiments, ***p < 0.001, **p < 0.01, *p < 0.05.
FIGURE 5
FIGURE 5
Identification and clinical characterization of hsa_circ_0036683. (a) A circBank analysis predicted that circ‐36683 has potential binding site of miR‐4664‐3p. (b) Schematic illustration of the genomic location and back splicing of circ‐36683. The presence of circ‐36683 was validated by quantitative reverse transcription‐polymerase chain reaction (qRT‐PCR) followed by Sanger sequencing. (c) The circular characteristic of circ‐36683 was detected by qRT‐PCR using divergent and convergent primers in cDNA and gDNA followed by agarose gel electrophoresis. (d) RNase R assay was used to evaluate the stability of circ‐36683 and ABHD2 mRNA in A549 and H1975 cells; student's t‐test. (e) Actinomycin D assay was used to evaluate the existence of circ‐36683 and ABHD2 mRNA in A549 cells in 24 h; student's t‐test. (f) qRT‐PCR analysis of circ‐36683 levels in A549, H1975, H1299, and BEAS‐2B cells; analysis of variance (ANOVA) test. (g) The subcellular localization of circ‐36683 in A549 cells performed with fluorescence in situ hybridization (FISH). Nuclei was stained blue (4′,6‐diamidino‐2‐phenylindole [DAPI]) and circ‐36683 was stained red (Cy3). Scale bar = 50 μm. (h) qRT‐PCR analysis of circ‐36683 levels in NSCLC tissues and corresponding paracarcinoma tissues (n = 20). Data are expressed as median (interquartile range); Mann–Whitney U test. (i) FISH analysis of circ‐36683 level in three NSCLC tissues and the corresponding paracarcinoma tissues. CA, carcinoma; PA, paracarcinoma. Scale bar = 50 μm. (j) Pearson's correlation analysis of circ‐36683 expression and miR‐4664‐3p expression (n = 6). Data are expressed as mean ± SD for triplicate experiments. ***p < 0.001, **p < 0.01, *p < 0.05.
FIGURE 6
FIGURE 6
Circ‐36683 functions as a sponge for miR‐4664‐3p and inhibits proliferation and migration of lung carcinoma cells. (a) Sequence of circ‐36683 or mutant sequence of circ‐36683 were cloned into psiCHECK2 to construct dual‐luciferase gene reporters. (b) Dual‐luciferase gene reporter assay of miRNAs cotransfection with psiCHECK2 containing sequence of circ‐36683 or mutated circ‐36683 sequence; analysis of variance (ANOVA) test. (c) Quantitative reverse transcription‐polymerase chain reaction (qRT‐PCR) analysis of circ‐36683 level in miR‐4664‐3p, miR‐4664‐3p inhibitor, or scramble‐treated A549 cells; student's t‐test. (d) plc5‐circ36683 is constructed by cloning liner sequence of circ‐36683 into PLC5‐cir. The product of plc5‐circ36683 is validated by Sanger sequencing. (e) qRT‐PCR analysis of circ‐36683 level in A549 cells with transfection of plc5‐circ36683, si‐circ36683‐1, si‐circ‐36683‐2 or corresponding controls; student's t‐test. (f) Cell counting kit‐8 (CCK‐8) assay of A549 in 72 h post‐transfection of plc5‐circ36683, si‐circ36683 or corresponding controls; analysis of variance (ANOVA) test. (g) Wound‐healing assay of A549 in 48 h post‐transfection of plc5‐circ36683, si‐circ36683 or corresponding controls. (h) Transwell migration assay of A549 at 24 h post‐transfection of plc5‐circ36683, si‐circ36683 or corresponding controls; student's t‐test. (i) Western blot detection of proliferation and migration related factors (c‐myc, E‐cadherin, and vimentin) in A549 cells transfected with plc5‐circ36683, si‐circ36683 or corresponding controls. (j) Western blot detection of the CDK2AP2/p53/p21/p27/CDK2/cyclin E1 axis in A549 cells transfected with plc5‐circ36683, si‐circ36683 or corresponding controls. (k) Cell cycle analyzed by flow cytometry in A549 cells with transfection of NC + pcDNA‐CDK2AP2 or miR‐4664‐3p + pcDNA‐CDK2AP2; student's t‐test. (l) Images of the xenograft formed by A549 cells transfected with plc5‐circ36683, si‐circ36683 or corresponding controls, quantitative analysis of xenograft tumor weight. (m) Neovascularization analysis by CD31 immunohistochemical staining in the xenograft, quantifying blood vessels on one field from each xenograft; student's t‐test. (n) CDK2AP2 expression in xenografts analyzed by immunohistochemistry (IHC). (o) Western blot detection of the CDK2AP2/p53/p21/p27/CDK2/cyclin E1 axis in xenografts. Data are expressed as mean ± SD for triplicate experiments, ***p < 0.001, **p < 0.01, *p < 0.05.
FIGURE 7
FIGURE 7
The antioncogenic function of circ‐36683 depends on targeting the miR‐4664‐3p/CDK2AP2 axis. (a) Cell counting kit‐8 (CCK‐8) assay of A549 in 72 h post‐transfection of NC + plc5, miR‐4664‐3p + plc5, miR‐4664‐3p + plc5‐circ36683 or NC + plc5‐circ36683 (b); CCK‐8 assay of A549 in 72 h post‐transfection of NC + pcDNA3.1, Si‐circ36683 + pcDNA3.1, Si‐circ36683 + pcDNA‐CDK2AP2 or NC + pcDNA‐CDK2AP2 (b); analysis of variance (ANOVA) test. (c) and (d) Wound‐healing assay of A549 in 48 h post‐transfection of NC + plc5, miR‐4664‐3p + plc5, miR‐4664‐3p + plc5‐circ36683 or NC + plc5‐circ36683 (c), wound‐healing assay of A549 in 48 h post‐transfection of NC + pcDNA3.1, Si‐circ36683 + pcDNA3.1, Si‐circ36683 + pcDNA‐CDK2AP2 or NC + pcDNA‐CDK2AP2 (d). (e) and (f) Transwell migration assay of A549 at 24 h post‐transfection of NC + plc5, miR‐4664‐3p + plc5, miR‐4664‐3p + plc5‐circ36683 or NC + plc5‐circ36683 (e); transwell migration assay of A549 at 24 h post‐transfection of NC + pcDNA3.1, Si‐circ36683 + pcDNA3.1, Si‐circ36683 + pcDNA‐CDK2AP2 or NC + pcDNA‐CDK2AP2 (f); ANOVA test. (g) Cell cycle analyzed by flow cytometry in A549 cells with transfection of plc5‐circ36683 + NC, plc5‐circ36683 + miR‐4664‐3p, or plc5‐circ36683 + Si‐CDK2AP2; ANOVA test. (h) Cell cycle analyzed by flow cytometry in A549 cells with transfection of Si‐circ36683 + pcDNA3.1 or Si‐circ36683 + pcDNA‐circ36683; student's t‐test. (i) Anti‐argonaute2‐RNA immunoprecipitation (AGO2 RIP) in miR‐4664‐3p treated A549 cells is performed to detect RNA enrichment in immunoprecipitation (IP) complexes followed by quantitative reverse transcription‐polymerase chain reaction (qRT‐PCR) analysis. Anti‐IgG was used as a negative control; student's t‐test. (j) Images of the xenograft formed by A549 cells transfected with plc5 + NC, plc5‐circ36683 + NC, plc5‐circ36683 + miR‐4664‐3p, plc5‐circ36683 + Si‐CDK2AP2, Si‐circ36683 + pcDNA3.1 or Si‐circ36683 + pcDNA‐circ36683; quantitative analysis of xenograft tumor weight. Data are expressed as mean ± SD for triplicate experiments. ***p < 0.001, **p < 0.01, *p < 0.05.
FIGURE 8
FIGURE 8
Schematic illustration of the tumor‐suppressing mechanisms of circ‐36683 in non‐small cell lung cancer (NSCLC).

References

    1. Malvezzi M, Santucci C, Boffetta P, Collatuzzo G, Levi F, La Vecchia C, et al. European cancer mortality predictions for the year 2023 with focus on lung cancer. Ann Oncol. 2023;34:410–419. - PubMed
    1. Siegel RL, Giaquinto AN, Jemal A. Cancer statistics, 2024. CA Cancer J Clin. 2024;74:12–49. - PubMed
    1. Ettinger DS, Wood DE, Aisner DL, Akerley W, Bauman JR, Bharat A, et al. Non‐small cell lung cancer, version 3.2022, nccn clinical practice guidelines in oncology. J Natl Compr Canc Netw. 2022;20:497–530. - PubMed
    1. Nutzinger J, Bum Lee J, Li Low J, Ling Chia P, Talisa Wijaya S, Chul Cho B, et al. Management of her2 alterations in non‐small cell lung cancer: the past, present, and future. Lung Cancer. 2023;186:107385. - PubMed
    1. Sequist LV, Bell DW, Lynch TJ, Haber DA. Molecular predictors of response to epidermal growth factor receptor antagonists in non‐small‐cell lung cancer. J Clin Oncol. 2007;25:587–595. - PubMed

Publication types

MeSH terms