. 2024 Oct;15(5):1976-1988.
doi: 10.1002/jcsm.13546. Epub 2024 Aug 7.

Different outcomes of endurance and resistance exercise in skeletal muscles of Oculopharyngeal muscular dystrophy

Affiliations

Different outcomes of endurance and resistance exercise in skeletal muscles of Oculopharyngeal muscular dystrophy

Alexis Boulinguiez et al. J Cachexia Sarcopenia Muscle. 2024 Oct.

Abstract

Background: Exercise is widely considered to have beneficial impact on skeletal muscle aging. In addition, there are also several studies demonstrating a positive effect of exercise on muscular dystrophies. Oculopharyngeal muscular dystrophy (OPMD) is a late-onset autosomal dominant inherited neuromuscular disorder caused by mutations in the PAPBN1 gene. These mutations consist in short (1-8) and meiotically stable GCN trinucleotide repeat expansions in its coding region responsible for the formation of PAPBN1 intranuclear aggregates. This study aims to characterize the effects of two types of chronic exercise, resistance and endurance, on the OPMD skeletal muscle phenotype using a relevant murine model of OPMD.

Methods: In this study, we tested two protocols of exercise. In the first, based on endurance exercise, FvB (wild-type) and A17 (OPMD) mice underwent a 6-week-long motorized treadmill protocol consisting in three sessions per week of running 20 cm/s for 20 min. In the second protocol, based on resistance exercise generated by chronic mechanical overload (OVL), surgical removal of gastrocnemius and soleus muscles was performed, inducing hypertrophy of the plantaris muscle. In both types of exercise, muscles of A17 and FvB mice were compared with those of respective sedentary mice. For all the groups, force measurement, muscle histology, and molecular analyses were conducted.

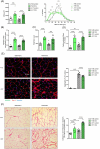
Results: Following the endurance exercise protocol, we did not observe any major changes in the muscle physiological parameters, but an increase in the number of PABPN1 intranuclear aggregates in both tibialis anterior (+24%, **P = 0.0026) and gastrocnemius (+18%, ****P < 0.0001) as well as enhanced collagen deposition (+20%, **P = 0.0064 in the tibialis anterior; +35%, **P = 0.0042 in the gastrocnemius) in the exercised A17 OPMD mice. In the supraphysiological resistance overload protocol, we also observed an increased collagen deposition (×2, ****P < 0.0001) in the plantaris muscle of A17 OPMD mice which was associated with larger muscle mass (×2, ****P < 0.0001) and fibre cross sectional area (×2, ***P = 0.0007) and increased absolute maximal force (×2, ****P < 0.0001) as well as a reduction in PABPN1 aggregate number (-16%, ****P < 0.0001).

Conclusions: Running exercise and mechanical overload led to very different outcome in skeletal muscles of A17 mice. Both types of exercise enhanced collagen deposition but while the running protocol increased aggregates, the OVL reduced them. More importantly OVL reversed muscle atrophy and maximal force in the A17 mice. Our study performed in a relevant model gives an indication of the effect of different types of exercise on OPMD muscle which should be further evaluated in humans for future recommendations as a part of the lifestyle of individuals with OPMD.

Keywords: Atrophy; Exercise; Fibrosis; OPMD; PAPBN1; Skeletal muscle.


Conflict of interest statement

The authors declare no competing interests.

Figures
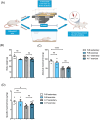
Figure 1
Figure 1
Treadmill running does not improve TA muscle physiology in OPMD mouse. (A) Schematic representation of treadmill protocol. (B) Final body mass (in grams, g) from sedentary or treadmill exercised FvB and A17 mice, n = 4–10 mice/group. Absolute maximal force (C) (i.e., raw data without normalization) and specific force (D) (i.e., absolute maximal force (expressed in g) normalized to tibialis anterior (TA) muscle mass (in mg)) of TA muscles from sedentary or treadmill exercised FvB and A17 mice, n = 4–10 mice/group. Data presented are the mean of the two legs. ANOVA two‐ways followed by post‐hoc Sidak multiple comparisons test, ns not significant, *P < 0.05, ****P < 0.0001. Figure 1A is created with BioRender.com.
Figure 2
Figure 2
Treadmill running does not improve OPMD muscle atrophy but increases PABPN1 nuclear aggregates in OPMD TA muscle. (A) Representative pictures of immunofluorescence staining of tibialis anterior (TA) muscle sections from sedentary or treadmill exercised FvB and A17 mice with dystrophin‐1 staining (red) and nucleus (Hoechst, blue), magnification 20×. (B) Cross‐sectional area (CSA) (in μm2) of TA muscles fibres from sedentary or treadmill exercised FvB and A17 mice, n = 4–8 mice/group. (C) Percentage of muscle fibre according to their cross‐sectional area (CSA), from TA of sedentary or treadmill exercised FvB and A17 mice, n = 4–8 mice/group, ANOVA two‐ways followed by post‐hoc Tukey multiple comparisons test, ***P < 0.001, ****P < 0.0001 between FvB sedentary and A17 sedentary groups. (D) TA muscle mass (in mg) normalized to body mass (in g) from sedentary or treadmill exercised FvB and A17 mice, n = 4–10 mice/group. Data presented are the mean of the two legs. (E) Representative pictures of immunofluorescence staining of tibialis anterior (TA) muscle sections from sedentary or treadmill exercised FvB and A17 mice with dystrophin1 (Dys1, red), PABPN1 (green) and nucleus (Hoechst, blue), magnification 20× and percentage of myonuclei containing a PABPN1 positive aggregate in TA muscle from sedentary or treadmill exercised FvB and A17 mice, n = 3–9 mice/group. (F) Representative western‐blot of PABPN1 protein amount in TA muscles from sedentary or treadmill exercised FvB and A17 mice, GAPDH is used as loading control, n = 3–5 mice/group. Densitometric analysis of western‐blot bands was performed and PABPN1 expression was normalized to GAPDH. For panels (C)–(F), ANOVA two‐ways followed by post‐hoc Sidak multiple comparisons test, ns not significant, **P < 0.01, ***P < 0.001, ****P < 0.0001.
Figure 3
Figure 3
Treadmill training increases collagen deposition in OPMD TA muscle. (A) Representative pictures of Sirius red staining of tibialis anterior (TA) muscle sections from sedentary or treadmill exercised FvB and A17 mice, objective 20×. (B) Percentage of Sirius red positive area in TA muscle from sedentary or treadmill exercised FvB and A17 mice, n = 3–9 mice/group, ANOVA two‐ways followed by post‐hoc Sidak multiple comparisons test. ns, not significant, *P < 0.05, **P<0.01.
Figure 4
Figure 4
Mechanical overload shows beneficial effects in OPMD plantaris muscle function. (A) Schematic representation of the overload protocol. Absolute maximal (B) and specific (C) maximal force of plantaris muscle from control or overload (OVL) FvB and A17 mice, n = 10–12 muscles/group. (D) Fatigue resistance (time to lose 30% of the initial force, in sec) of plantaris muscle from control or OVL FvB and A17 mice, n = 8–20 muscles/group. For panels (B)–(D), (G), ANOVA two‐ways followed by post‐hoc Sidak multiple comparisons test. ns, not significant, *P < 0.05, **P < 0.01, ***P < 0.001, ****P < 0.0001. Figure 4A was created with BioRender.com.
Figure 5
Figure 5
Mechanical overload shows beneficial effects in OPMD plantaris muscle histology. (A) Cross‐sectional area (CSA) of plantaris muscles from control or OVL FvB and A17 mice, n = 9–10 muscles/group and percentage of muscle fibres according to their cross‐sectional area (CSA), from plantaris muscles of control or overload FvB and A17 mice, n = 10–12 muscles/group, ANOVA two‐ways followed by post‐hoc Tukey multiple comparisons test, no differences between FvB control and A17 control groups, +P < 0.05, ++++P < 0.0001 between A17 control and A17 OVL groups, °P < 0.05, °°P < 0.01, °°°P < 0.001, °°°°P < 0.0001 between Fvb control and Fvb OVL groups. (B) Plantaris muscle mass (in mg) normalized to body mass (in g) from control or OVL FvB and A17 mice, n = 10–14 muscles/group. (C) Total fibre count in plantaris muscle cross‐section from control or OVL FvB and A17 mice, n = 10–14 muscles/group. (D) Percentage of centro‐nucleated fibres in plantaris muscles from control or OVL FvB and A17 mice, n = 9–11 muscles/group. (E) Representative pictures of immunofluorescence staining of plantaris muscle sections from control or overload FvB and A17 mice with dystrophin1 (red), PABPN1 (green) and nucleus (Hoechst, blue), objective 40× and percentage of myonuclei containing a PABPN1 positive aggregate in plantaris muscle from control or OVL FvB and A17 mice, n = 10–11 muscles/group. (F) Representative pictures of Sirius red staining of plantaris muscle sections from control or overload FvB and A17 mice, objective 40× and percentage of Sirius red positive area in plantaris muscle from control or OVL FvB and A17 mice, n = 11–12 muscles/group. For all panels, ANOVA two‐ways followed by post‐hoc Sidak multiple comparisons test, **P < 0.01, ***P < 0.001, ****P < 0.0001.

References

    1. Brais B, Bouchard J‐P, Xie Y‐G, Rochefort DL, Chrétien N, Tomé FMS, et al. Short GCG expansions in the PABP2 gene cause oculopharyngeal muscular dystrophy. Nat Genet 1998;18:164–167. - PubMed
    1. Tomé FM, Fardeau M. Nuclear inclusions in oculopharyngeal dystrophy. Acta Neuropathol 1980;49:85–87. - PubMed
    1. Roth F, Dhiab J, Boulinguiez A, Mouigni H‐R, Lassche S, Negroni E, et al. Assessment of PABPN1 nuclear inclusions on a large cohort of patients and in a human xenograft model of oculopharyngeal muscular dystrophy. Acta Neuropathol 2022;144:1157–1170. - PMC - PubMed
    1. Brett JO, Arjona M, Ikeda M, Quarta M, de Morrée A, Egner IM, et al. Exercise rejuvenates quiescent skeletal muscle stem cells in old mice through restoration of Cyclin D1. Nat Metab 2020;2:307–317. - PMC - PubMed
    1. DiPietro L, Dziura J, Yeckel CW, Neufer PD. Exercise and improved insulin sensitivity in older women: Evidence of the enduring benefits of higher intensity training. J Appl Physiol 2006;100:142–149. - PubMed

LinkOut - more resources