. 2024 Oct 2;32(10):3470-3484.
doi: 10.1016/j.ymthe.2024.08.002. Epub 2024 Aug 8.

T-cell specific in vivo gene delivery with DART-AAVs targeted to CD8

Affiliations

T-cell specific in vivo gene delivery with DART-AAVs targeted to CD8

Muhammed Burak Demircan et al. Mol Ther. .

Abstract

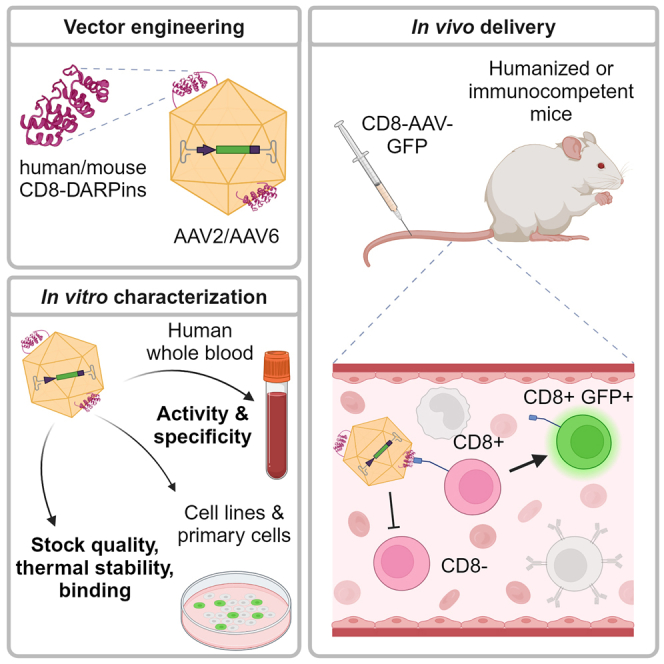
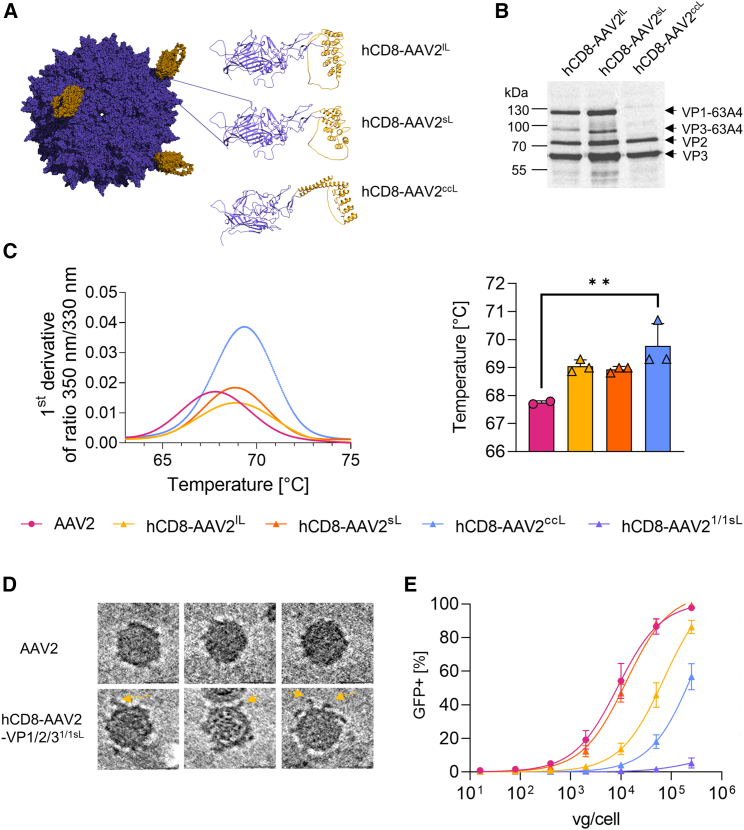
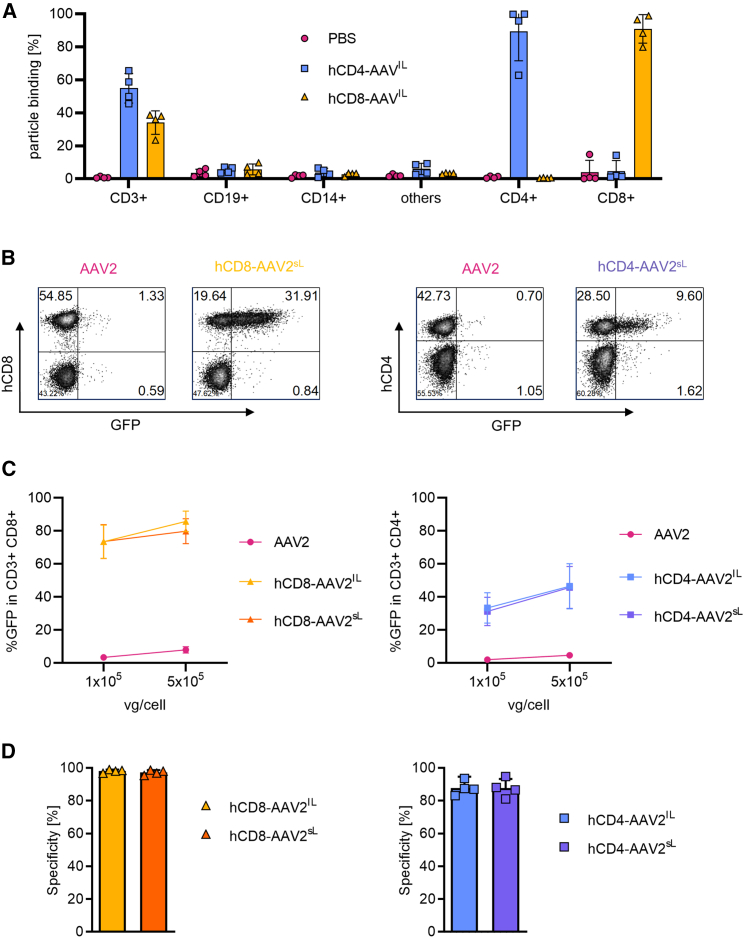
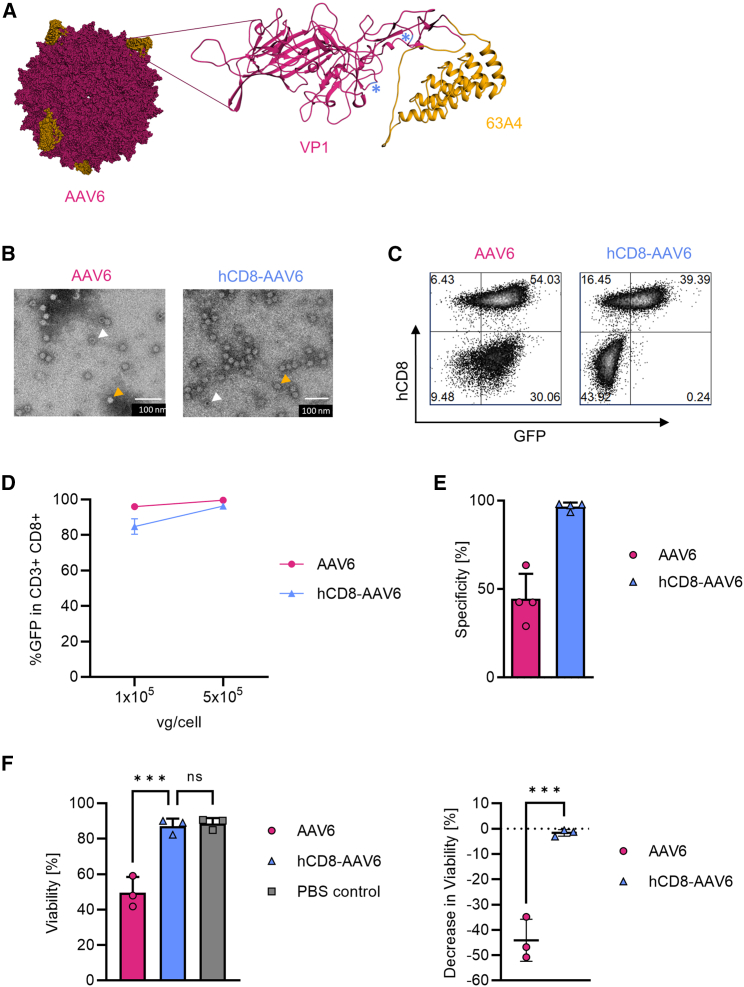
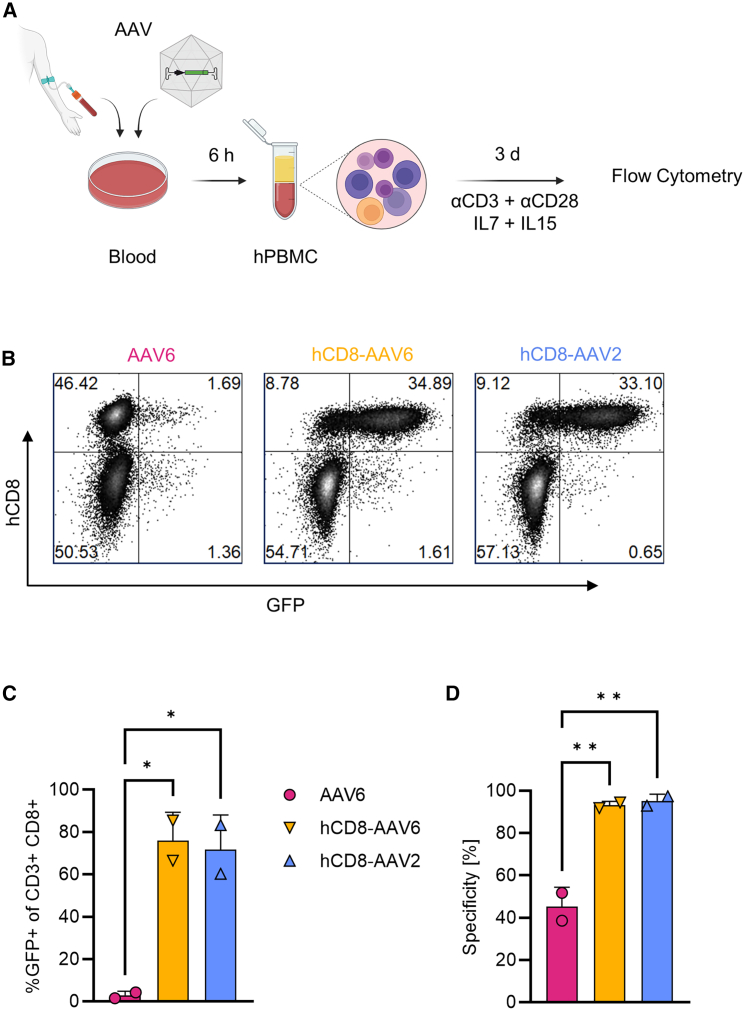
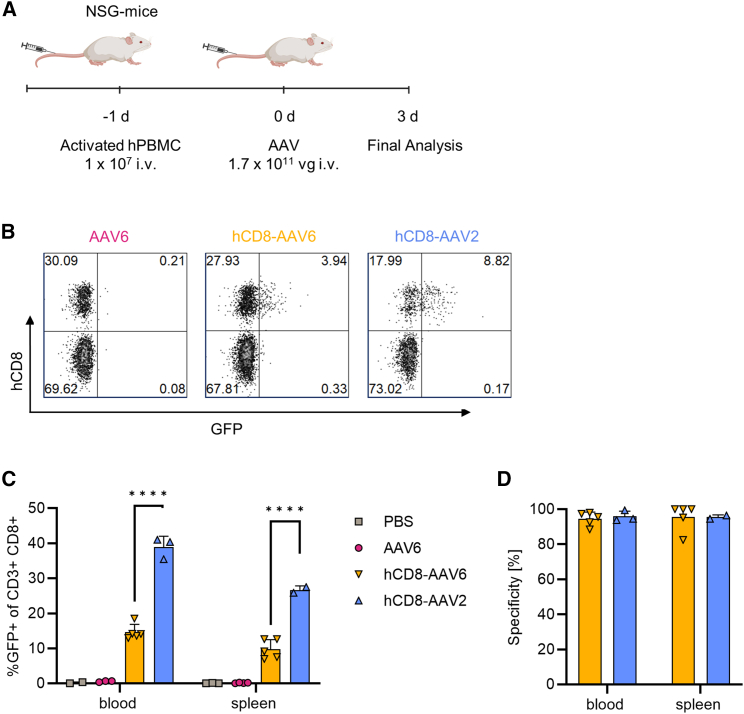
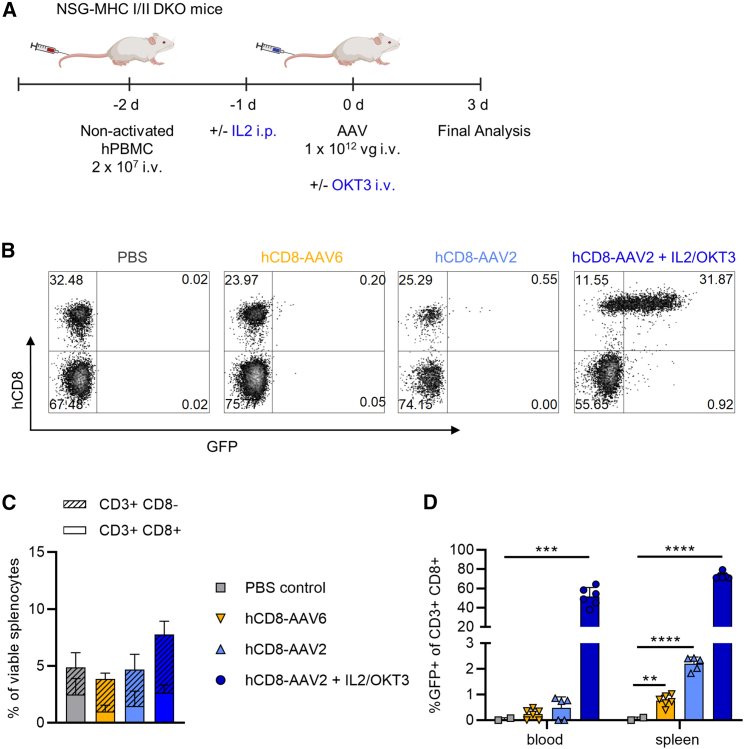
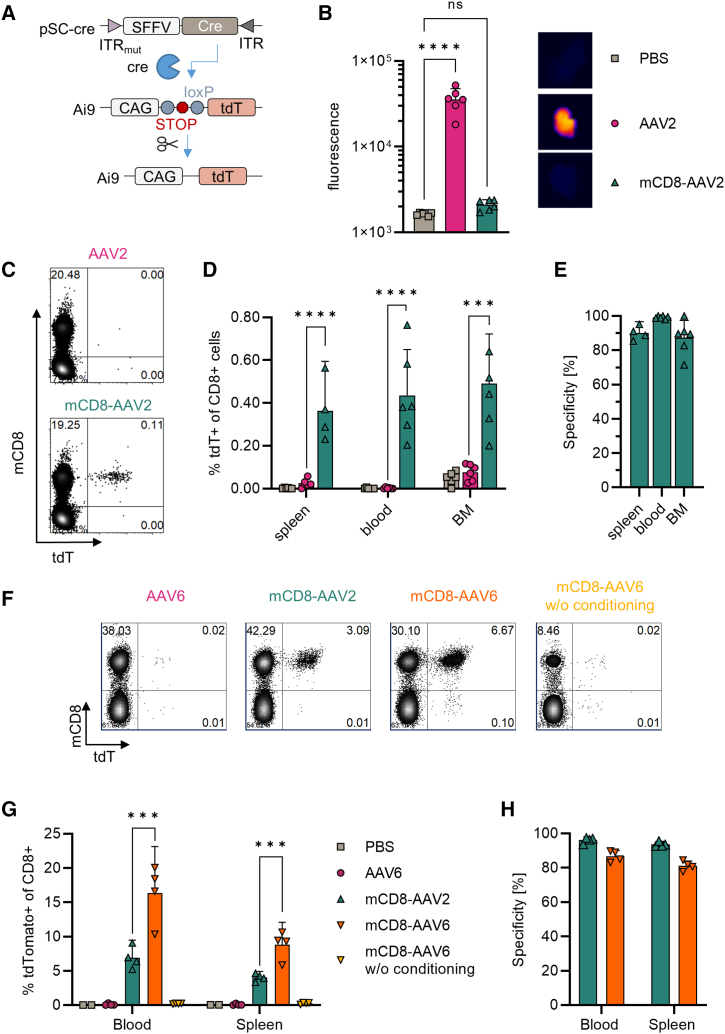
One of the biggest challenges for in vivo gene therapy are vectors mediating highly selective gene transfer into a defined population of therapy-relevant cells. Here we present DARPin-targeted AAVs (DART-AAVs) displaying DARPins specific for human and murine CD8. Insertion of DARPins into the GH2/GH3 loop of the capsid protein 1 (VP1) of AAV2 and AAV6 resulted in high selectivity for CD8-positive T cells with unimpaired gene delivery activity. Remarkably, the capsid core structure was unaltered with protruding DARPins detectable. In complex primary cell mixtures, including donor blood or systemic injections into mice, the CD8-targeted AAVs were by far superior to unmodified AAV2 and AAV6 in terms of selectivity, target cell viability, and gene transfer rates. In vivo, up to 80% of activated CD8+ T cells were hit upon a single vector injection into conditioned humanized or immunocompetent mice. While gene transfer rates decreased significantly under non-activated conditions, genomic modification selectively in CD8+ T cells was still detectable upon Cre delivery into indicator mice. In both mouse models, selectivity for CD8+ T cells was close to absolute with exceptional detargeting from liver. The CD8-AAVs described here expand strategies for immunological research and in vivo gene therapy options.

Keywords: AAV capsid engineering; CD8 targeting; CD8-AAV; DART-AAVs; T cell activation; T cell targeting; gene therapy; in vivo delivery; in vivo gene therapy; receptor targeting; targeted AAV; targeted gene therapy; viral vectors.


Conflict of interest statement

Declaration of interests The authors declare no competing interests.

Figures

None
Graphical abstract
Figure 1
Figure 1
Design and characterization of hCD8-AAV2 vectors (A) Left: Structure prediction of hCD8-AAV2 based on the VP3 capsid protein of AAV2 (PDB: 1LP3) with inserted 63A4 DARPin via a (G4S)2 linker. Right: VP3-63A4 proteins with N-terminal (G4S)5 linker (hCD8-AAV2lL) (top), (G4S)2 linker (hCD8-AAV2sL) (center), and a rigid coiled-coil linker (hCD8-AAV2ccL) (bottom). 63A4 and linker are shown in yellow and VP3 in violet. (B) Western blot analysis of the indicated hCD8-AAV2 vectors. An amount of 8 μL of each sucrose-pelleted vector stock were heat-denatured in urea buffer before separation with 8% SDS-PAGE and blotting onto a nitrocellulose membrane. AAV viral proteins were detected using the polyclonal VP51 serum. (C) Differential scanning fluorimetry of the indicated AAV stocks; 2.67 × 1010 vg of each sample was exposed to increasing temperatures (1.5 °C/min) from 30°C to 95°C. Fluorescence was determined at 330 nm and 350 nm. Melting temperatures were determined with PR.ThermControl software (v2.1.6) from the maximum of the presented unfolding curve. N = 2 for AAV2, N = 3 for all others. p values are from ordinary one-way ANOVA with Tukey’s multiple comparisons test. Bars represent means, error bars represent SD, ∗∗p < 0.01. (D) Cryo-ET of hCD8-AVV2 particles generated with a 1:1 ratio of unmodified VP2/3 and DARPin-inserted VP1/2/3 (hCD8-AAV2-VP1/2/31/1sL) compared with unmodified AAV2. Yellow arrows indicate 6-nm protrusions on the capsid surface representing the DARPin. Scale bar represents 20 nm. (E) GFP reporter gene transfer mediated by the indicated vectors on SupT1 cells. Titration curves with 5-fold serial dilutions of the vector stocks ranging from 1.6 × 101 to 2.5 × 105 vg/cell are shown. Nonlinear regression for EC50 fitted with HillSlope = 1 and Bottom constrained to a constant value of 0 (Table S2).
Figure 2
Figure 2
Selective gene transfer into human PBMCs (A) Binding of hCD8-AAV2lL and hCD4-AAV2lL to human PBMCs. PBMCs from four donors were incubated with the indicated AAVs at 5 × 105 vg/cell or PBS for 2 h at 37°C. Percentages of AAV-bound cells were determined by flow cytometry after staining with the A20 antibody and anti-mouse IgG. (B–D) Transduction of activated PBMCs from different donors (n = 4) with 1 × 105 and 5 × 105 vg/cell of the indicated AAVs delivering GFP. Representative flow cytometry plots at 5 × 105 vg/cell (B), transduction efficiencies (C) determined as percentage of GFP+ in CD3+/CD8+ cells (left) or in CD3+/CD4+ cells (right) as well as transduction specificities (D) determined as percentage of CD8+ (left) or percentage of CD4+ cells (right) among all GFP+ cells are shown. Bars represent means, error bars represent SD.
Figure 3
Figure 3
Design and characterization of hCD8-targeted AAV6 (A) Structure prediction of hCD8-AAV6 based on AAV6 VP3 (PDB: 3OAH) fused to 63A4 via a (G4S)2 linker. The inlay shows 63A4 and the linker in the GH2/GH3 loop in yellow, the blinding mutations (V473D, K531E) indicated as blue asterisks, and VP1 (without the N-terminal tail) of AAV6 in magenta. (B) TEM analysis of hCD8-AAV6 and unmodified AAV6. Orange arrows point to full, white arrows to empty particles. Images were taken with 50,000-fold magnification and the scale bar represents 100 nm. (C–E) Transduction of activated PBMCs from different donors (n = 4) with hCD8-AAV6 compared with unmodified AAV6 delivering GFP. GFP expression was quantified 3 days post-transduction via flow cytometry. Representative flow cytometry plots at 5 × 105 vg/cell of one donor (C), transduction efficiencies determined as percentage of GFP+ cells within CD3+/CD8+ cells (D), and transduction specificities determined as percentage of CD8+ cells within all GFP+ cells (E) are shown. (F) Viability of hCD8-AAV6 and AAV6 exposed PBMCs from three donors at 2.5 × 106 vg/cell compared with PBS-exposed PBMCs (PBS) (left) and relative decrease in viability (right). Viability was determined by eFlour780 staining and flow cytometry. Statistical analyses were performed using unpaired t test for subfigure (F) (right) as well as ordinary one-way ANOVA and Tukey’s multiple comparisons test for (F) (left). Bars represent means, error bars represent SD, ∗∗∗p < 0.001.
Figure 4
Figure 4
Transduction of CD8+ T cells in whole blood (A) Experimental setup. (B–D) Flow cytometry results of whole-blood transduction of two donors 3 days after addition of hCD8-AAV or AAV6 vector particles (2.5 × 1011 vg/mL blood), PBMC purification, and activation. Representative flow cytometry plots depicting percentages of GFP+ cells within CD3+/CD8+ cells of one donor (B), transduction efficiencies determined as percentage of GFP+ cells within CD3+/CD8+ cells (C), and transduction specificities determined as percentage of CD8+ cells within all GFP+ cells (D) are shown. Statistical analyses were performed using ordinary one-way ANOVA and Tukey’s multiple comparisons test. Bars represent means, error bars represent SD, ∗p = 0.01–0.05, ∗∗p < 0.01.
Figure 5
Figure 5
In vivo gene transfer into activated human CD8+ T cells (A) Experimental setup. (B–D) Flow cytometry results for human PBMCs isolated from mouse blood and spleen 3 days after administration of AAV6 and hCD8-AAVs. Representative flow cytometry plots with percentages of GFP+ cells among human CD3+/CD8+ cells for all three vector types in blood (B), transduction efficiencies determined as percentage of GFP+ cells within human CD3+/CD8+ cells in blood or spleen (C), and transduction specificities determined as percentage of human CD8+ cells within all GFP+ blood or spleen cells (D) are shown. Few mice with less than 500 viable human CD3+ per 5 × 104 blood cells and 1 × 105 splenocytes were excluded from the analysis (Figure S8). Statistical analyses were performed using ordinary one-way ANOVA and Tukey’s multiple comparisons test. Bars represent means, error bars represent SD, ∗∗∗∗p < 0.0001.
Figure 6
Figure 6
In vivo gene transfer into non-activated human CD8+ T cells (A) Experimental setup. (B–D) Flow cytometry results for human PBMCs isolated from mouse blood and spleen 3 days after administration of PBS (n = 2), hCD8-AAV6 (n = 6), hCD8-AAV2 (n = 5), and hCD8-AAV2+IL2/OKT3 (n = 6). Representative flow cytometry plots with percentages of GFP+ cells among human CD3+/CD8+ cells for different groups in spleen (B). Cumulative data with the percentages of human CD3+/CD8− cells and the percentage of human CD3+/CD8+ cells for all groups (C). Transduction efficiencies determined as percentages of GFP+ cells within human CD3+/CD8+ cells in blood or spleen (D). Statistical analyses were performed using unpaired t test. Bars represent means, error bars represent SD, ∗∗p < 0.01, ∗∗∗p < 0.001, ∗∗∗∗p < 0.0001.
Figure 7
Figure 7
CD8-specific in vivo gene transfer in immunocompetent mice (A) Genetic structures of Cre-encoding transfer vector (top), and, the loxP cassette in the genome of Ai9 Cre reporter mice before (center) and after (bottom) recombination inducing tdTomato (tdt) expression. (B–E) Female Ai9 mice received 1.7 × 1011 vg/animal via tail vein injection of AAV2 or mCD8-AAV2lL. A third group of animals received PBS as control. Animals were euthanized 14 days post-injection (n = 6 mice/group). Whole-organ fluorescence of liver was determined by IVIS (B). Bars represent mean values, error bars 95% CIs. Statistical analyses were performed with ordinary one-way ANOVA and Tukey’s multiple comparisons test, ∗∗∗∗p < 0.0001. Representative flow cytometry plots for tdT vs. CD8 signals are shown for blood cells from single mice treated with AAV2 or mCD8-AAV2lL in (C). Transduction efficiencies in CD8+ cells determined as percentage of tdT-positive cells among CD8+ cells (D) and transduction specificities determined as the percentages of CD8+ cells among tdT + cells (E) are shown. Statistical analyses were performed with ordinary one-way ANOVA and Tukey’s multiple comparisons test, ∗∗∗p < 0.001, ∗∗∗∗p < 0.0001. (F–H) Increased gene delivery upon T cell stimulation. Male Ai9 mice were distributed into five groups. Three groups received anti-mouse CD3 and murine IL-2 complex together with 2 × 1011 vg/animal via tail vein injection of AAV6 (n = 4), mCD8-AAV2lL (n = 4), or mCD8-AAV6lL (n = 4). The fourth group received PBS as control (n = 2). The fifth group received mCD8-AAV6lL without in vivo T cell stimulation (mCD8-AAV6 lL without [w/o] conditioning) (n = 4). Representative flow cytometry plots of tdT expression in CD8+ cells in blood at day 2 (F). Plots displaying transduction efficiencies in CD8+ cells determined as percentage of tdT-positive cells among CD8+ cells (G) and transduction specificities determined as the percentages of CD8+ cells among tdT+ cells are shown for blood and spleen (H). Statistical analyses were performed with ordinary one-way ANOVA and Tukey’s multiple comparisons test, ∗∗∗p < 0.001. Bars represent means with error bars indicating 95% CIs. BM, bone marrow.

Similar articles

Cited by

References

    1. Samelson-Jones B.J., George L.A. Adeno-Associated Virus Gene Therapy for Hemophilia. Annu. Rev. Med. 2023;74:231–247. - PMC - PubMed
    1. Mendell J.R., Al-Zaidy S.A., Rodino-Klapac L.R., Goodspeed K., Gray S.J., Kay C.N., Boye S.L., Boye S.E., George L.A., Salabarria S., et al. Current Clinical Applications of In Vivo Gene Therapy with AAVs. Mol. Ther. 2021;29:464–488. - PMC - PubMed
    1. Maguire A.M., Bennett J., Aleman E.M., Leroy B.P., Aleman T.S. Clinical Perspective: Treating RPE65-Associated Retinal Dystrophy. Mol. Ther. 2021;29:442–463. - PMC - PubMed
    1. Pupo A., Fernández A., Low S.H., François A., Suárez-Amarán L., Samulski R.J. AAV vectors: The Rubik's cube of human gene therapy. Mol. Ther. 2022;30:3515–3541. - PMC - PubMed
    1. Jiang Z., Dalby P.A. Challenges in scaling up AAV-based gene therapy manufacturing. Trends Biotechnol. 2023;41:1268–1281. - PubMed

Substances