

Gut-derived appetite hormones do not explain energy intake differences in humans following low-carbohydrate versus low-fat diets
- PMID: 39113385
- PMCID: PMC11357890
- DOI: 10.1002/oby.24104
Gut-derived appetite hormones do not explain energy intake differences in humans following low-carbohydrate versus low-fat diets
Abstract
Objective: The objective of this study was to explore how dietary macronutrient composition influences postprandial appetite hormone responses and subsequent energy intake.
Methods: A total of 20 adults (mean [SEM], age 30 [1] years, BMI 27.8 [1.3] kg/m2, n = 8 with normal weight, n = 6 with overweight, n = 6 with obesity) consumed a low-fat (LF) diet (10% fat, 75% carbohydrate) and a low-carbohydrate (LC) diet (10% carbohydrate, 75% fat) for 2 weeks each in an inpatient randomized crossover design. At the end of each diet, participants consumed isocaloric macronutrient-representative breakfast test meals, and 6-h postprandial responses were measured. Ad libitum energy intake was measured for the rest of the day.
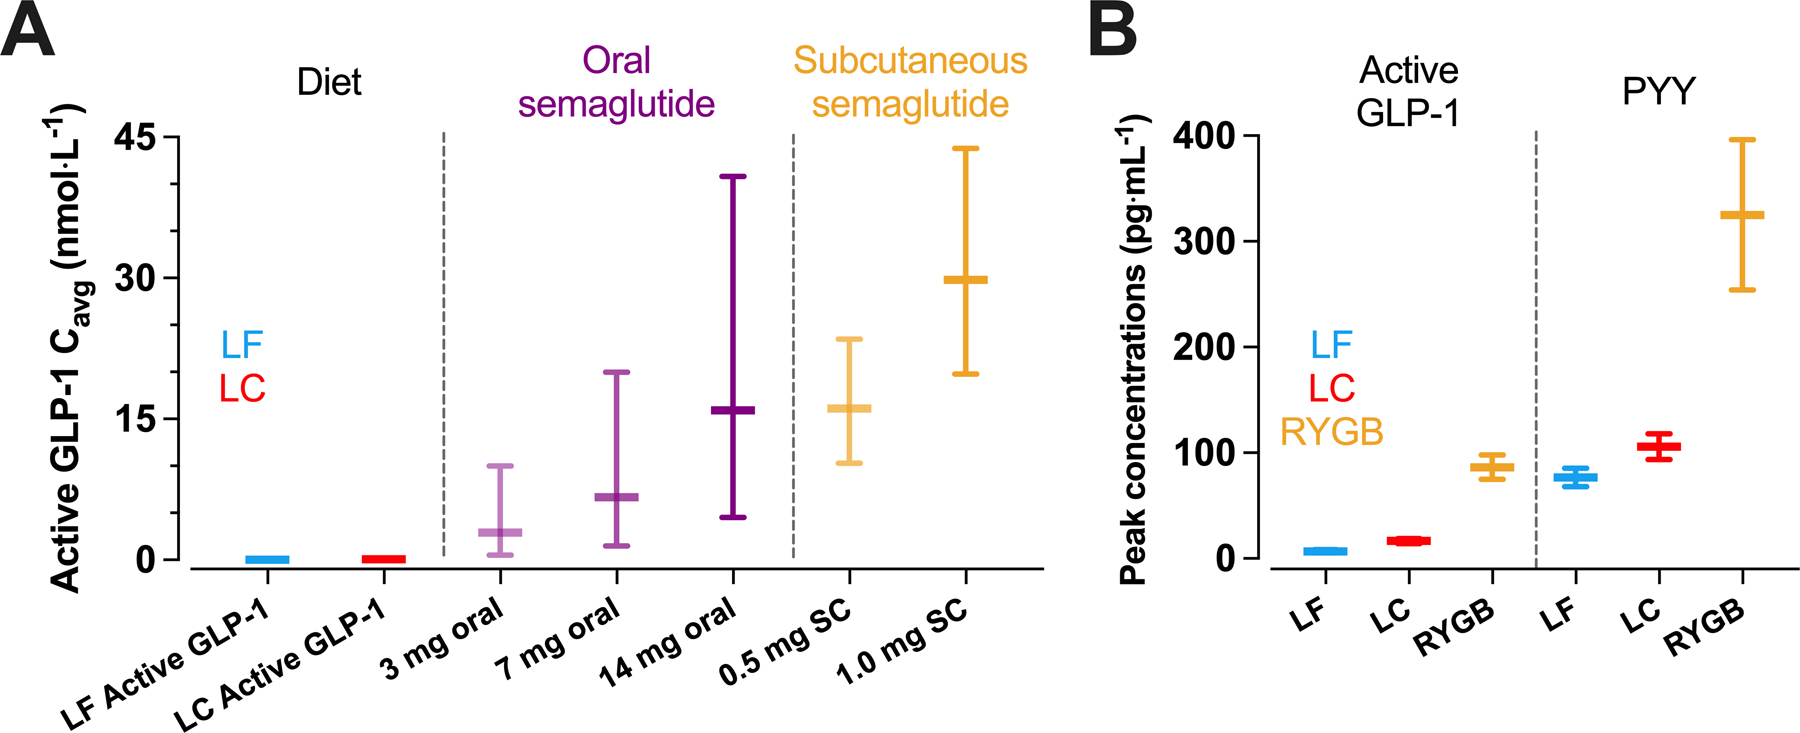
Results: The LC meal resulted in greater mean postprandial plasma active glucagon-like peptide-1 (GLP-1; LC: 6.44 [0.78] pg/mL, LF: 2.46 [0.26] pg/mL; p < 0.0001), total glucose-dependent insulinotropic polypeptide (GIP; LC: 578 [60] pg/mL, LF: 319 [37] pg/mL; p = 0.0004), and peptide YY (PYY; LC: 65.6 [5.6] pg/mL, LF: 50.7 [3.8] pg/mL; p = 0.02), whereas total ghrelin (LC: 184 [25] pg/mL, LF: 261 [47] pg/mL; p = 0.0009), active ghrelin (LC: 91 [9] pg/mL, LF: 232 [28] pg/mL; p < 0.0001), and leptin (LC: 26.9 [6.5] ng/mL, LF: 35.2 [7.5] ng/mL; p = 0.01) were lower compared with LF. Participants ate more during LC at lunch (244 [85] kcal; p = 0.01) and dinner (193 [86] kcal; p = 0.04), increasing total subsequent energy intake for the day compared with LF (551 [103] kcal; p < 0.0001).
Conclusions: In the short term, endogenous gut-derived appetite hormones do not necessarily determine ad libitum energy intake.
Published 2024. This article is a U.S. Government work and is in the public domain in the USA. Obesity published by Wiley Periodicals LLC on behalf of The Obesity Society.
Figures


Update of
-
Discordance between gut-derived appetite hormones and energy intake in humans.medRxiv [Preprint]. 2023 Oct 19:2023.05.10.23289718. doi: 10.1101/2023.05.10.23289718. medRxiv. 2023. Update in: Obesity (Silver Spring). 2024 Sep;32(9):1689-1698. doi: 10.1002/oby.24104. PMID: 37425848 Free PMC article. Updated. Preprint.
References
-
- Tan T, Behary P, Tharakan G, Minnion J, Al-Najim W, Albrechtsen NJW, Holst JJ, and Bloom SR (2017). The Effect of a Subcutaneous Infusion of GLP-1, OXM, and PYY on Energy Intake and Expenditure in Obese Volunteers. The Journal of clinical endocrinology and metabolism 102, 2364–2372. 10.1210/jc.2017-00469. - DOI - PMC - PubMed
Publication types
MeSH terms
Substances
Grants and funding
LinkOut - more resources
Full Text Sources
Research Materials
