. 2025 Jan;45(1):102-114.
doi: 10.1177/0271678X241270445. Epub 2024 Aug 7.

Plasminogen activator inhibitor-1 mediates cerebral ischemia-induced astrocytic reactivity

Affiliations

Plasminogen activator inhibitor-1 mediates cerebral ischemia-induced astrocytic reactivity

Pavel Yanev et al. J Cereb Blood Flow Metab. 2025 Jan.

Abstract

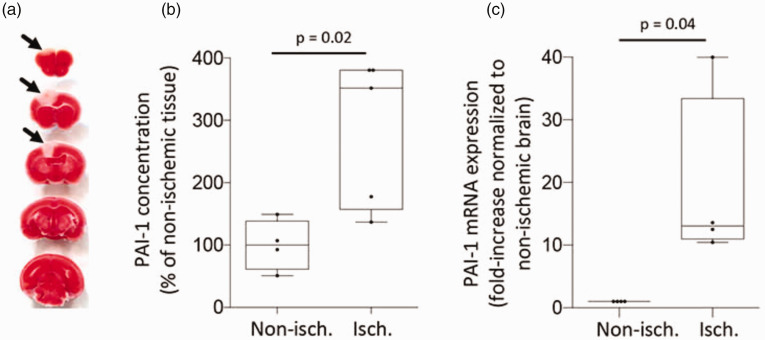
Although ischemia increases the abundance of plasminogen activator inhibitor-1 (PAI-1), its source and role in the ischemic brain remain unclear. We detected PAI-1-immunoreactive cells with morphological features of reactive astrocytes in the peri-ischemic cortex of mice after an experimentally-induced ischemic lesion, and of a chimpanzee that suffered a naturally-occurring stroke. We found that although the abundance of PAI-1 increases 24 hours after the onset of the ischemic injury in a non-reperfusion murine model of ischemic stroke, at that time-point there is no difference in astrocytic reactivity and the volume of the ischemic lesion between wild-type (Wt) animals and in mice either genetically deficient (PAI-1-/-) or overexpressing PAI-1 (PAI-1Tg). In contrast, 72 hours later astrocytic reactivity and the volume of the ischemic lesion were decreased in PAI-1-/- mice and increased in PAI-1Tg animals. Our immunoblottings and fractal analysis studies show that the abundance of astrocytic PAI-1 rises during the recovery phase from a hypoxic injury, which in turn increases the abundance of glial fibrillary acidic protein (GFAP) and triggers morphological features of reactive astrocytes. These studies indicate that cerebral ischemia-induced release of astrocytic PAI-1 triggers astrocytic reactivity associated with enlargement of the necrotic core.

Keywords: Plasminogen activator inhibitor-1 (PAI-1); astrocytic reactivity; cerebral ischemia; fractal analysis; glial fibrillary acidic protein (GFAP).


Conflict of interest statement

Declaration of conflicting interestsThe author(s) declared no potential conflicts of interest with respect to the research, authorship, and/or publication of this article.

Figures

Figure 1.
Figure 1.
Cerebral ischemia increases the abundance of PAI-1 in the ischemic tissue. (a) Representative TTC staining in the brain of a wild-type (Wt) mouse 24 hours after the induction of a photothrombotic lesion to the left frontal cortex (depicted by black arrows). (b) PAI-1 concentration in the ischemic tissue of Wt mice (n = 5) 24 hours after the induction of an ischemic lesion performed as described in A. Results were normalized to PAI-1 concentration in a comparable area from the contralateral non-ischemic hemisphere. Statistical analysis: two-tailed Student’s t-test and non-parametric Mann-Whitney. t = 2.958, df: 7 and (c) PAI-1 mRNA abundance in the ischemic tissue of Wt mice exposed to the experimental conditions described in B. n = 4 per experimental group. Statistical analysis: two-tailed Student’s t-test. t = 2.600, df: 6.
Figure 2.
Figure 2.
Effect of cerebral ischemia on astrocytic PAI-1. (a) Sagittal (a), coronal (b) and axial (c) T2 weighted images from the brain of a 50 year/old female chimpanzee harvested after clinical euthanasia following the spontaneous development of left hemiparesis. (b) Panel a corresponds to a representative micrograph at 20X magnification from a brain section obtained from the area surrounding the necrotic core (asterisks in A-panel a) and stained with antibodies against PAI-1. N depicts part of the necrotic area. R1, R2 & R3 correspond to regions of interest at different distances from N where the expression of PAI-1 was examined. Panels b, d & f show representative micrographs at 40X magnification from R1, R2 and R3, respectively. Panels c, e & g correspond to a 3X electronic magnification of the areas depicted by the dashed squares in b, d & f. Arrows denote examples of PAI-1-immunoreactive cells with morphological features of astrocytes and (c) panel a corresponds to a representative micrograph at 20X magnification from a brain section stained with anti-PAI-1 antibodies in a wild-type mouse 72 hours after the induction of a photothrombotic ischemic lesion to the left M1 area. R1, R2 & R3 correspond to regions of interest at different distance from the necrotic core were the expression of PAI-1 was examined. Panels b, c & d are micrographs at 40X magnification from R1, R2 and R3, respectively. Arrows in b and c denote examples of PAI-1 immunoreactive cells with morphological features of astrocytes.
Figure 3.
Figure 3.
PAI-1 mediates cerebral ischemia-induced astrocytic activation. (a) Representative micrographs from the brain of Wt, PAI-1 deficient (PAI-1−/−) and PAI-1 transgenic (PAI-1Tg) mice stained with anti-GFAP antibodies (green) 24 hours after the induction of an ischemic lesion as described in A. (b) Volume of the ischemic lesion in TTC-stained sections from Wt, PAI-1−/− and PAI-1Tg mice 24 hours after an ischemic stroke induced as presented in panel A. n = 7 per experimental condition. Statistical analysis: one-way ANOVA with Tukey’s multiple comparison’s test. 95% CI: −5.020 to 4.429 for Ct vs PAI-1−/−, and −5.859 to 3.590 for Wt vs PAI-1Tg. (c & d) Representative Western blot analysis (A) and quantification of the intensity of the band (b) of GFAP expression in the ischemic tissue of Wt (n = 6) and PAI-1−/− (n = 8) mice 72 hours after the induction of a photothrombotic lesion to the frontal cortex. Statistical analysis: two-tail Student’s t-test and non-parametric Mann-Whitney. T = 2.473 and df = 12. (e) Representative micrographs from the brain of Wt, PAI-1 deficient (PAI-1−/−) and PAI-1 transgenic (PAI-1Tg) mice stained with anti-GFAP antibodies (green) 72 hours after the induction of an ischemic lesion to the frontal cortex. Panels b, d and f correspond to a 3X magnification of the area surrounding the ischemic core. (f) Quantification of GFAP-immunoreactive area in the ischemic hemisphere of Wt, PAI-1−/− and PAI-1Tg mice exposed to the experimental conditions described in C. Each point is the average of quantifications obtained in four different pictures from 6 different brains per experimental condition. Statistical analysis: one-way ANOVA with Tukey’s multiple comparisons test. 95% CI: 28.85 to 241.7 for Wt vs PAI-1−/−, −214.1 to −1.229 for Wt vs PAI-1Tg, and −349.4 to −136.5 for PAI-1−/− vs PAI-1Tg and (g) volume of the ischemic lesion in TTC-stained sections from Wt, PAI-1−/− and PAI-1Tg mice 4 days after the induction of a photothrombotic lesion to the left frontal cortex. n = 9 per experimental condition. Statistical analysis: one-way ANOVA with Tukey’s multiple comparisons test (95% CI: 1.464 to 14.40 for Wt Vs PAI-1−/−, −16.88 to −3.945 for Wt vs PAI-1Tg, and −25.00 to −11.69 for PAI-1−/− vs PAI-1Tg).
Figure 4.
Figure 4.
Effect of hypoxia on astrocytic PAI-1. (a) Representative micrographs at 40X magnification of PAI-1 (red) and Hoechst (blue) staining in wild-type astrocytes maintained under physiological conditions (a), or fixed either 6 h (b), or 24 h (c), or 48 h (d) after 60 minutes of exposure to oxygen and glucose deprivation (OGD) conditions. Panels e, f, g & h correspond to a 1.5 electronic magnification of the areas depicted by the dashed squares in a, b, c & d, respectively. Arrowheads in f, g & h depict examples of astrocytic elongations and peripheral astrocytic processes. (b) Intensity of PAI-1 immunoreactivity normalized to area in astrocytes exposed to the experimental conditions described in A. n = 15 per experimental group. Statistical analysis: one-way ANOVA with Tukey’s multiple comparisons test. 95% CI: −5265 to −1973 for controls vs 6 h, −5289 to −1997 for controls vs 24 hours, −3973 to −501.6 for controls vs 48 h. (c) Fold increase in the abundance of PAI-1 mRNA in astrocytes extracted 24 hours after 60 minutes of exposure to OGD conditions compared to cells maintained under normoxic conditions (control: c). n = 12 per experimental group. Statistical analysis: two-tailed Student’s t-test and non-parametric Mann-Whitney test. t = 4.075. df = 22. (d) PAI-1 concentration (ELISA) in the culture medium of wild-type astrocytes kept under physiological conditions (c), or 24 hours after 60 minutes of exposure to OGD. n = 12 per experimental condition. Statistical analysis: one-tailed Student’s t-test, non-parametric Mann – Whitney test. t = 2.911, df = 24.
Figure 5.
Figure 5.
PAI-1 mediates hypoxia-induced astrocytic activation. Representative Western blot analysis (a) and quantification of the intensity of the band (b) of GFAP expression in Wt and PAI-1−/− astrocytes maintained under normoxic conditions (control: c) or extracted 24 hours after 60 minutes of exposure to oxygen and glucose deprivation (OGD) conditions. n = 6 per experimental condition. Statistical analysis one-way ANOVA with Tukey’s multiple comparisons test. For Wt control vs Wt OGD, 95% CI: −68.66 to −23.58. For PAI-1−/−control vs PAI-1−/− OGD, 95% CI: −15.84 to 29.24.
Figure 6.
Figure 6.
PAI-1 mediates hypoxia-induced changes on astrocytic morphology. Wt (a & b) and PAI-1−/− (c & d) astrocytes kept under physiological conditions (control: C) or fixed 24 hours after 60 minutes of exposure to oxygen and glucose deprivation (OGD) were stained with anti-ezrin antibodies (green in a & b). Pictures of individual cells were taken at 20X magnification and covered by a grid of boxes (panels c & d) to quantify changes in cell complexity and shape with FracLac - Image J (fractal dimension in panels b and d). Each dot in b & d corresponds to the average of quantifications performed on 40 cells from 4 different cultures for each experimental condition. Statistical analysis in B & D: two-tailed unpaired Student’s t-test, and non-parametric Mann-Whitney test. For B, t = 2.913 and df = 6. For D, t = 0.4230 and df = 6.

References

    1. Robbins KC, Summaria L, Hsieh B, et al. The peptide chains of human plasmin. Mechanism of activation of human plasminogen to plasmin. J Biol Chem 1967; 242: 2333–2342. 1967/05/25. - PubMed
    1. Hart DA, Rehemtulla A. Plasminogen activators and their inhibitors: regulators of extracellular proteolysis and cell function. Comp Biochem Physiol B 1988; 90: 691–708. - PubMed
    1. Dosne AM, Dupuy E, Bodevin E. Production of a fibrinolytic inhibitor by cultured endothelial cells derived from human umbilical vein. Thromb Res 1978; 12: 377–387. - PubMed
    1. Fisher M, Francis R. Altered coagulation in cerebral ischemia. Platelet, thrombin, and plasmin activity. Arch Neurol 1990; 47: 1075–1079. - PubMed
    1. Sawdey MS, Loskutoff DJ. Regulation of murine type 1 plasminogen activator inhibitor gene expression in vivo. Tissue specificity and induction by lipopolysaccharide, tumor necrosis factor-alpha, and transforming growth factor-beta. JClinInvest 1991; 88: 1346–1353. - PMC - PubMed

Substances

LinkOut - more resources