. 2025 Jan;45(1):153-170.
doi: 10.1177/0271678X241270241. Epub 2024 Aug 7.

The temporal dynamic of bradykinin type 2 receptor effects reveals its neuroprotective role in the chronic phase of cerebral and retinal ischemic injury

Affiliations

The temporal dynamic of bradykinin type 2 receptor effects reveals its neuroprotective role in the chronic phase of cerebral and retinal ischemic injury

Helena Justić et al. J Cereb Blood Flow Metab. 2025 Jan.

Abstract

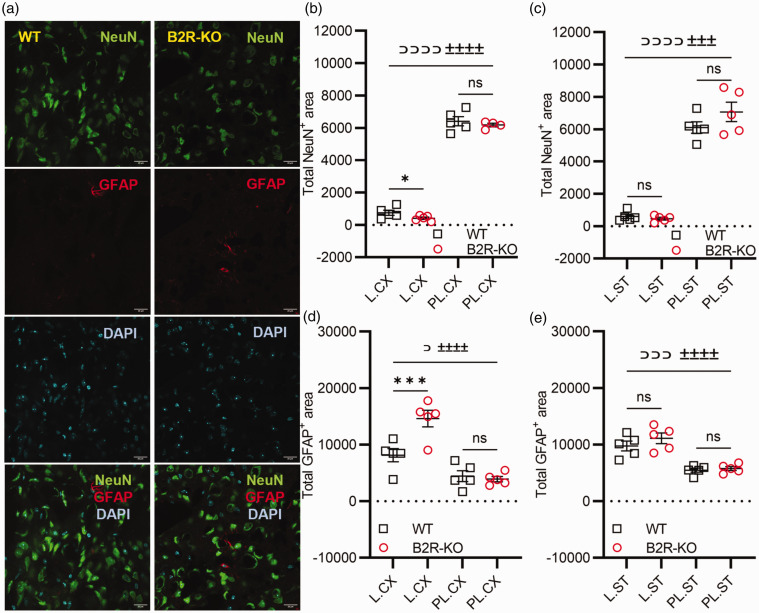
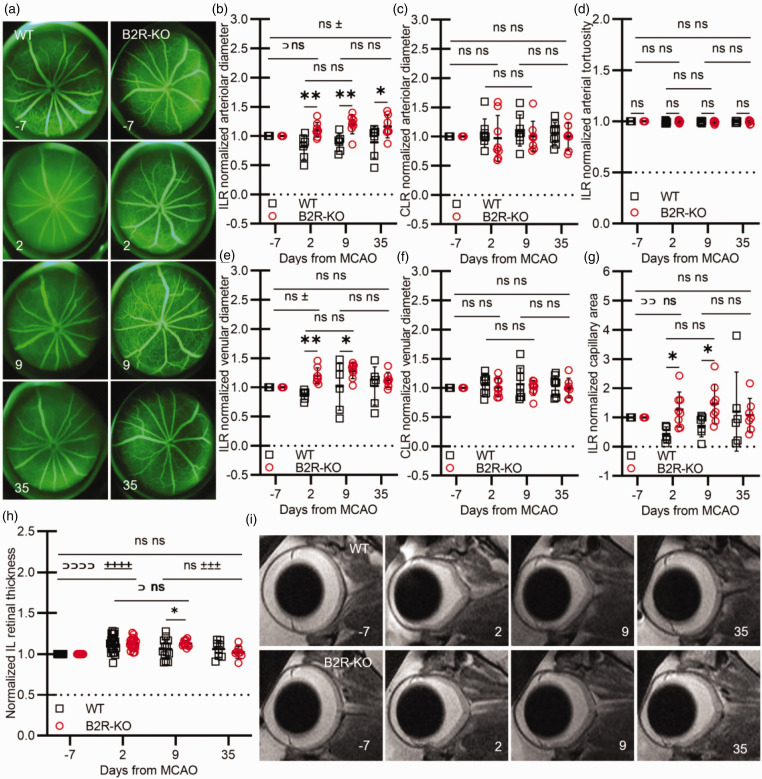
The activation of the bradykinin type 2 receptor is intricately involved in acute post-ischemic inflammatory responses. However, its precise role in different stages of ischemic injury, especially in the chronic phase, remains unclear. Following simultaneous cerebral and retinal ischemia, bradykinin type 2 receptor knockout mice and their controls were longitudinally monitored for 35 days via magnetic resonance imaging, fundus photography, fluorescein angiography, behavioral assessments, vascular permeability measurements, and immunohistochemistry, as well as glycemic status assessments. Without impacting the lesion size, bradykinin type 2 receptor deficiency reduced acute cerebral vascular permeability preventing the loss of pericytes and tight junctions. In the chronic phase of ischemia, however, it resulted in increased astrogliosis and cortical neuronal loss, as well as higher functional deficits. The retinal findings demonstrated a similar pattern. Bradykinin type 2 receptor deficiency delayed, but exacerbated the development of retinal necrosis, increased subacute vascular permeability, and promoted retinal ganglion cell loss in the chronic phase of ischemia. This investigation sheds light on the temporal dynamic of bradykinin type 2 receptor effects in ischemia, pointing to a therapeutic potential in the subacute and chronic phases of ischemic injury.

Keywords: Bradykinin type 2 receptor; brain; ischemia; magnetic resonance imaging; retina.


Conflict of interest statement

Declaration of conflicting interestsThe author(s) declared no potential conflicts of interest with respect to the research, authorship, and/or publication of this article.

Figures

Figure 1.
Figure 1.
B2R deficiency modulates vascular permeability without affecting the acute lesion volume. (a) B2R deficiency does not have a significant effect on ischemic lesion volume. Repeated measures ANOVA with Šidak's post hoc test within genotype: WT (⊃⊃⊃⊃) P < 0.0001; B2R-KO (±±±±) P < 0.0001. WT day 2 n = 28, day 9 n = 17; B2R-KO day 2 n = 28; day 9 n = 14. (b–c) Analysis of Evans blue (EB) and sodium fluorescein (NAF) extravasation (n = 4 per group/time point). Mixed ANOVA with correction for multiple comparisons controlling for false discovery rate (α = 0.05) among genotypes and between hemispheres (*) P < 0.05; (**) P < 0.01; within genotype: WT (⊃) P < 0.05. (d) Representative images of bradykinin type 2 receptor (B2R; magenta) marker localization on endothelial cells (CD31; red) and pericytes (NG2; green) in triple-stained cerebral microvessels. Cyan – DAPI-positive nuclei. Scale bar: 20 µm. (e) Quantification of NG2+ pericytes and (g) quantification of ZO-1+ proteins in cerebral microvessels at days 2 and 9 post-MCAO (n = 4 mice per group/time point). One-way ANOVA with correction for multiple comparisons controlling for false discovery rate (α = 0.05) among genotypes (*) P < 0.05, (**) P < 0.01; within genotype: WT (⊃⊃) P < 0.01, (⊃⊃⊃) P < 0.001; B2R-KO (±±±±) P < 0.0001. (f) Representative images of tight junction protein ZO-1 (dark blue) marker on endothelial cells (CD31; red) in double-stained cerebral microvessels. Scale bar: 20 µm.
Figure 2.
Figure 2.
B2R deficiency impacts chronic cerebral arterial perfusion, glycemic status, and tissue loss after cerebral ischemia. (a) Representative maximum intensity projections of MR angiography scans. (b–c) Effects of B2R deficiency on the arterial perfusion status of the ipsilateral (ILH; B) and contralateral (CLH; C) hemispheres pre and post-MCAO. Analysis of (d) blood glucose concentration, (e) intraperitoneal glucose tolerance test, and (f) glycated hemoglobin HbA1c before and 34 days post-MCAO. (g–i) ILH (G) and CLH (H) volume and tissue loss (I). Mixed model ANOVA with Šidak’s post hoc test between genotypes: (***) P < 0.001, (**) P < 0.01, (*) P < 0.05; or Tukey’s post hoc test among time points: WT (⊃⊃⊃⊃) P < 0.0001, (⊃⊃) P < 0.01, (⊃) P < 0.05; B2R-KO (±±±±) P < 0.0001, (±±±) P < 0.001, (±) P < 0.05. Pre-MCAO and day 2 n = 28 per group; day 9 WT n = 17, B2R-KO n = 14; day 35 n = 8 per group.
Figure 3.
Figure 3.
B2R deficiency heightens acute neurological deficit and chronic neurological functions following ischemia without affecting survival. B2R deficiency does not affect (a) survival proportions assessed by the Log-rank (Mantel-Cox) test or (b) animal weight post-MCAO. (c) Neurological status and (d–f) sensorimotor functions assessed using the (d) rotarod test, (e) wire hanging test and (f) pole test. Mixed model ANOVA with Šidak's post hoc test between groups at individual time points: (*) P < 0.05, (**) P < 0.01, or Tukey's post hoc test among time points: WT (⊃⊃⊃⊃) P < 0.0001, (⊃⊃⊃) P < 0.001, (⊃⊃) P < 0.01, (⊃) P < 0.05; B2R-KO (±±±±) P < 0.0001, (±±±) P < 0.01, (±±) P < 0.01. Pre-MCAO and day 2 n = 28 per group; day 9 WT n = 17, B2R-KO n = 14; day 35 n = 8 per group.
Figure 4.
Figure 4.
B2R deficiency is associated with pronounced neuronal loss and increased astrogliosis in the ischemic lesion. (a) Representative images of neuronal nuclei (NeuN; green) marker and astrocyte glial fibrillary acidic protein (GFAP; red) marker in the double-stained perilesional area of the cortex 35 days post-MCAO. Cyan – DAPI-positive nuclei. Scale bar: 20 µm. (b) Quantification of NeuN+ neurons and (d) GFAP+ astrocytes in the cortical lesion (L.CX) and perilesional (PL.CX) areas and (c) neurons and (e) astrocytes in the striatal lesion (L.ST) and perilesional (PL.ST) areas 35 days post-MCAO. One-way ANOVA with correction for multiple comparisons controlling for false discovery rate (α = 0.05) between genotypes (*) P < 0.05, (***) P < 0.001; within genotype: WT (⊃) P < 0.05, (⊃⊃⊃) P < 0.001, (⊃⊃⊃⊃) P < 0.0001; B2R-KO (±±±±) P < 0.0001, (±±±) P < 0.01. n = 5 mice per group/time point.
Figure 5.
Figure 5.
B2R deficiency leads to delayed onset of retinal ischemia. (a) Representative fundus photographs. (b–e) Qualitative fundus analysis over days -7 (B), 2 (C), 9 (D), and 35 (E) shows delayed retinal ischemic necrosis development in B2R-KO animals. MO – media opacification; RN+ – retinal necrosis positive, visible areas of retinal opacification; RN− – retinal necrosis negative, no visible signs of retinal opacification. IL – ipsilateral; CL – contralateral.
Figure 6.
Figure 6.
B2R deficiency has discernible effects on retinal vasculature resulting in delayed edema resolution. (a) Representative fundus angiography images of the ipsilateral eyes pre and post-MCAO. (b–g) Analysis of retinal vasculature shows the impact of B2R deficiency on normalized arteriolar diameter (b, c), venular diameter (e, f), capillary area (g), and arteriolar tortuosity (d) pre- and post-MCAO. (h) Normalized retinal thickness measured T2-weighted images pre and post-MCAO. Mixed model ANOVA with Šidak's post hoc test between groups at individual time points: (*) P < 0.05, or Tukey's post hoc test between time points: WT (⊃⊃⊃⊃) P < 0.0001, (⊃) P < 0.05; B2R-KO (±±±±) P < 0.0001, (±±±) P < 0.001. (i) Representative T2 images of the ipsilateral eye pre and post-MCAO. ILR – ipsilateral retina. CLR – contralateral retina.
Figure 7.
Figure 7.
B2R deficiency promotes ganglion cell loss in the chronic phase of retinal ischemia. (a–b) Analysis of Evans blue (EB; A) and sodium fluorescein (NAF; B) extravasation (n = 4 per group/time point). Mixed ANOVA test with correction for multiple comparisons controlling for false discovery rate (α = 0.05): (*) P < 0.05. (c) Representative sections of the ipsilateral and contralateral retinas post-MCAO. White arrows display areas of aberrant morphology. Scale bar: 50 µm. (d) Quantification of NeuN+ ganglion cells and (e) GFAP+ mean signal intensity in the ipsilateral retinas (ILR) 35 days post-MCAO. Student's t-test: (***) P < 0.001 (n = 5 per group).

Similar articles

Cited by

References

    1. Zausinger S, Lumenta D, Pruneau D, et al. Effects of LF 16-0687 Ms, a bradykinin B2 receptor antagonist, on brain edema formation and tissue damage in a rat model of temporary focal cerebral ischemia. Brain Res 2002; 950: 268–278. - PubMed
    1. Walker K, Perkins M, Dray A. Kinins and kinin receptors in the nervous system. Neurochem Int 1995; 26: 1–16. - PubMed
    1. Gröger M, Lebesgue D, Pruneau D, et al. Release of bradykinin and expression of kinin B2 receptors in the brain: Role for cell death and brain edema formation after focal cerebral ischemia in mice. J Cereb Blood Flow Metab 2005; 25: 978–989. - PubMed
    1. Othman R, Cagnone G, Joyal J-S, et al. Kinins and their receptors as potential therapeutic targets in retinal pathologies. Cells 2021; 10: 1913. - PMC - PubMed
    1. Wagner S, Kalb P, Lukosava M, et al. Activation of the tissue kallikrein-kinin system in stroke. J Neurol Sci 2002; 202: 75–76. - PubMed

Substances

LinkOut - more resources