. 2024 Dec 1;109(12):4021-4039.
doi: 10.3324/haematol.2024.285233.

Distinctive genomic features of human T-lymphotropic virus type 1-related adult T-cell leukemia-lymphoma in Western populations

Affiliations

Distinctive genomic features of human T-lymphotropic virus type 1-related adult T-cell leukemia-lymphoma in Western populations

Caroline S Myers et al. Haematologica. .

Abstract

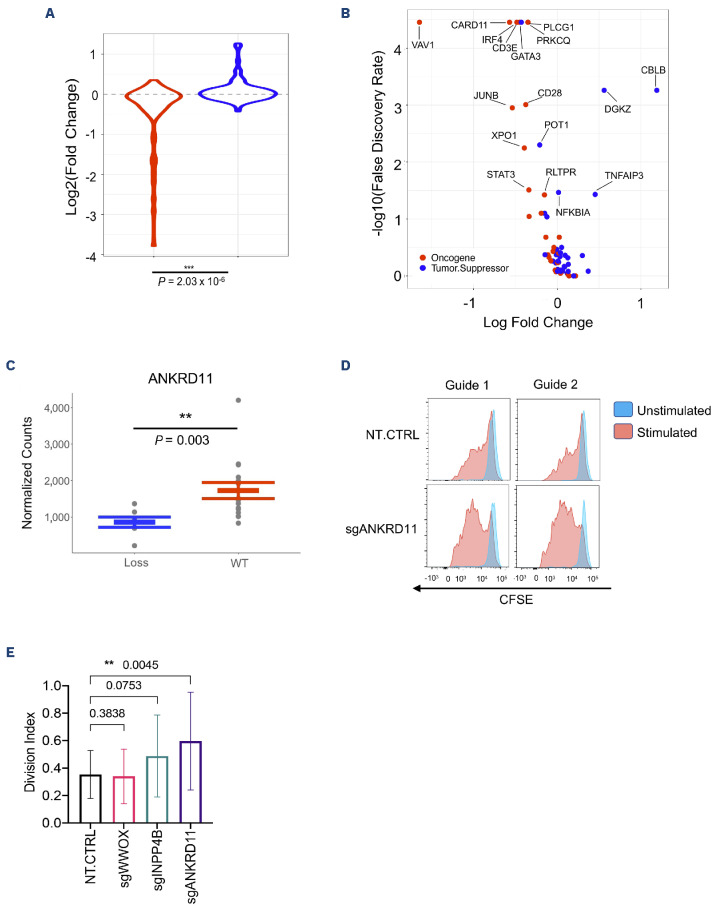
Adult T-cell leukemia-lymphoma (ATLL) is an aggressive malignancy driven by human T-cell leukemia virus type 1 (HTLV-1). Although patients from the Western hemisphere (Afro-Caribbean and South American) face worse prognoses, our understanding of ATLL molecular drivers derives mostly from Japanese studies. We performed multi-omic analyses to elucidate the genomic landscape of ATLL in Western cohorts. Recurrent deletions and/or damaging mutations involving FOXO3, ANKRD11, DGKZ, and PTPN6 implicate these genes as potential tumor suppressors. RNA-sequencing, published functional data and in vitro assays support the roles of ANKRD11 and FOXO3 as regulators of T-cell proliferation and apoptosis in ATLL, respectively. Survival data suggest that ANKRD11 mutation may confer a worse prognosis. Japanese and Western cohorts, in addition to acute and lymphomatous subtypes, demonstrated distinct molecular patterns. GATA3 deletion was associated with chronic cases with unfavorable outcomes. IRF4 and CARD11 mutations frequently emerged in relapses after interferon therapy. Our findings reveal novel putative ATLL driver genes and clinically relevant differences between Japanese and Western ATLL patients.


Figures

Figure 1.
Figure 1.
Putative adult T-cell leukemia-lymphoma driver genes discovered through mutation analysis. (A) Plot of GISTIC amplification/deletion peaks labeled with their corresponding driver genes. Amplifications are depicted in red and deletions in blue. Peaks are displayed along the genome represented lengthwise. Peak heights indicate GISTIC-calculated significance (G-score). Genes newly implicated in adult T-cell leukemia-lymphoma (ATLL) and/or cancer are highlighted in magenta. Both Western and Japanese patients are included in this analysis (N=554). (B, D, F, G) Point mutation burden among Western ATLL patients (N=122), Japanese ATLL patients (N=83), and published T-cell lymphoma patients (N=800) across ANKRD11 (B), GATA3 (D), CD3E (F) and FOXO3 (G). Shapes and colors indicate mutation type and cohort, respectively, as indicated in the legend. (F, G) Right panels show recurrently mutated residues in magenta color within the context of their respective protein structures; ligands are shown in yellow. (F) CD3E is shown in dark gray. CD3ζ and CD3γ are shown in light gray. Bound T-cell receptor is shown in yellow. (G) A novel FOXO3 variant is shown with mutant tryptophan in hot pink and nearby isoleucine shown in orange. The zoomed-in panel shows predicted steric clashing between these residues as red discs, suggesting that a tryptophan mutation may be energetically unfavorable. The other subunit in the FOXO3 homodimer is shown in light gray. DNA is shown in yellow. (C, E) Histograms indicating segments of overlapping deletion in ANKRD11 (C) and GATA3 (E). The depicted cohort includes both Japanese and Western patients (N=554). Surrounding genes are indicated at the bottom of the figure. KIX: kinase-inducible domain interacting; ITAM: immunoreceptor tyrosine-based activation motif; CTCL: cutaneous T-cell lymphoma.
Figure 2.
Figure 2.
Key pathways involving recurrent mutations identified in Western and Japanese samples. (A) Frequencies and types of copy number variation (CNV) and point mutations in Western and Japanese samples. Only samples with both CNV and whole-exome sequencing data available are portrayed in this plot (N=168). Mutation type is indicated by the color of the squares. Bars at the bottom indicate the gross number of mutations. Colored bars to the left indicate single nucleotide polymorphism-determined ethnic classification of patients and categorization of their disease subtype. The significance of the GISTIC peak in which the mutation is found, if applicable, is indicated by the heatmap on top (values indicate the negative logarithm of the q-value). Novel mutations are indicated by gene names in blue (newly implicated in adult T-cell leukemia-lymphoma [ATLL]) or red (newly implicated in cancer). Genes with mutational frequencies differing between subtypes or population cohorts are indicated with a triangle or a star, respectively. (B) An illustration of CD28- and T-cell receptor-initiated signaling pathways and their associated molecules based on a review of the current literature. Cytoplasmic and nuclear compartments are separated by the dashed red line representing the nuclear membrane. Downstream DNA-bound transcription factors (FOXO3a, AP-1, NFAT) and pathway- inducible genes (BIM, FOXP3, IFNG, IL2, IRF4) are shown. Stars mark putative driver mutations. HBZ (HTLV-1 bZIP factor) viral protein is shown as a dotted oval shape. TCR: T-cell receptor; AFR: African; AMRISAS: Native American/Southeast Asian; SNV: single nucleotide variation.
Figure 3.
Figure 3.
Functional validation of putative driver genes. (A) Violin plots showing log fold change of sgRNA (N=19,114) for putative oncogenes and putative tumor suppressors in genome-wide CRISPR interference screens for T-cell receptor (TCR)-dependent proliferation and cytokine production. sgRNA changes for putative oncogenes are shown on the left; those for putative tumor suppressors are shown on the right. The P value represents the significance of the difference between these distributions (Student two-tailed t test). A similar analysis of CRISPR amplification screens is included in Online Supplementary Figure S5. (B) Patterns of sgRNA alteration for putative oncogenes/tumor suppressors in a genome-wide CRISPR interference screen of TCR-dependent proliferation. The x axis represents the logarithm of the fold change, the y axis represents the negative logarithm of the false discovery rate. Putative oncogenes are shown in red and putative tumor suppressors in blue. CRISPR interference and amplification screens for TCR-independent cytokine production were analyzed similarly. (C) ANKRD11 RNA transcript levels in ANKRD11 mutant (blue) and wild-type (red) samples. Dots represent individual values, central horizontal bar represents the mean, and error bars represent the standard error. **P<0.01, comparison performed using the Student two-tailed t test. (D) Targeted CRISPR knockout screens in normal T cells for ANKRD11. Carboxy-fluorescein succinimidyl ester (CFSE) dilution progresses (CFSE dye diminishes) from right to left. Stimulated cells are shown in red and unstimulated in blue. (E) Division index in targeted CRISPR knockout screens in normal T cells for ANKRD11 versus control. Error bars represent the standard error. **P<0.01, comparison performed using a paired-ratio t test. WT: wild-type; NT.CTRL: non-transduced control.
Figure 4.
Figure 4.
Functional validation of the pro-apoptotic role of FOXO3 in adult T-cell leukemia-lymphoma cells. (A-D) Left panels show the percentage of apoptotic cells, as determined by the percentage of cells staining positively for annexin V by fluorescence-activated cell sorting (FACS) analysis. Brackets represent comparisons made after subtracting dimethyl sulfoxide vehicle (DMSO) control values. The statistical significance of differences was determined by a Student two-tailed t test (*P<0.05, **P<0.01, ***P<0.001). Error bars represent the standard error from separately treated triplicate samples. Right panels show gated data from FACS analysis, with anti-annexin V on the x axis and propidium iodine on the y axis. (A-C) Western blots validating protein levels in knockdown/overexpression constructs are shown at the top of the lefthand panels. β-actin was used as the protein loading control. (A) Percentage of apoptotic cells in ATLL-97c FOXO3 knockdown constructs exposed to DMSO vehicle, etoposide 200 nM or belinostat 200 nM. Two FOXO3 knockdown constructs were established using distinct FOXO3-specific single-guide RNA (sgRNA1 and sgRNA2). A construct established from a non-specific scrambled single-guide RNA was used as a control. (B) Percentage of apoptotic cells in ATLL-97c FOXO3 overexpression constructs exposed to belinostat at concentrations of 200, 400 or 800 nM. m-CAT-1-expressing ATLL-97c cells were transduced with pseudoviral particles containing one of two overexpression constructs (#1 or #5). Cells transduced with empty vectors were used as a control. (C) Percentage of apoptotic cells in ATLL-84c doxycycline-inducible constructs exposed to DMSO vehicle, belinostat 200 nM (Bel 200) or belinostat 400 nM (Bel 400). Dox (+) cells were treated with doxycycline 1 µg/mL at least 72 h before and at the start of drug treatment experiments. Dox (-) cells were not exposed to doxycycline. (D) Percentage of apoptotic cells after exposure to belinostat 400 nM (Bel 400) in ATLL-84c cells transduced with lentiviruses containing either p.Arg177Trp (R177W) or p.Asp199Asn (D199N) FOXO3 mutant constructs. Cells transfected with an empty lentivirus were used as controls. Vector nucleotide sequences were verified by sequencing. EV: empty vector; Eto: etoposide; Bel: belinostat, SCR: non-specific scrambled single-guide RNA; Wt: wild-type; Dox: doxycycline.
Figure 5.
Figure 5.
Differential patterns in mutational frequency between Japanese and Western adult T-cell leukemia-lymphoma cohorts. (A, B) Comparison of point mutation frequencies between Japanese/Western and Afro-Caribbean/South American populations. The color of the bars represents mutation type, while the height of the bars represents the frequency with which a gene is mutated in the specified population. Statistical comparisons were performed with the Fisher exact test. *P<0.05, **P<0.01. (A) Comparisons in acute cases (N=62 Western vs. 39 Japanese and 48 Afro-Caribbean vs. 14 South American). (B) Comparisons in lymphomatous cases (N=29 Western vs. 13 Japanese and 9 Afro-Caribbean vs. 20 South American). (C, D) Histograms of amplifications (C) and deletions (D) across the genome in Japanese (top) and Western (bottom) cohorts. The y axis represents the proportion of cohorts with amplification/ deletion in a given region. Genes significantly different between cohorts, as discussed in the text, are highlighted with arrows. Genes newly implicated in adult T-cell leukemia-lymphoma. and/or cancer are highlighted in magenta. AFR: Afro-Caribbean; AMR: South America
Figure 6.
Figure 6.
Genomic alterations associated with clinical subtype and mortality. (A, B) Violin plots demonstrating the similarity of the number of genes deleted or amplified per sample (A) and the number of point mutations per sample (B) between the unfavorable chronic subtype of adult T-cell leukemia-lymphoma (N=15), and acute (N=63) and lymphomatous (N=31) subtypes. Bars represent the mean (central bar) and standard error. A Student two-tailed t test was used to determine the statistical significance of differences, *P<0.05, **P<we identified ***P<0.001. (C) Comparison of GATA3 protein levels by immunohistochemistry in aggressive (acute and lymphomatous) and unfavorable chronic cases, Student two-tailed t test. Dots represent individual values, the central horizontal bar represents the mean, and the error bars represent the standard error. (D, E) Kaplan-Meier curves indicating the effect of TP53 (D) and ANKRD11 (E) mutation on overall survival. Red lines indicate overall mortality for patients with a mutation in the specified gene. Blue lines indicate overall mortality for patients without a mutation in that gene. Significance was determined using a Cox multivariate analysis of the overall cohort controlling for disease subtype and treatment modality. Padj = P value after Bonferroni correction for multiple comparisons. (F) Frequencies of chemotherapy responses in patients with a CDKN2A deletion/damaging mutation (left) compared to patients with wild-type CDKN2A (right). Fisher exact test, *P<0.05. Unfav.: unfavorable; WT: wild-type; CR: complete response; PR: partial response.
Figure 7.
Figure 7.
Association of IRF4 mutations with relapse in adult T-cell leukemia-lymphoma. (A) Clonality of tumor populations as determined by T-cell receptor (TCR) sequence identification from RNA-sequencing data. Patients shown here contributed samples from initial disease as well as subsequent relapse. Clonal populations were defined as cells with identical TCR. Each blue shape represents the dominant T-cell clone, as determined by α and b TCR subunit identity. The vertical axis represents the size of clonal populations as determined by the frequencies of the dominant α and b subunit. Relapses are indicated by vertical white lines. Multiple relapses are shown in sequential order, from left to right. (B) Comparison of point and copy number variation (CNV) mutations in initial (I) versus relapsed (R) samples. Pairs of initial/relapsed samples from the same patient are indicated in light and dark shades, respectively, of alternating blue and green. Mutation types include deletions, amplifications, damaging mutations and nonsynonymous (missense) mutations, as shown in the legend. Putative driver genes are listed on the left. (C) Frequency of new IRF4 mutations in first-time disease (N=121) compared to relapsed samples (N=12). Fisher exact test, *P<0.05. (D) Distribution of mutations across IRF4. Mutations shown in blue occurred in Western samples (N=121), those shown in yellow occurred in the Japanese cohort (N=83). Especially frequent mutations are represented as pie markers indicating the proportion of variants contained in either the Western (blue) or Japanese (yellow) cohort. Marker stem heights represent the number of cases as depicted on the y axis. SNV: single nucleotide variation; WT: wild-type.

References

    1. Poiesz BJ, Ruscetti FW, Gazdar AF, Bunn PA, Minna JD, Gallo RC. Detection and isolation of type C retrovirus particles from fresh and cultured lymphocytes of a patient with cutaneous T-cell lymphoma. Proc Natl Acad Sci U S A. 1980;77(12):7415-7419. - PMC - PubMed
    1. Gessain A, Cassar O. Epidemiological aspects and world distribution of HTLV-1 infection. Front Microbiol. 2012;3:388. - PMC - PubMed
    1. Shimoyama M. Diagnostic criteria and classification of clinical subtypes of adult T-cell leukaemia-lymphoma. A report from the Lymphoma Study Group (1984-87). Br J Haematol. 1991;79(3):428-437. - PubMed
    1. Cook LB, Fuji S, Hermine O, et al. . Revised adult T-cell leukemialymphoma International Consensus Meeting Report. J Clin Oncol. 2019;37(8):677-687. - PMC - PubMed
    1. Ishitsuka K, Tamura K. Human T-cell leukaemia virus type I and adult T-cell leukaemia-lymphoma. Lancet Oncol. 2014;15(11):e517-526. - PubMed