. 2024 Aug 1;20(10):4077-4097.
doi: 10.7150/ijbs.97362. eCollection 2024.

Catalpol attenuates hepatic glucose metabolism disorder and oxidative stress in triptolide-induced liver injury by regulating the SIRT1/HIF-1α pathway

Affiliations

Catalpol attenuates hepatic glucose metabolism disorder and oxidative stress in triptolide-induced liver injury by regulating the SIRT1/HIF-1α pathway

Weijue Nie et al. Int J Biol Sci. .

Abstract

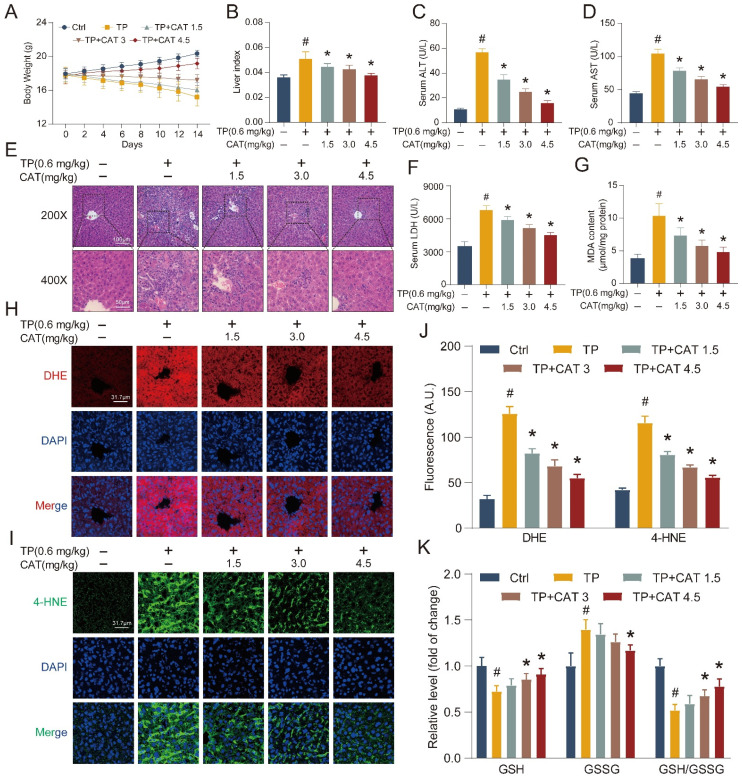
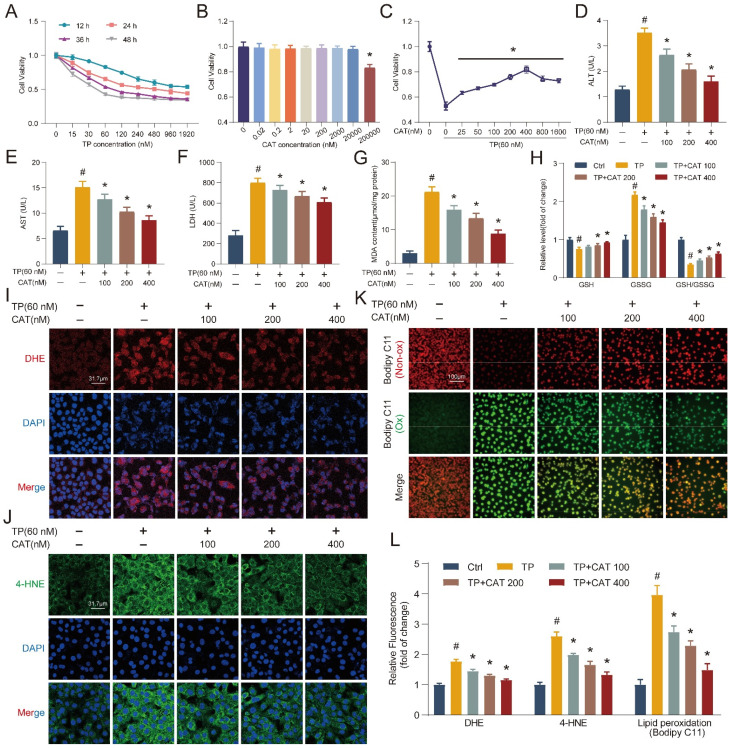
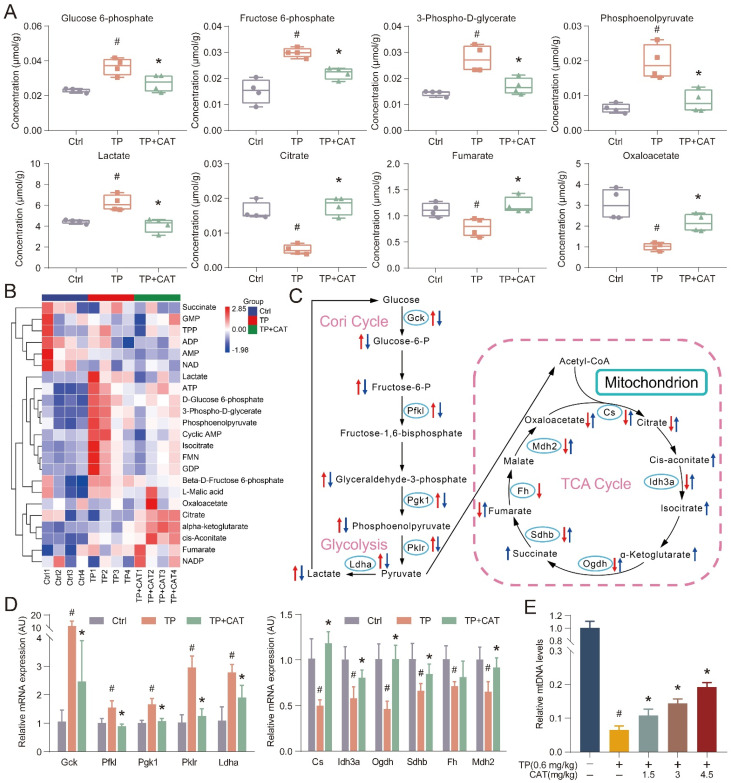
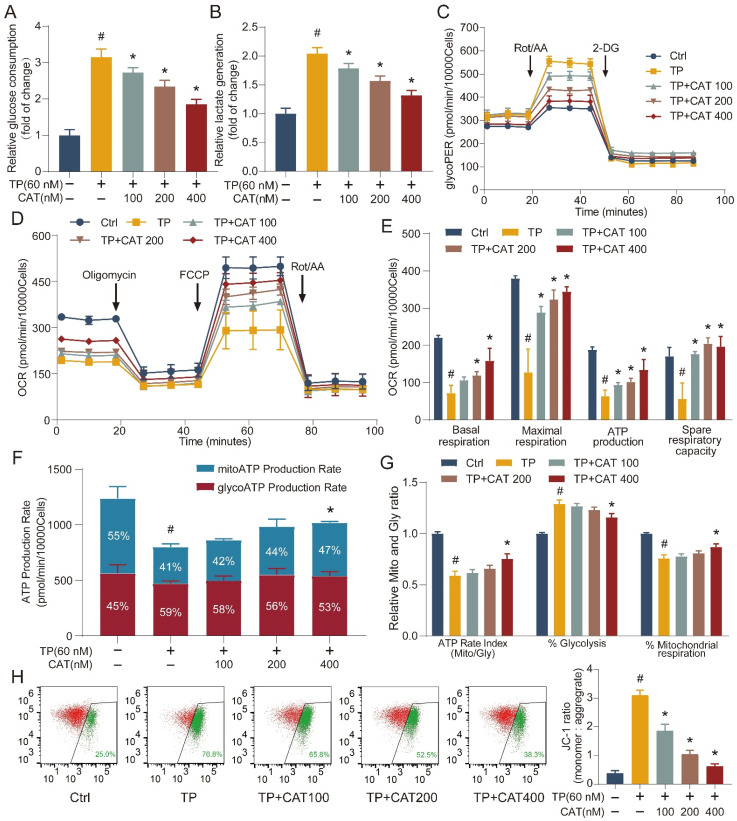
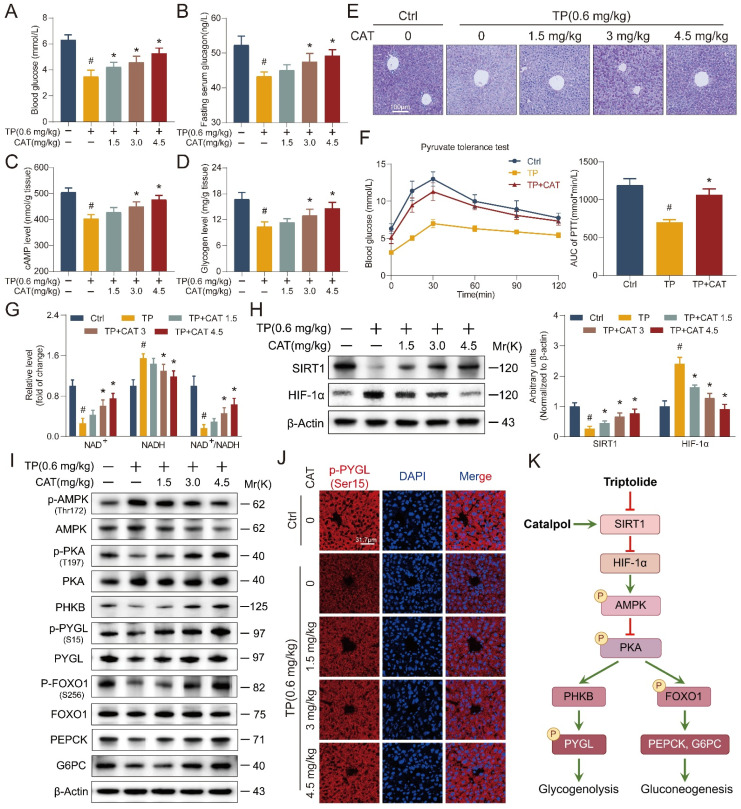
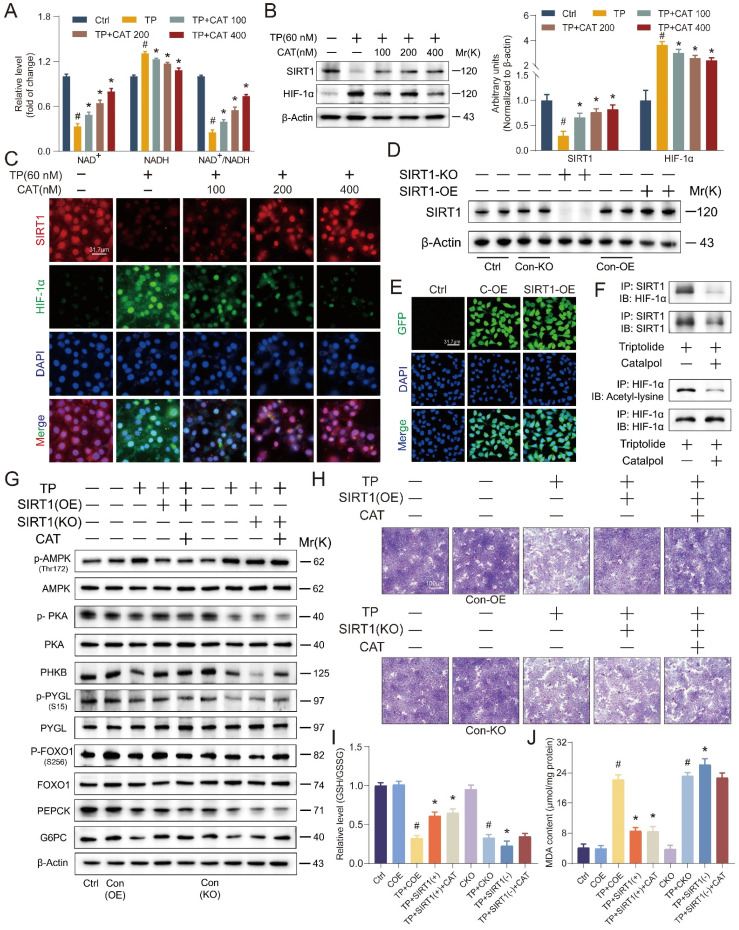
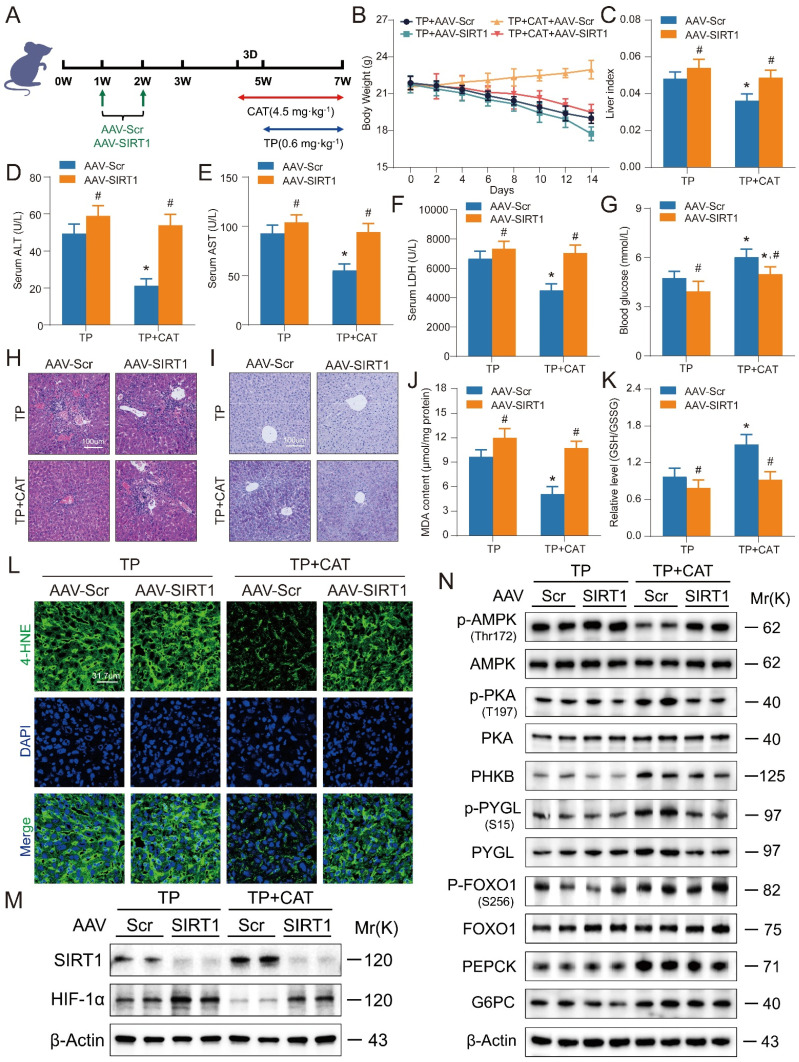
Triptolide (TP), known for its effectiveness in treating various rheumatoid diseases, is also associated with significant hepatotoxicity risks. This study explored Catalpol (CAT), an iridoid glycoside with antioxidative and anti-inflammatory effects, as a potential defense against TP-induced liver damage. In vivo and in vitro models of liver injury were established using TP in combination with different concentrations of CAT. Metabolomics analyses were conducted to assess energy metabolism in mouse livers. Additionally, a Seahorse XF Analyzer was employed to measure glycolysis rate, mitochondrial respiratory functionality, and real-time ATP generation rate in AML12 cells. The study also examined the expression of proteins related to glycogenolysis and gluconeogenesis. Using both in vitro SIRT1 knockout/overexpression and in vivo liver-specific SIRT1 knockout models, we confirmed SIRT1 as a mechanism of action for CAT. Our findings revealed that CAT could alleviate TP-induced liver injury by activating SIRT1, which inhibited lysine acetylation of hypoxia-inducible factor-1α (HIF-1α), thereby restoring the balance between glycolysis and oxidative phosphorylation. This action improved mitochondrial dysfunction and reduced glucose metabolism disorder and oxidative stress caused by TP. Taken together, these insights unveil a hitherto undocumented mechanism by which CAT ameliorates TP-induced liver injury, positioning it as a potential therapeutic agent for managing TP-induced hepatotoxicity.

Keywords: Catalpol; Drug-induced liver injury; Energy metabolism; Hypoglycemia; Oxidative stress.


Conflict of interest statement

Competing Interests: The authors have declared that no competing interest exists.

Figures

Figure 1
Figure 1
Catalpol (CAT) mitigated triptolide (TP) induced liver injury in mice by modulating oxidative stress and lipid peroxidation. Mice were randomly divided into the following 5 groups (six mice per group): Vehicle control (Ctrl), TP 0.6 mg/kg (TP), TP 0.6 mg/kg + CAT 1.5 mg/kg (TP + CAT1.5), TP 0.6 mg/kg + CAT 3.0 mg/kg (TP + CAT3) and TP 0.6 mg/kg + CAT 4.5 mg/kg (TP + CAT4.5). (A) Body weight. (B) Liver index. (C) Serum ALT levels. (D) Serum AST levels. (E) Microphotograph of H&E-stained sections of liver tissues (Scale bars, 100/50 μm). (F) Serum LDH levels. (G) MDA content. (H) Representative DHE fluorescence staining of liver sections for ROS production. Scale bar, 31.7 μm. (I) Immunofluorescence staining of liver sections using antibody against 4-HNE. Scale bar, 31.7 μm. (J) Quantification of DHE and 4-HNE fluorescence image. (K) The relative concentrations of GSH, GSSG and GSH/GSSG ratio measured in liver tissues. Data are expressed as mean ± SD (n = 6); #P < 0.05 versus Ctrl, *P < 0.05 versus TP.
Figure 2
Figure 2
Catalpol (CAT) suppressed triptolide (TP) induced damage in hepatocytes. (A-C) CCK8 assay. (D-F) AML12 cells culture supernatant ALT, AST and LDH levels. (G) MDA content. (H) Relative concentrations of GSH, GSSG and GSH/GSSG ratio measured in AML12 cells. (I) Representative DHE fluorescence staining of AML12 cells. Scale bar, 31.7 μm. (J) Immunofluorescence staining of AML12 cells using antibody against 4-HNE. Scale bar, 31.7 μm. (K) Bodipy C11 staining of AML12 cells. Scale bar, 100 μm. (L) Relative quantification of DHE, 4-HNE and Bodipy C11 fluorescence images. Data are expressed as mean ± SD (n = 4); #P < 0.05 versus Ctrl, *P < 0.05 versus TP.
Figure 3
Figure 3
Catalpol (CAT) improved triptolide (TP) induced energy metabolism disorder in the liver. (A) Box plots of some significantly altered hepatic metabolites in three groups (Ctrl, TP and TP + CAT groups). (B) The hierarchical cluster analysis (HCA) presents a differentiation in the abundance of energy metabolites across the various groups. Within the heatmap, a more intense red denotes a higher level, while a deeper blue suggests a lower concentration. (C) The influence of CAT on TP-induced energy metabolic dysfunctions in the liver. Comparisons to the Ctrl group show that alterations in metabolites in the TP group are marked with a red arrow. Inversely, changes in the TP + CAT group relative to the TP group are represented with blue. An ascending arrow denotes a substantial escalation (P < 0.05), whilst a descending arrow indicates a noteworthy reduction (P < 0.05). (D) Comparative mRNA expression levels tied to energy metabolism in the livers of the three separate groups. (E) Relative mtDNA levels. Data are expressed as mean ± SD (n = 4); #P < 0.05 versus Ctrl, *P < 0.05 versus TP.
Figure 4
Figure 4
The beneficial role of catalpol (CAT) was related to regulating the balance between glycolysis and OXPHOS. (A) Relative glucose consumption. (B) Relative lactate generation. (C) Glycolytic rate assay measuring glycolytic proton efflux rate (glycoPER). (D) Assessment of mitochondrial stress through direct quantification of the oxygen consumption rate (OCR). (E) Outcomes from the quantitative analysis of cellular respiration parameters: basal respiration, maximal respiration, ATP production, and spare respiratory capacity. (F) Real-time ATP production rate test calculated ATP manufacture rate from glycolysis (Gly) and mitochondrial respiration (Mito). (G) Mito/Gly ATP rate index, % Glycolysis and % Mitochondrial respiration were conducted. (H) Flow cytometry inspection of the JC-1 experiment (mitochondrial membrane potential) in AML12 cells. Rot/AA: Rotenone plus Antimycin A; 2-DG: 2-deoxy-D-glucose. Data are expressed as mean ± SD (n = 3); #P < 0.05 versus Ctrl, *P < 0.05 versus TP.
Figure 5
Figure 5
Catalpol (CAT) alleviated triptolide (TP) induced glycogen metabolism and gluconeogenesis disorders through the SIRT1/HIF-1α pathway. (A) Blood glucose. (B) Fasting serum glucagon levels. (C) Hepatic cAMP levels. (D) Hepatic glycogen levels. (E) Microphotograph of PAS-stained sections of liver tissues. Scale bar, 31.7 μm. (F) Following a 16-hour fasting period, the mice were administered an intraperitoneal injection of sodium pyruvate at a dosage of 1.5 g/kg body weight. Subsequently, their blood glucose levels were recorded at predetermined time intervals. The values for the area under the curve (AUC) of blood glucose were then computed. (G) The relative concentrations of NAD+, NADH and NAD+/NADH ratio measured in liver tissues. (H) Western blot analysis of SIRT1 and HIF-1α expression from mouse liver. (I) The expression levels of glycogenolysis and gluconeogenesis related proteins. (J) Immunofluorescence staining of liver sections using antibody against p-PYGL (Ser15). Scale bar, 31.7 μm. (K) Schematic of signaling pathway changes. Data are expressed as mean ± SD (n = 6); #P < 0.05 versus Ctrl, *P < 0.05 versus TP.
Figure 6
Figure 6
SIRT1/HIF-1α was the target of catalpol (CAT) and the beneficial effects of CAT were influenced by the overexpression or knockout of SIRT1 in vitro. (A) The relative concentrations of NAD+, NADH and NAD+/NADH ratio measured in AML12 cells. (B) Western blot analysis of SIRT1 and HIF-1α expression from AML12 cells. (C) Immunofluorescence staining of AML12 cells using antibodies against SIRT1 and HIF-1α. Scale bar, 31.7 μm. (D) SIRT1 protein expression of transfected cells. (E) Transfection results of AML12 cells. Scale bar, 31.7 μm. (F) Co-immunoprecipitation was done using equal protein quantities with either SIRT1 antibody or HIF-1α antibody, followed by immunoblotting procedure using antibodies against SIRT1, HIF-1α or Acetyl-lysine, illustrating the impact of TP and CAT. (G) The levels of proteins associated with glycogenolysis and gluconeogenesis in the transfected cells. (H) Microphotograph of transfected cells stained with PAS. Scale bar, 100 μm. (I) Relative determination of GSH/GSSG ratio in transfected cells. (J) MDA content of transfected cells. Data are expressed as mean ± SD (n = 3); #P < 0.05 versus Ctrl, COE or CKO, *P < 0.05 versus TP, TP + COE or TP + CKO.
Figure 7
Figure 7
Liver-specific SIRT1 knockout aggravated triptolide (TP) induced liver injury and weakened the beneficial effects of catalpol (CAT). (A) Experimental flow chart. (B) Body weight. (C) Liver index. (D-F) Serum ALT, AST and LDH levels. (G) Blood glucose levels. (H) Microphotograph of H&E-stained sections of liver tissues. Scale bar, 31.7 μm. (I) Microphotograph of PAS-stained sections of liver tissues. Scale bar, 31.7 μm. (J) MDA content. (K) Relative determination of GSH/GSSG ratio in liver tissues. (L) Immunofluorescence staining of liver sections using antibody against 4-HNE. Scale bar, 31.7 μm. (M) The protein expression levels of SIRT1 and HIF-1α. (N) The expression levels of glycogenolysis and gluconeogenesis related proteins. Data are expressed as mean ± SD (n = 6); An “*” indicates significant difference between TP and TP + CAT groups (P < 0.05). A “#” indicates significant difference between AAV-Scr and AAV-SIRT1 in either TP or TP + CAT groups (P < 0.05).

Similar articles

Cited by

References

    1. Zhao Z, Huang H, Ke S, Deng B, Wang YX, Xu N. et al. Triptolide inhibits the proinflammatory potential of myeloid-derived suppressor cells via reducing Arginase-1 in rheumatoid arthritis. Int Immunopharmacol. 2024;127:111345. - PubMed
    1. Zhao L, Lan Z, Peng L, Wan L, Liu D, Tan X. et al. Triptolide promotes autophagy to inhibit mesangial cell proliferation in IgA nephropathy via the CARD9/p38 MAPK pathway. Cell Prolif. 2022;55(9):e13278. - PMC - PubMed
    1. Zhang Y, Zhang F, Gao Y, Wang M, Gao Y, Li H. et al. Triptolide in the treatment of systemic lupus erythematosus - regulatory effects on miR-146a in B cell TLR7 signaling pathway in mice. Front Pharmacol. 2022;13:952775. - PMC - PubMed
    1. Gao J, Zhang Y, Liu X, Wu X, Huang L, Gao W. Triptolide: pharmacological spectrum, biosynthesis, chemical synthesis and derivatives. Theranostics. 2021;11(15):7199–7221. - PMC - PubMed
    1. Xi C, Peng S, Wu Z, Zhou Q, Zhou J. Toxicity of triptolide and the molecular mechanisms involved. Biomed Pharmacother. 2017;90:531–541. - PubMed

MeSH terms

LinkOut - more resources