. 2024 Jul 22;14(11):4536-4553.
doi: 10.7150/thno.95796. eCollection 2024.

ISG15 accelerates acute kidney injury and the subsequent AKI-to-CKD transition by promoting TGFβR1 ISGylation

Affiliations

ISG15 accelerates acute kidney injury and the subsequent AKI-to-CKD transition by promoting TGFβR1 ISGylation

Na Cui et al. Theranostics. .

Abstract

Rationale: Acute kidney injury (AKI) has substantial rates of mortality and morbidity, coupled with an absence of efficacious treatment options. AKI commonly transits into chronic kidney disease (CKD) and ultimately culminates in end-stage renal failure. The interferon-stimulated gene 15 (ISG15) level was upregulated in the kidneys of mice injured by ischemia-reperfusion injury (IRI), cisplatin, or unilateral ureteral obstruction (UUO), however, its role in AKI development and subsequent AKI-to-CKD transition remains unknown. Methods: Isg15 knockout (Isg15 KO) mice challenged with bilateral or unilateral IRI, cisplatin, or UUO were used to investigate its role in AKI. We established cellular models with overexpression or knockout of ISG15 and subjected them to hypoxia-reoxygenation, cisplatin, or transforming growth factor- β1 (TGF-β1) stimulation. Renal RNA-seq data obtained from AKI models sourced from public databases and our studies, were utilized to examine the expression profiles of ISG15 and its associated genes. Additionally, published single cell RNA-seq data from human kidney allograft biopsies and mouse IRI model were analyzed to investigate the expression patterns of ISG15 and the type I TGF-β receptor (TGFβR1). Western blotting, qPCR, co-immunoprecipitation, and immunohistochemical staining assays were performed to validate our findings. Results: Alleviated pathological injury and renal function were observed in Isg15 KO mice with IRI-, cisplatin-, or UUO-induced AKI and the following AKI-to-CKD transition. In hypoxia-reoxygenation, cisplatin or TGF-β1 treated HK-2 cells, knockout ISG15 reduced stimulus-induced cell fibrosis, while overexpression of ISG15 with modification capacity exacerbated cell fibrosis. Immunoprecipitation assays demonstrated that ISG15 promoted ISGylation of TGFβR1, and inhibited its ubiquitination. Moreover, knockout of TGFβR1 blocked ISG15's fibrosis-exacerbating effect in HK-2 cells, while overexpression of TGFβR1 abolished the renal protective effect of ISG15 knockout during IRI-induced kidney injury. Conclusions: ISG15 plays an important role in the development of AKI and subsequent AKI-to-CKD transition by promoting TGFβR1 ISGylation.

Keywords: AKI-to-CKD transition; ISG15; TGFβR1; acute kidney injury; fibrosis.


Conflict of interest statement

Competing Interests: The authors have declared that no competing interest exists.

Figures
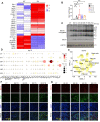
Figure 1
Figure 1
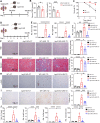
ISG15 is up-regulated in the kidney of mice after renal IR injury. (A) RNA-seq data of ISG15 and its related ligase genes, and fibrotic genes in the kidneys of IRI-treated mice. (B) qPCR results of Isg15 of non-injured (CT) or IRI-treated mice at 1, 3, 7, or 21 days, n = 4 per group, *P < 0.05; **P < 0.01. (C) Western blot of ISG15 at indicated times after IRI, n = 2 per group. (D) single cell RNA-seq data of ISG15 in the kidneys of IRI mice. CT, control; 4H, 4 hours; 12H, 12 hours; 2D, 2 days; 14D, 14 days; 6W, 6 weeks. (E) tSNE plot of ISG15 expressed cell clusters from single cell RNA-seq of a human kidney allograft biopsy. CD, collecting duct; EC, endothelial cell; LOH (AL), loop of Henle, ascending limb; LOH (DL), loop of Henle, distal limb; PT, proximal tubule. (F) Representative images of ISG15 (red), KIM-1 (green) and DAPI (blue) staining of the kidney. (G) Representative images of ISG15 (red), Fn1 (green) and DAPI (blue) staining of the kidney. CT, non-injured mice; IRI 1D/3D/7D/21D, mice at IRI 1/3/7/21 days, n = 4 per group. Scale bar = 50 μm.
Figure 2
Figure 2
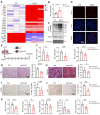
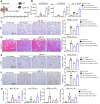
Knockout of ISG15 suppresses IRI-induced kidney injury. (A) Experimental design chart of bilateral IRI (BIRI). (B) Serum creatinine (left) and BUN (right) levels for indicated experimental groups at 3 days after BIRI 3D. WT+BIRI 3D, n = 7; Isg15 KO+BIRI 3D, n = 5. (C) Survival rate of WT and Isg15 KO mice were subjected to BIRI. WT+BIRI, n = 12; Isg15 KO+BIRI, n = 14. (D) Experimental design chart of unilateral IRI (UIRI). (E) qPCR results of Kim1, Ngal, Cysc for WT and Isg15 KO mice at non-injured conditions (CT) or at 7 days after UIRI. (F) Representative H&E images (left) with injury scores (right) of the kidney of WT and Isg15 KO mice at non-injured conditions (CT) or at 7 days after UIRI. Scale bar = 100 μm. (G-I) Representative images and quantitative results of Masson staining (G), immunostaining for α-SMA (H), Fn1 (I) of the kidney of WT and Isg15 KO mice at non-injured conditions (CT) or at 7 days after UIRI. Scale bar = 100 μm. (J) qPCR results of Fn1, Acta2, Col3a and Vimentin in the kidney of WT and Isg15 KO mice at non-injured conditions (CT) or at 7 days after UIRI. WT+CT, n = 6; Isg15 KO+CT, n = 5; WT+UIRI 7D, n = 7; Isg15 KO+UIRI 7D, n = 7. *P < 0.05; **P < 0.01; ***P < 0.001; ****P < 0.0001.
Figure 3
Figure 3
Knockout of ISG15 suppresses UUO-induced kidney injury. (A) RNA-seq data of ISG15 and its related ligase genes, and fibrotic genes in the kidneys of UUO injured mice. (B-C) qPCR (B) and WB (C) results of ISG15 of non-injured (CT) or UUO injured mice. (D) Representative images of ISG15 (red), and DAPI (blue) staining of the kidney of CT or UUO injured mice. CT, n = 6; UUO, n = 5. (E) Experimental design chart of UUO injury. (F) qPCR results of Kim1, Cysc, Ngal in the kidneys of WT and Isg15 KO mice after UUO injury. (G) Representative H&E images (left) with injury scores (right) of the kidney of WT and Isg15 KO mice after UUO injury. Scale bar = 100 μm. (H-J) Representative images and quantitative results of Masson staining (H), immunostaining for α-SMA (I), Fn1 (J) of the kidney of WT and Isg15 KO mice after UUO injury. Scale bar = 100 μm. (K) qPCR results of Fn1, Tgfb1, Acta2, Col3a and Vimentin in the kidney of WT and Isg15 KO mice after UUO injury. WT+UUO, n = 4; Isg15 KO+UUO, n = 8. *P < 0.05; **P < 0.01.
Figure 4
Figure 4
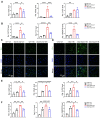
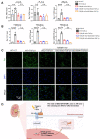
ISG15 aggravates HR induced fibrosis in cultured HK-2 cells. (A-B) qPCR results of KIM1, NGAL, CYSC, ACTA2, Fn1 and VIMENTIN in ISG15 knockout HK-2 cells with or without HR treatment. (C) Representative Fn1 images in ISG15 knockout HK-2 cells with or without HR treatment. (D) Representative Fn1 images in ISG15 overexpressed HK-2 cells with HR treatment. Scale bar = 50 μm. (E-F) qPCR results of KIM1, NGAL, CYSC, ACTA2, Fn1 and VIMENTIN in ISG15 overexpressed HK-2 cells with HR treatment. The experiments were repeated three times, and at least three biological replicates per group were used. *P < 0.05; **P < 0.01; ***P < 0.001; ****P < 0.0001; n.s., not significant.
Figure 5
Figure 5
ISG15 aggravates TGF-β1 induced fibrosis in cultured HK-2 cells. (A-B) qPCR results of KIM1, NGAL, CYSC, ACTA2, Fn1 and VIMENTIN in ISG15 knockout HK-2 cells with or without TGF-β1 treatment. (C) Representative Fn1 images in ISG15 knockout HK-2 cells with or without TGF-β1 treatment. (D) Representative Fn1 images in ISG15 overexpressed HK-2 cells with TGF-β1 treatment. Scale bar = 50 μm. (E-F) qPCR results of KIM1, NGAL, CYSC, ACTA2, Fn1 and VIMENTIN in ISG15 overexpressed HK-2 cells with TGF-β1 treatment. The experiments were repeated three times, and at least three biological replicates per group were used. *P < 0.05; **P < 0.01; ***P < 0.001; ****P < 0.0001; n.s., not significant.
Figure 6
Figure 6
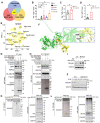
ISG15 binds and ISGylates TGFβR1 receptor. (A) Venn diagram analysis of three RNA-seq data. (B-D) qPCR results of Tgfbr1 in the kidneys after IRI (B), cisplatin (C), UUO (D) injury at indicated time, n = 4-6 per group. *P < 0.05; n.s., not significant. (E) tSNE plot of TGFβR1 expressed cell clusters from scRNA-seq of a human kidney allograft biopsy. CD, collecting duct; EC, endothelial cell; LOH (AL), loop of Henle, ascending limb; LOH (DL), loop of Henle, distal limb; PT, proximal tubule. (F) Binding model of ISG15 and TGFβR1. (G-H) Co-IP results of ISG15 and TGFβR1 in HEK293T cells transfected with indicated plasmids. (I) Effects of MG132 on ISG15 knockout-mediated proteolysis of TGFβR1. The cells were treated with MG132 (10 μM) for 6 h before immunoblots. (J) Effects of ISG15 knockout on the protein levels of TGFβR1 under the treatment of a ribosome inhibitor CHX (100 μM) for 6 h before immunoblots. (K) ISG15 overexpression reduced ubiquitination of endogenous TGFβR1 in HEK293T cells treated with MG132. HSP70 serves as the loading control. (L) ISG15 knockout enhanced ubiquitination of endogenous TGFβR1 in HK-2 cells treated with MG132. HSP70 serves as the loading control. The experiments were repeated three times.
Figure 7
Figure 7
TGFβR1 exacerbates AKI and the following AKI-to-CKD transition in vivo and in vitro. (A) Experimental design chart of TGFβR1 overexpression by renal intraparenchymal injection in UIRI-treated mice. (B) Representative H&E images (left) with injury scores (right) of the kidney of indicated groups. Scale bar = 100 μm. (C) qPCR results of Kim1, Ngal, Cysc, Acta2, Fn1, Col3a and Vimentin in the kidney of indicated groups. (D-F) Representative images and quantitative results of Masson staining (D), immunostaining for α-SMA (E), Fn1 (F) of the kidney of indicated groups. Scale bar = 100 μm. CT+Ad-ctrl, n = 5; UIRI+Ad-ctrl, n = 4; UIRI+Ad-Tgfbr1, n = 4. (G) qPCR results of KIM1, NGAL, CYSC, ACTA2, Fn1 and VIMENTIN in TGFβR1 knockout HK-2 cells with or without TGF-β1 treatment. (H) Representative Fn1 images in TGFβR1 overexpressed HK-2 cells with or without TGF-β1 treatment. Scale bar = 50 μm. (I) Representative Fn1 images in TGFβR1 overexpressed HK-2 cells with or without TGF-β1 treatment. Scale bar = 50 μm. (J) qPCR results of KIM1, NGAL, CYSC, ACTA2, Fn1 and VIMENTIN in TGFβR1 knockout HK-2 cells with or without TGF-β1 treatment. The experiments were repeated three times, and at least three biological replicates per group were used. *P < 0.05; **P < 0.01; ***P < 0.001; ****P < 0.0001; n.s., not significant.
Figure 8
Figure 8
Renal overexpression of TGFβR1 abolishes the renal protective effect of ISG15 knockout. (A) Experimental design chart of TGFβR1 overexpression by renal intraparenchymal injection in Isg15 KO mice subjected to UIRI. (B) qPCR results of Kim1, Ngal, Cysc in the kidney of indicated groups. (C) Representative H&E images (left) with injury scores (right) of the kidney of different groups. Scale bar = 100 μm. (D-F) Representative images and quantitative results of Masson staining (D), immunostaining for α-SMA (E), Fn1 (F) of the kidney of indicated groups. Scale bar = 100 μm. (G) qPCR results of Fn1, Acta2, Col3a and Vimentin in the kidney of different groups. WT+Ad-ctrl, n = 5; WT+UIRI+Ad-ctrl, n = 4; Isg15 KO+UIRI+Ad-ctrl, n = 3; Isg15 KO+UIRI+Ad-Tgfbr1, n = 4. *P < 0.05; **P < 0.01; ***P < 0.001; ****P < 0.0001; n.s., not significant.
Figure 9
Figure 9
ISG15 aggravates renal injury by ISGylating TGFβR1. (A) qPCR results of KIM1, NGAL, CYSC in TGFβR1 knockout HK-2 cells with ISG15 overexpression under TGF-β1 treatment. (B) qPCR results of ACTA2, Fn1 and VIMENTIN in TGFβR1 knockout HK-2 cells with ISG15 overexpression under TGF-β1 treatment. (C) Representative Fn1 images in TGFβR1 knockout HK-2 cells with ISG15 overexpression under TGF-β1 treatment. Scale bar = 50 μm. (D) A schematic model of the ISG15 role involved in AKI and the following AKI-to-CKD transition. The experiments were repeated three times, and at least three biological replicates per group were used. *P < 0.05; **P < 0.01; ***P < 0.001; ****P < 0.0001; n.s., not significant.

References

    1. Guo C, Dong G, Liang X, Dong Z. Epigenetic regulation in AKI and kidney repair: mechanisms and therapeutic implications. Nat Rev Nephrol. 2019;15:220–39. - PMC - PubMed
    1. Zarbock A, Forni LG, Ostermann M, Ronco C, Bagshaw SM, Mehta RL. et al. Designing acute kidney injury clinical trials. Nat Rev Nephrol. 2024;20:137–46. - PubMed
    1. Vijayan A. Tackling AKI: prevention, timing of dialysis and follow-up. Nat Rev Nephrol. 2021;17:87–8. - PMC - PubMed
    1. Pistolesi V, Regolisti G, Morabito S, Gandolfini I, Corrado S, Piotti G. et al. Contrast medium induced acute kidney injury: a narrative review. J Nephrol. 2018;31:797–812. - PubMed
    1. De Clercq L, Ailliet T, Schaubroeck H, Hoste EAJ. Acute and Chronic Cardiovascular Consequences of Acute Kidney Injury: A Systematic Review and Meta-Analysis. Cardiorenal Med. 2023;13:26–33. - PubMed

Publication types

MeSH terms