. 2024 Jul 8;14(11):4297-4317.
doi: 10.7150/thno.96375. eCollection 2024.

Astrocyte-derived lactate aggravates brain injury of ischemic stroke in mice by promoting the formation of protein lactylation

Affiliations

Astrocyte-derived lactate aggravates brain injury of ischemic stroke in mice by promoting the formation of protein lactylation

Xiao-Yi Xiong et al. Theranostics. .

Abstract

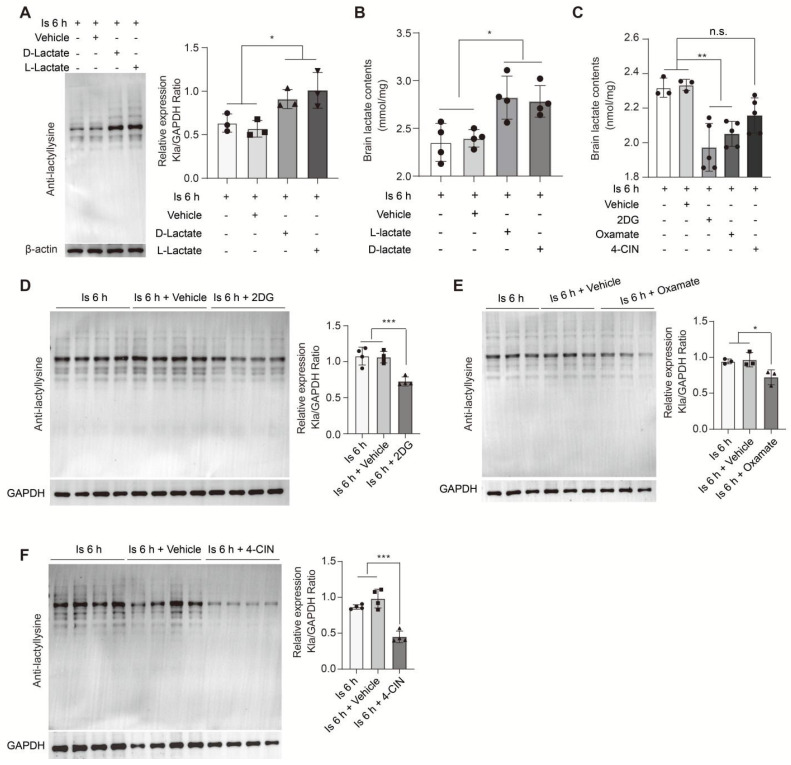
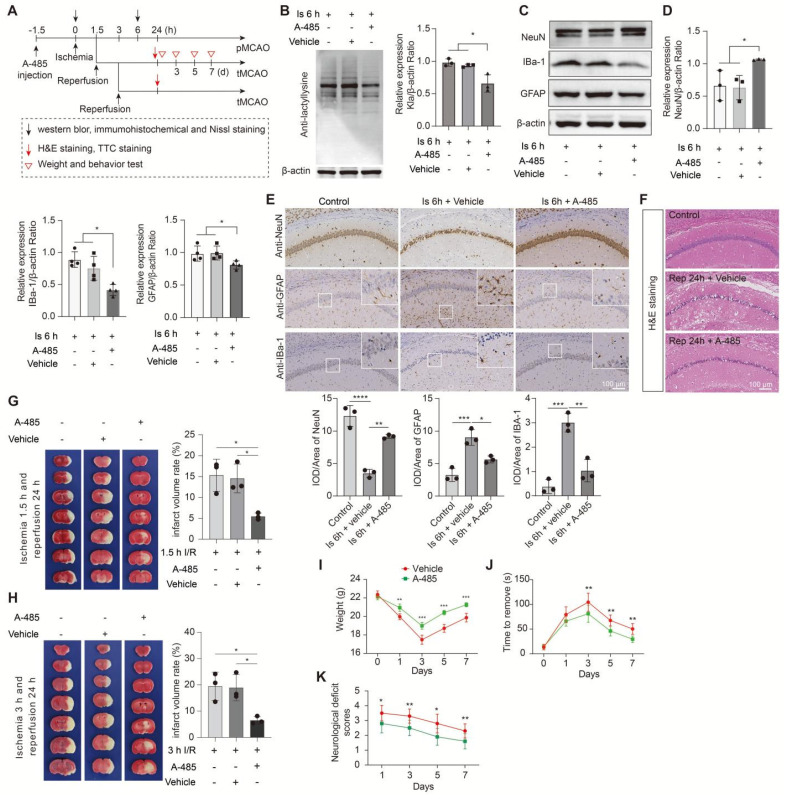
Aim: Although lactate supplementation at the reperfusion stage of ischemic stroke has been shown to offer neuroprotection, whether the role of accumulated lactate at the ischemia phase is neuroprotection or not remains largely unknown. Thus, in this study, we aimed to investigate the roles and mechanisms of accumulated brain lactate at the ischemia stage in regulating brain injury of ischemic stroke. Methods and Results: Pharmacological inhibition of lactate production by either inhibiting LDHA or glycolysis markedly attenuated the mouse brain injury of ischemic stroke. In contrast, additional lactate supplement further aggravates brain injury, which may be closely related to the induction of neuronal death and A1 astrocytes. The contributing roles of increased lactate at the ischemic stage may be related to the promotive formation of protein lysine lactylation (Kla), while the post-treatment of lactate at the reperfusion stage did not influence the brain protein Kla levels with neuroprotection. Increased protein Kla levels were found mainly in neurons by the HPLC-MS/MS analysis and immunofluorescent staining. Then, pharmacological inhibition of lactate production or blocking the lactate shuttle to neurons showed markedly decreased protein Kla levels in the ischemic brains. Additionally, Ldha specific knockout in astrocytes (Aldh1l1 CreERT2; Ldha fl/fl mice, cKO) mice with MCAO were constructed and the results showed that the protein Kla level was decreased accompanied by a decrease in the volume of cerebral infarction in cKO mice compared to the control groups. Furthermore, blocking the protein Kla formation by inhibiting the writer p300 with its antagonist A-485 significantly alleviates neuronal death and glial activation of cerebral ischemia with a reduction in the protein Kla level, resulting in extending reperfusion window and improving functional recovery for ischemic stroke. Conclusion: Collectively, increased brain lactate derived from astrocytes aggravates ischemic brain injury by promoting the protein Kla formation, suggesting that inhibiting lactate production or the formation of protein Kla at the ischemia stage presents new therapeutic targets for the treatment of ischemic stroke.

Keywords: brain injury; cerebral ischemia; glial activation; lactate; lactylation.


Conflict of interest statement

Competing Interests: The authors have declared that no competing interest exists.

Figures

Figure 1
Figure 1
Inhibition of brain lactate production attenuates brain injury after ischemic stroke. A, Experimental design and timeline of ischemic stroke, Oxamate treatment, and analysis in mice. pMCAO and tMCAO indicate permanent and transient middle cerebral artery occlusion, respectively. B-C, The ischemic brain levels of neuroglial markers of NeuN, GFAP, and IBa-1 were measured using western blot analysis of tissues at 6 h after cerebral ischemia after Oxamate preconditioning (n = 3-4). D, Representative images and statistical analysis of immunohistochemical staining show the expression levels of neuroglial markers of NeuN, GFAP, and IBa-1 in the ischemic hippocampus CA1 regions at 6 h after cerebral ischemia after Oxamate preconditioning (n = 3). E, Representative images of hematoxylin and eosin (H&E) staining show damage of the ischemic hippocampus CA1 regions at 24 h after reperfusion and 1.5 h of ischemia with Oxamate preconditioning (n = 3). F-G, Representative images of 2,3,5-triphenyltetrazolium chloride (TTC) staining of brain sections at 24 h after reperfusion and 1.5 h (F) and 3 h (G) after ischemia. The infarction area is white (n = 3). H-J, Mice with Oxamate preconditioning treatment and ischemic stroke show better functional recovery in tests of body weight (H), sensory neglect (I), and neurological deficit scores (J). n = 12. Two-way ANOVA with repeated measures reported a significant effect of treatment (P < 0.01) and time points (P < 0.01); the interaction between main effects was significant (P < 0.01). Scale bar = 100 μm. *P < 0.05, **P < 0.01, and ***P < 0.001.
Figure 2
Figure 2
Inhibition of the glycolytic pathway attenuates brain injury after ischemic stroke. A, Experimental design and timeline of ischemic stroke, 2DG treatment, and analysis in mice. pMCAO and tMCAO indicate permanent and transient middle cerebral artery occlusion, respectively. B-C, The ischemic brain levels of neuroglial markers of NeuN, GFAP, and IBa-1 were measured in the tissues using western blotting at 6 h post cerebral ischemia after 2DG preconditioning (n = 3-4). D, Representative images and statistical analysis of immunohistochemical staining show the expression levels of neuroglial markers of NeuN, GFAP, and IBa-1 in the ischemic hippocampus CA1 region at 6 h post cerebral ischemia after 2DG preconditioning (n = 3). E, Representative images of hematoxylin and eosin (H&E) staining show damage in the ischemic hippocampus CA1 region at 24 h of reperfusion after 1.5 h of ischemia with 2DG preconditioning (n = 3). F-G, Representative images of 2,3,5-triphenyltetrazolium chloride (TTC) staining in brain sections at 24 h of reperfusion after 1.5 h (F) and 3 h (G) of ischemia. The infarction area is white (n = 3). H-J, Mice with the 2DG preconditioning treatment and ischemic stroke show better functional recovery in tests of body weight (H), sensory neglect (I), and neurological deficit scores (J. n = 12. Two-way ANOVA with repeated measures reported a significant effect of treatment (P < 0.01) and time points (P < 0.01); the interaction between main effects was significant (P < 0.01). Scale bar = 100 μm. *P < 0.05, **P < 0.01 and ***P < 0.001.
Figure 3
Figure 3
Lactate supplementation before middle cerebral artery occlusion surgery exacerbates brain injury after ischemic stroke. A, Experimental design and timeline of ischemic stroke, lactate treatment, and analysis in mice. pMCAO and tMCAO indicate permanent and transient middle cerebral artery occlusion, respectively. B-C, The ischemic brain levels of neuroglial markers of NeuN, GFAP, and IBa-1 were measured using western blot analysis of the tissues at 6 h after cerebral ischemia (n = 3-4). D, Representative images and statistical analysis of immunohistochemical staining show the expression levels of neuroglial markers of NeuN, GFAP, and IBa-1 in the ischemic hippocampus CA1 regions at 6 h after cerebral ischemia (n = 3). E, Representative images and statistical analysis of Nissl staining in the ischemic hippocampus CA1 regions at 6 h after cerebral ischemia (n = 3). F, Hematoxylin and eosin (H&E) staining shows the damage of the ischemic hippocampus CA1 regions after 24 h of reperfusion and 1.5 h of ischemia with lactate preconditioning (n = 3). G, Representative images of 2,3,5-triphenyltetrazolium chloride (TTC) staining of brain sections after 24 h of reperfusion and 1.5 h of ischemia. The infarction area is white (n = 3). H-J Mice with lactate preconditioning treatment and ischemic stroke show poorer functional recovery in tests of body weight (H), sensory neglect (I), and neurological deficit scores (J). n = 12. Two-way ANOVA with repeated measures reported a significant effect of treatment (P < 0.01) and time points (P < 0.01); the interaction between main effects was significant (P < 0.01). Scale bar = 100 μm. *P < 0.05, **P < 0.01, ***P < 0.001 and ****P < 0.0001.
Figure 4
Figure 4
Transcriptome profiles of ischemic brain tissues from mice with or without lactate preconditioning treatment. A, Venn diagram showing overlapping and specifically upregulated differentially expressed genes (DEGs) of the lactate-treated and vehicle-treated ischemic brain tissues at 6 h after cerebral ischemia. B-C The Gene Ontology (GO) Biological Processes (B) and Kyoto Encyclopedia of Genes and Genomes (KEGG) (C) enrichment pathways of the lactate-treated specific upregulated DEGs. D-E, Heat map of reactive transcripts of microglia (D) and astrocytes (E) among sham, vehicle-treated, and lactate-treated ischemic mice. n = 4 for each group.
Figure 5
Figure 5
Protein lactylation profiles of brains after ischemic stroke. A, Schematic of the experimental strategy used to identify the proteome and lactylproteome changes in brains induced by cerebral ischemia and reperfusion. B, The number of significantly changed lactylations of proteins at different times. P < 0.05; Student's t-test. C, Gene Ontology (GO) biological process (BP) enrichment analysis of significantly different expressions of protein lactylation in brains with ischemia and reperfusion. P < 0.05; two-tailed Fisher's exact test. D, The pie charts show the major cellular distributions of significantly changed lactylation modifications of proteins induced by ischemia (right) and reperfusion (left). Significant changes in lactylated proteins (P < 0.05; Student's t-test) were matched with the relatively high-expression genes of neural cells (gene expression of one of the four neural cell types was higher than that of the others) from the published transcriptome data . E, Three-dimensional scatter plots show some significantly changed lactylated proteins that are mainly distributed into neurons. Significantly changed lactylated proteins (P < 0.05; Student's t-test) were matched with the relatively specific higher-expression genes of neural cells (gene expression of one of the four neural cell types was five-times higher than that of the other cellular types) from the published transcriptome data . F GO-BP enrichment analysis of the significantly changed lactylated proteins mainly distributed into neurons (E). n = 3 for each group.
Figure 6
Figure 6
Regulation of brain lactate levels significantly alters protein lactylation levels of ischemic brain tissue. A, Preconditioning D-lactate and L-lactate intracerebroventricularly (i.c.v.) administered treatments increased the protein lactylation levels of ischemic brain tissues at 6 h after cerebral ischemia (n = 3). B, Lactate levels in the ischemic brain at 6 h after cerebral ischemia were measured after preconditioning D-lactate and L-lactate treatments administered via ICV injection (n = 4). C, Lactate levels in the ischemic brain at 6 h after cerebral ischemia were measured after preconditioning 2DG, oxamate, and 4-CIN treatments administered via intraperitoneal and ICV injection, respectively (n = 3-5). D-F, Preconditioning 2DG (D), Oxamate (E), and 4-CIN (F) treatments administered via intraperitoneal and ICV injection, respectively, markedly reduce the protein lactylation levels of ischemic brain tissues at 6 h after cerebral ischemia (n = 3-4). *P < 0.05, **P < 0.01; n.s. indicates a non-significant difference.
Figure 7
Figure 7
Aldh1l1CreERT2; Ldhafl/fl mice showed better outcomes of ischemic stroke. A, Lactate levels in the ischemic brain at 6 h were measured in cKO and flox mice (n = 4). B, Aldh1l1CreERT2; Ldhafl/fl mice show decreased protein lactylation levels of ischemic brain tissues at 6 h after cerebral ischemia (n = 3). C, Representative images of 2,3,5-triphenyltetrazolium chloride (TTC) staining of brain sections at 1.5 h after ischemia and 24 h after reperfusion. The infarction area is white (n = 3). D, Representative image of colocalization staining with GFAP+ astrocytes (green) and C3 (red) in cortex of ischemic cKO mice compared to ischemic flox mice. E, Statistic analysis of the percentage of the GFAP+C3+/GFAP+ cells and number of GFAP+C3+ cells per field in cortex of ischemic cKO mice compared to ischemic flox mice. F, Representative image of colocalization staining with GFAP+ astrocytes (green) and C3 (red) in CA1 region of hippocampus of ischemic cKO mice compared to ischemic flox mice. G, Statistic analysis of the percentage of the GFAP+C3+/GFAP+ cells and number of GFAP+C3+ cells per field in CA1 region of hippocampus of ischemic cKO mice compared to ischemic flox mice. Scale bar = 100 μm for the (C) upper and 20 μm for the (C) lower. **P < 0.01.
Figure 8
Figure 8
Inhibition of the formation of protein lactylation attenuates brain injury after ischemic stroke. A, Experimental design and timeline of ischemic stroke, A-485 treatment, and analysis in mice. B, Representative images of western blot analysis show whole protein lactylation levels of ischemic brain tissues at 6 h after cerebral ischemia (n = 3). C-D, The ischemic brain levels of neuroglial markers of NeuN, GFAP, and IBa-1 were measured using western blot analysis of tissues at 6 h after cerebral ischemia and A-485 preconditioning (n = 3-4). E, Representative images and statistical analysis of immunohistochemical staining show the expression levels of neuroglial markers of NeuN, GFAP, and IBa-1 in the ischemic hippocampus CA1 regions at 6 h after cerebral ischemia and A-485 preconditioning (n = 3). F, Hematoxylin and eosin (H&E) staining show damage of the ischemic hippocampus CA1 regions at 24 h after reperfusion and 1.5 h of ischemia with A-485 preconditioning (n = 3). G-H, Representative images of 2,3,5-triphenyltetrazolium chloride (TTC) staining of brain sections at 24 h after reperfusion and 1.5 h (G) and 3 h (H) after ischemia. The infarction area is white (n = 3). I-K Mice treated with A-485 preconditioning and ischemic stroke show better functional recovery in tests of body weight (I), sensory neglect (J), and neurological deficit scores (K). n = 12. Two-way ANOVA with repeated measures reported a significant effect of treatment (P < 0.01), the interaction between main effects was also significant (P < 0.01). Scale bar = 100 μm. *P < 0.05, **P < 0.01, ***P < 0.001 and ****P < 0.0001.

References

    1. Magistretti PJ, Allaman I. Lactate in the brain: from metabolic end-product to signalling molecule. Nat Rev Neurosci. 2018;19:235–49. - PubMed
    1. Allaman I, Magistretti P, Squire L, Berg D, Bloom F, du Lac S, Fundamental Neuroscience. Elsevier Amsterdam, The Netherlands. 2013.
    1. Vrselja Z, Daniele SG, Silbereis J, Talpo F, Morozov YM, Sousa AMM. et al. Restoration of brain circulation and cellular functions hours post-mortem. Nature. 2019;568:336–43. - PMC - PubMed
    1. Michenfelder JD, Sundt TM Jr. Cerebral ATP and lactate levels in the squirrel monkey following occlusion of the middle cerebral artery. Stroke. 1971;2:319–26. - PubMed
    1. Wang J, Cui Y, Yu Z, Wang W, Cheng X, Ji W. et al. Brain Endothelial Cells Maintain Lactate Homeostasis and Control Adult Hippocampal Neurogenesis. Cell Stem Cell. 2019;25:754–67. e759. - PubMed

Publication types