

Stimulation by exosomes from hypoxia-preconditioned hair follicle mesenchymal stem cells facilitates mitophagy by inhibiting the PI3K/AKT/mTOR signaling pathway to alleviate ulcerative colitis
- PMID: 39113800
- PMCID: PMC11303078
- DOI: 10.7150/thno.96038
Stimulation by exosomes from hypoxia-preconditioned hair follicle mesenchymal stem cells facilitates mitophagy by inhibiting the PI3K/AKT/mTOR signaling pathway to alleviate ulcerative colitis
Abstract
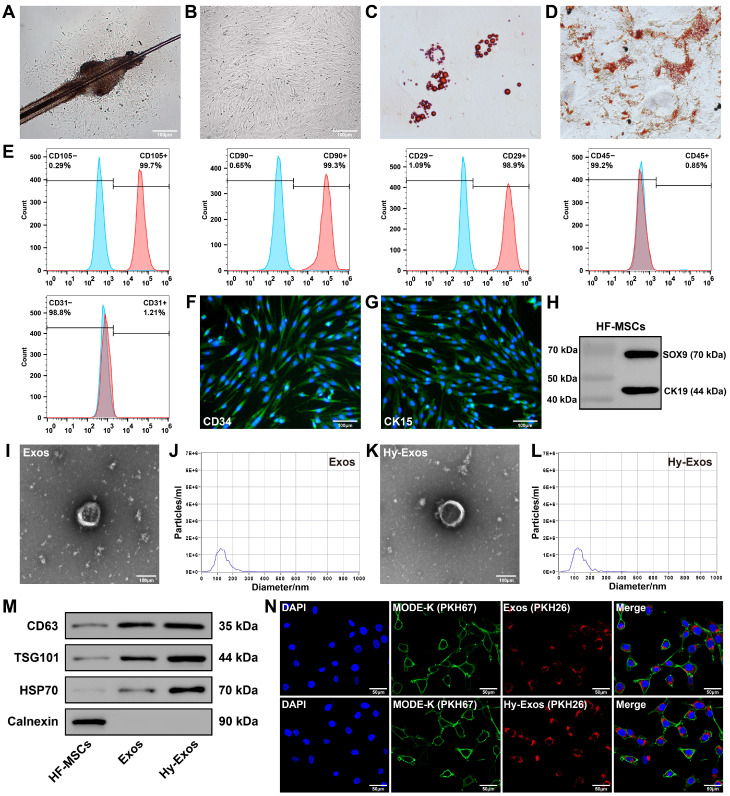
Background: Ulcerative colitis (UC) is an intestinal inflammatory disease that is strongly associated with mitochondrial damage and dysfunction as well as mitophagy and lacks of satisfactory treatments. Hair follicle mesenchymal stem cell (HF-MSC)-derived exosomes owe benefit effectiveness on inflammatory therapies. Hypoxia-preconditioned HF-MSCs exhibit enhanced proliferation and migration abilities, and their exosomes exert stronger effects than normal exosomes. However, the therapeutic function of Hy-Exos in UC is unknown. Methods: The inflammation model was established with LPS-treated MODE-K cells, and the mouse UC model was established by dextran sulfate sodium (DSS) administration. The therapeutic effects of HF-MSC-derived exosomes (Exos) and hypoxia-preconditioned HF-MSC-derived exosomes (Hy-Exos) were compared in vitro and in vivo. Immunofluorescence staining and western blotting were used to explore the effects of Hy-Exos on mitochondrial function, mitochondrial fission and fusion and mitophagy. MiRNA sequencing analysis was applied to investigate the differences in components between Exos and Hy-Exos. Results: Hy-Exos had a better therapeutic effect on LPS-treated MODE-K cells and DSS-induced UC mice. Hy-Exos promoted colonic tight junction proteins expression, suppressed the oxidative stress response, and reduced UC-related inflammatory injury. Hy-Exos may exert these effects via miR-214-3p-mediated inhibition of the PI3K/AKT/mTOR signaling pathway, maintenance of mitochondrial dynamic stability, alleviation of mitochondrial dysfunction and enhancement of mitophagy. Conclusion: This study revealed a vital role for Hy-Exos in suppressing inflammatory progression in UC and suggested that miR-214-3p is a potential critical target for Hy-Exos in alleviating UC.
Keywords: Exosome; Hair follicle mesenchymal stem cell; Mitophagy; PI3K/AKT/mTOR signaling pathway; Ulcerative colitis.
© The author(s).
Conflict of interest statement
Competing Interests: The authors have declared that no competing interest exists.
Figures


Similar articles
-
From Hair to Colon: Hair Follicle-Derived MSCs Alleviate Pyroptosis in DSS-Induced Ulcerative Colitis by Releasing Exosomes in a Paracrine Manner.Oxid Med Cell Longev. 2022 Sep 16;2022:9097530. doi: 10.1155/2022/9097530. eCollection 2022. Oxid Med Cell Longev. 2022. PMID: 36160717 Free PMC article.
-
Exploring the molecular mechanisms of MSC-derived exosomes in Alzheimer's disease: Autophagy, insulin and the PI3K/Akt/mTOR signaling pathway.Biomed Pharmacother. 2024 Jul;176:116836. doi: 10.1016/j.biopha.2024.116836. Epub 2024 Jun 7. Biomed Pharmacother. 2024. PMID: 38850660
-
Exosome-shuttled miR-150-5p from LPS-preconditioned mesenchymal stem cells down-regulate PI3K/Akt/mTOR pathway via Irs1 to enhance M2 macrophage polarization and confer protection against sepsis.Front Immunol. 2024 Jun 18;15:1397722. doi: 10.3389/fimmu.2024.1397722. eCollection 2024. Front Immunol. 2024. PMID: 38957471 Free PMC article.
-
The therapeutic potential of stem cell-derived exosomes in the ulcerative colitis and colorectal cancer.Stem Cell Res Ther. 2022 Apr 1;13(1):138. doi: 10.1186/s13287-022-02811-5. Stem Cell Res Ther. 2022. PMID: 35365226 Free PMC article. Review.
-
Paeoniflorin promotes intestinal stem cell-mediated epithelial regeneration and repair via PI3K-AKT-mTOR signalling in ulcerative colitis.Int Immunopharmacol. 2023 Jun;119:110247. doi: 10.1016/j.intimp.2023.110247. Epub 2023 May 7. Int Immunopharmacol. 2023. PMID: 37159966 Review.
Cited by
-
Exosomes derived from MSCs exposed to hypoxic and inflammatory environments slow intervertebral disc degeneration by alleviating the senescence of nucleus pulposus cells through epigenetic modifications.Bioact Mater. 2025 Mar 20;49:515-530. doi: 10.1016/j.bioactmat.2025.02.046. eCollection 2025 Jul. Bioact Mater. 2025. PMID: 40206196 Free PMC article.
-
Clarifying the role of exosomal miR-137-3p in endometrial regeneration: Mechanistic gaps and future directions.World J Stem Cells. 2025 Jun 26;17(6):109283. doi: 10.4252/wjsc.v17.i6.109283. World J Stem Cells. 2025. PMID: 40585957 Free PMC article.
-
Endothelial MicroRNA-214 Confers Angiotensin II Hypertension by Targeting eNOS in Mice.Kidney Blood Press Res. 2025;50(1):442-459. doi: 10.1159/000546674. Epub 2025 May 30. Kidney Blood Press Res. 2025. PMID: 40451155 Free PMC article.
-
Recent Progress in Nano-TCM Active Ingredient Co-Delivery Systems for Inflammation-Mediated Diseases.Int J Nanomedicine. 2025 Aug 2;20:9573-9596. doi: 10.2147/IJN.S526731. eCollection 2025. Int J Nanomedicine. 2025. PMID: 40771757 Free PMC article. Review.
-
Exosomes from human umbilical cord mesenchymal stem cells promote the growth of human hair dermal papilla cells.PLoS One. 2025 Apr 30;20(4):e0320154. doi: 10.1371/journal.pone.0320154. eCollection 2025. PLoS One. 2025. PMID: 40305498 Free PMC article.
References
MeSH terms
Substances
LinkOut - more resources
Full Text Sources
Medical
Research Materials
Miscellaneous
