. 2024 Jul 15;14(7):3348-3371.
doi: 10.62347/TTNY4279. eCollection 2024.

Glypican-3 deficiency in liver cancer upregulates MAPK/ERK pathway but decreases cell proliferation

Affiliations

Glypican-3 deficiency in liver cancer upregulates MAPK/ERK pathway but decreases cell proliferation

Joon-Yong Chung et al. Am J Cancer Res. .

Abstract

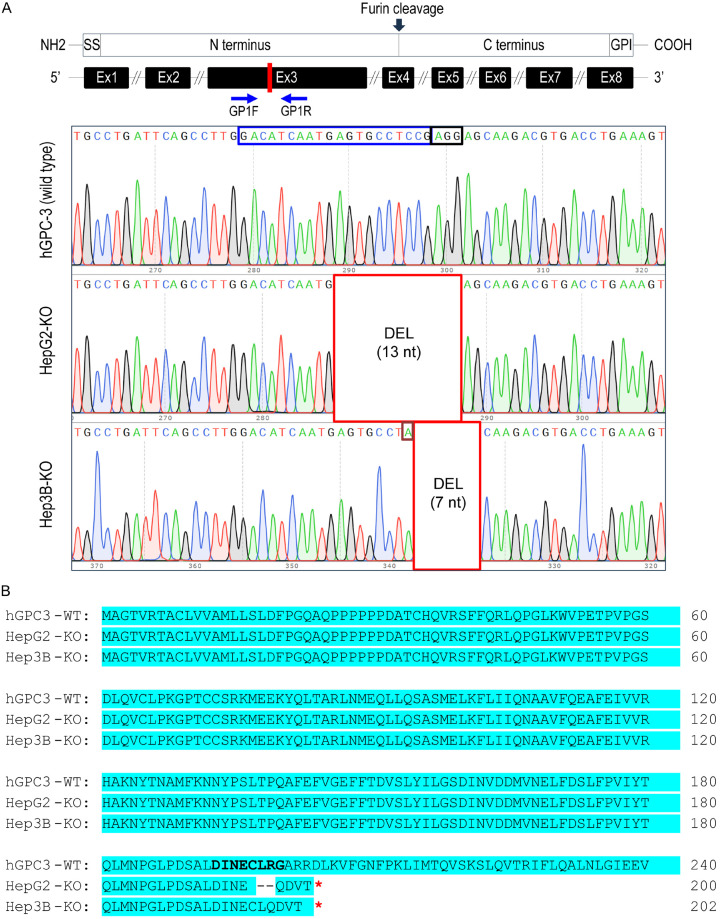
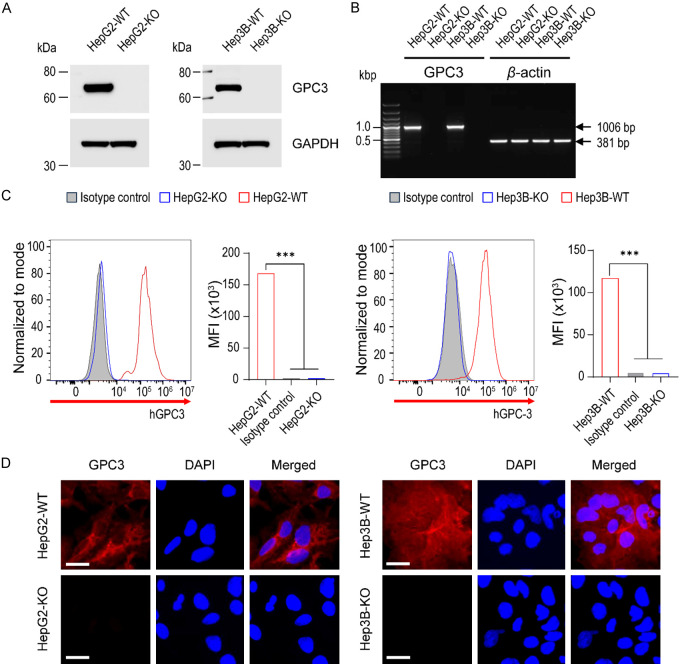
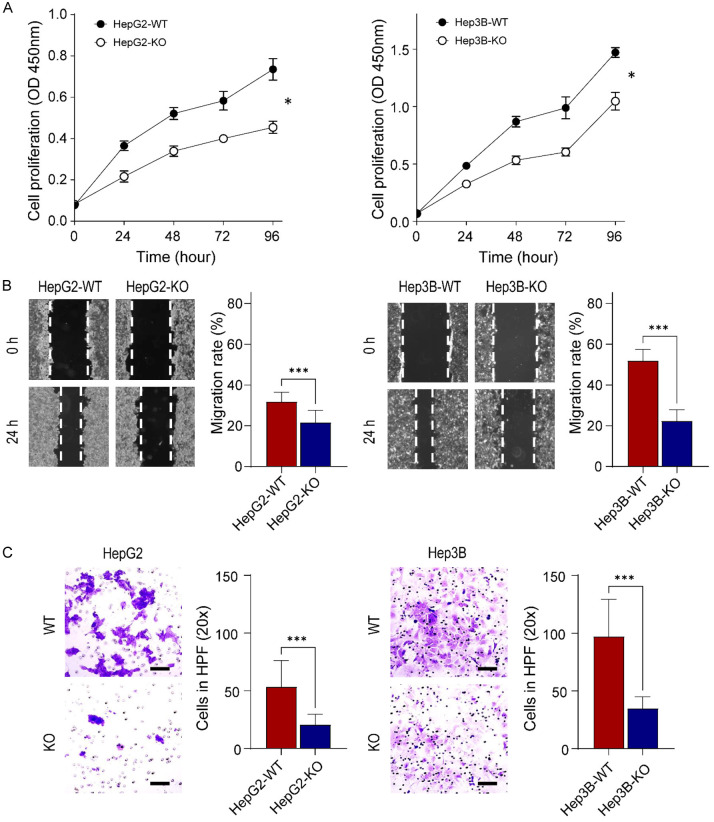
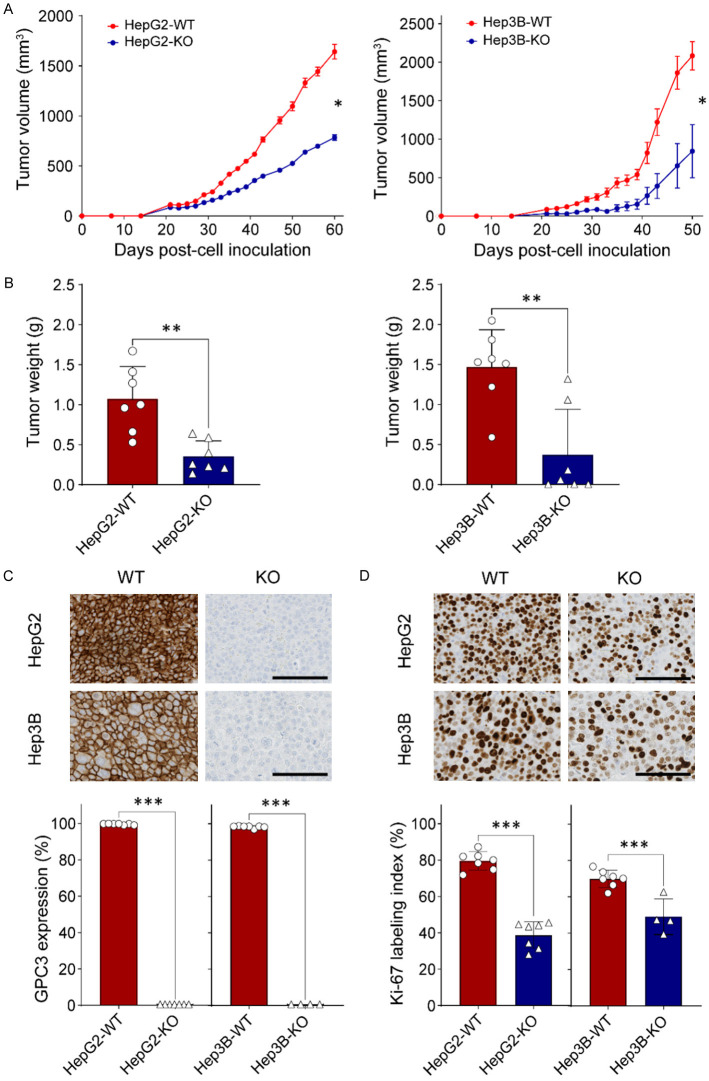
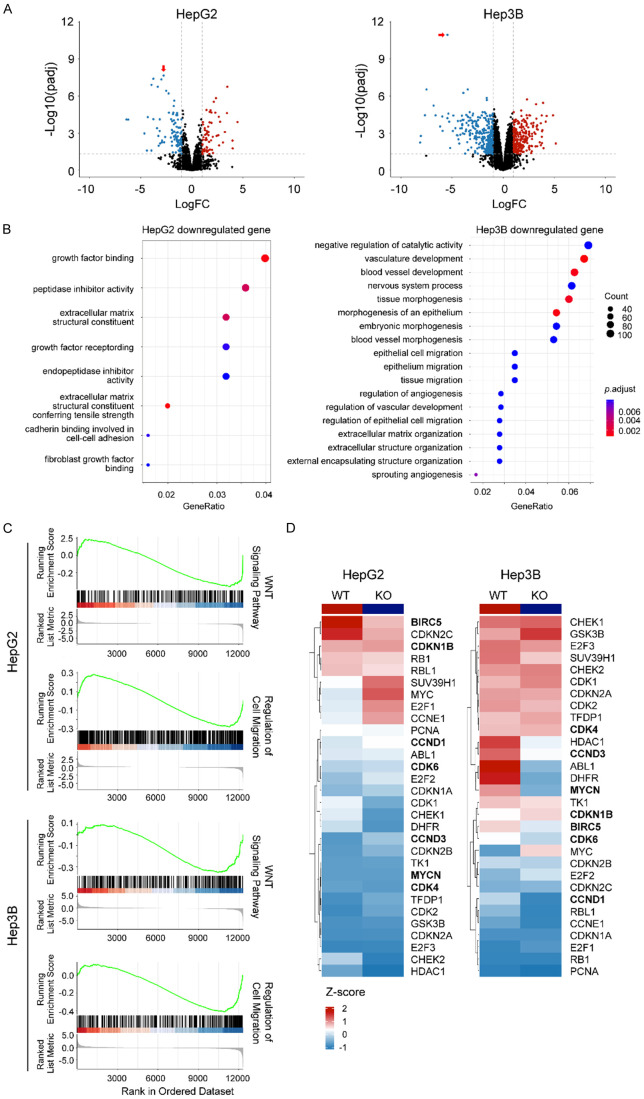
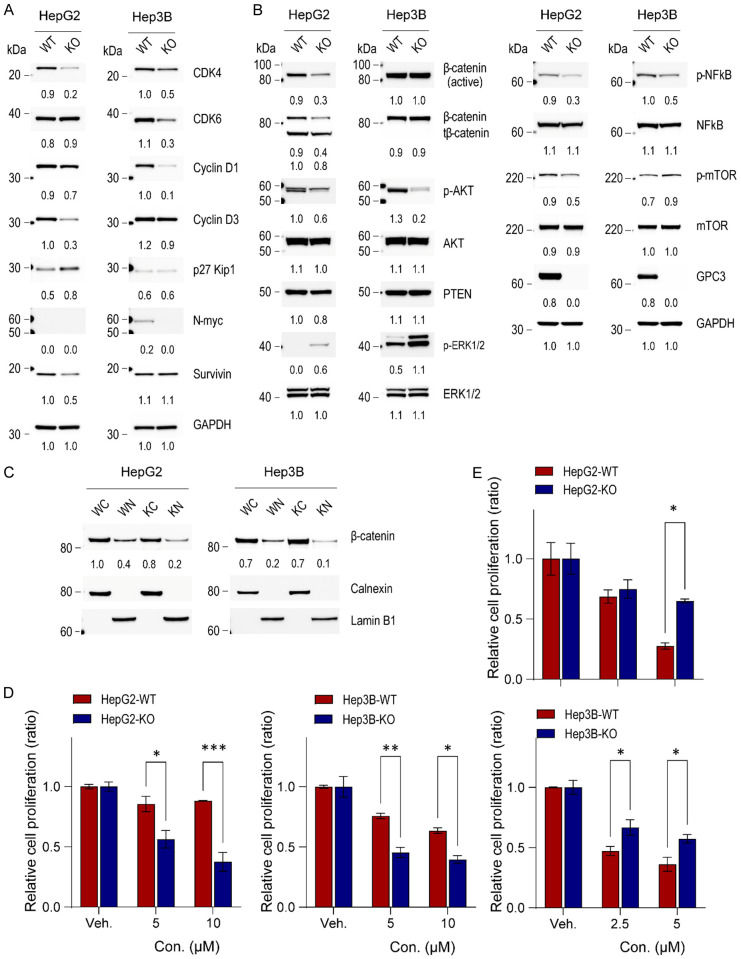
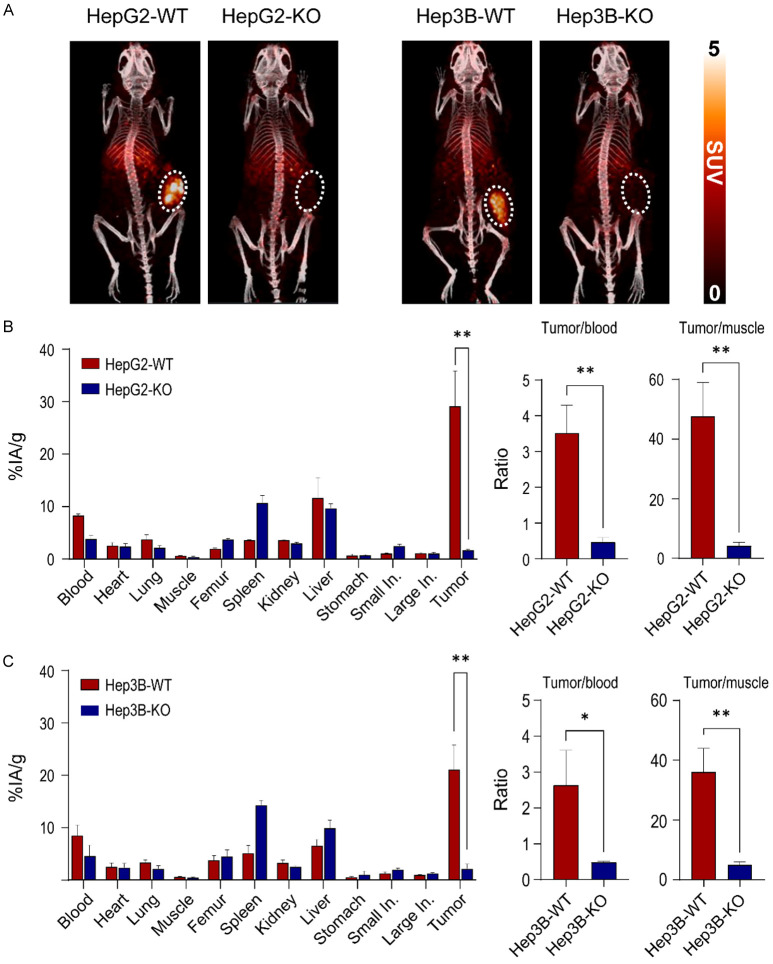
Glypican-3 (GPC3) is overexpressed in hepatocellular carcinomas and hepatoblastomas and represents an important therapeutic target but the biologic importance of GPC3 in liver cancer is unclear. To date, there are limited data characterizing the biological implications of GPC3 knockout (KO) in liver cancers that intrinsically express this target. Here, we report on the development and characterization of GPC3-KO liver cancer cell lines and compare to them to parental lines. GPC3-KO variants were established in HepG2 and Hep3B liver cancer cell lines using a lentivirus-mediated CRISPR/Cas9 system. We assessed the effects of GPC3 deficiency on oncogenic properties in vitro and in murine xenograft models. Downstream cellular signaling pathway changes induced by GPC3 deficiency were examined by RNAseq and western blot. To confirm the usefulness of the models for GPC3-targeted drug development, we evaluated the target engagement of a GPC3-selective antibody, GC33, conjugated to the positron-emitting zirconium-89 (89Zr) in subcutaneous murine xenografts of wild type (WT) and KO liver cancer cell lines. Deletion of GPC3 significantly reduced liver cancer cell proliferation, migration, and invasion compared to the parental cell lines. Additionally, the tumor growth of GPC3-KO liver cancer xenografts was significantly slower compared with control xenografts. RNA sequencing analysis also showed GPC3-KO resulted in a reduction in the expression of genes associated with cell cycle regulation, invasion, and migration. Specifically, we observed the downregulation of components in the AKT/NFκB/WNT signaling pathways and of molecules related to cell cycle regulation with GPC3-KO. In contrast, pMAPK/ERK1/2 was upregulated, suggesting an adaptive compensatory response. KO lines demonstrated increased sensitivity to ERK (GDC09994), while AKT (MK2206) inhibition was more effective in WT lines. Using antibody-based positron emission tomography (immunoPET) imaging, we confirmed that 89Zr-GC33 accumulated exclusively in GPC3-expression xenografts but not in GPC3-KO xenografts with high tumor uptake and tumor-to-liver signal ratio. We show that GPC3-KO liver cancer cell lines exhibit decreased tumorigenicity and altered signaling pathways, including upregulated pMAPK/ERK1/2, compared to parental lines. Furthermore, we successfully distinguished between GPC3+ and GPC3- tumors using the GPC3-targeted immunoPET imaging agent, demonstrating the potential utility of these cell lines in facilitating GPC3-selective drug development.

Keywords: Hepatocellular carcinoma; MAPK/ERK pathway; codrituzumab; glypican-3; hepatoblastoma; invasion; migration; molecular imaging; proliferation; radiopharmaceutical therapy.


Conflict of interest statement

None.

Figures

Figure 1
Figure 1
Generation of GPC3 knockout (KO) liver cancer cell lines using CRISPR-Cas9. A. Schematic representation of the genomic structure of GPC3 with the engineered exon site highlighted in red (Exon 3). The gRNA region (blue box) and PAM region (black box) were amplified using the GP1F and GP1R primer set, and the resulting DNA was sequenced. In HepG2-KO, a 13-nt deletion was observed, while in Hep3B-KO, a 7-nt deletion accompanied by a single nucleotide mutation (burgundy box) was identified compared to the wild type. B. Alignment of the amino acid sequences of partial human GPC3 and the two GPC3-KO proteins, presented in the one-letter code. Protein synthesis in the KO cells was terminated by a stop codon (indicated by a red-colored asterisk in the box). Open reading frames are highlighted in cyan, and amino acid sequences corresponding to the sgRNA-targeted regions are shown in bold letters.
Figure 2
Figure 2
Confirmation of GPC3 knockout at the transcriptional and translational level. A. Western blots of cell lysates extracted from parental and GPC3-KO cells. Endogenous GPC3 protein was detected by the protein-specific antibody in parental cells, whereas protein loss was confirmed in the KO cells. GAPDH was used as the internal control. B. RT-PCR analysis of parental and GPC3 knockout HepG2 and Hep3B cell lines. Successful knockout of the GPC3 gene was confirmed in the KO cell lines. Beta-actin was used as the internal control. C. Analytical flow cytometry of surface GPC3 expression on parental and GPC3-KO cells. Parental HepG2 and Hep3B cells (red line) expressed GPC3, while KO cells (blue line) lacked intact GPC3 expression. Data are presented as the mean fluorescence intensity (MFI). Mouse immunoglobulin G1 (IgG1, grey-filled area) served as the isotype control. Differences in MFI were statistically tested using ANOVA. ***, P<0.001. D. Immunofluorescence staining with GPC3 (in red) and DAPI (in blue) on parental and GPC3 knockout HepG2 and Hep3B cells. Highly expressed GPC3 in parental cells was completely knocked out in HepG2 and HepG2-KO clones. The bottom panel shows immunofluorescence with the isotype negative control. Scale bars are shown for 20 µm.
Figure 3
Figure 3
Effect of GPC3 ablation on liver cancer cell growth, migration, and cell invasion. A. Cell growth rate of parental and GPC3-KO cells. Cell proliferation was measured using the BrdU cell proliferation assay kit after 24, 48, 72, and 96 h. The left panel represents HepG2, and the right panel represents Hep3B. The cell growth rate was significantly reduced by GPC3 deficiency in both HepG2 and Hep3B. B. Scratch wound healing assay demonstrates a significant decrease in the rate of wound healing in GPC3-KO cells compared to the wild-type liver cancer cells. C. Cell invasion was significantly inhibited after the knockout of GPC3 expression. Invading cells were assessed by counting cells in five random high-power fields (HPFs). Scale bars are shown for 100 µm. All experiments were performed in triplicate, and error bars represent standard deviations from the mean. Differences in cell growth and migration rates were statistically tested using the t-test. *, P<0.05; ***, P<0.001.
Figure 4
Figure 4
Impact of GPC3 deficiency in liver cancer cells in a xenograft mouse model. A. Comparison of in vivo tumor growth between parental and GPC3 knockout (KO) cells. Five million parental (HepG2 & Hep3B) and GPC3-KO cells were subcutaneously inoculated into BALB/c athymic nu/nu mice, with each group comprising n=7 mice. The values represent the mean ± standard error (SE). B. Tumor weights of xenograft tumors derived from wild-type HepG2, GPC3-KO HepG2, wild-type Hep3B, and GPC3-KO Hep3B cells. The data represents the mean ± standard deviation (SD). C. Immunohistochemical staining for GPC3 in xenograft tumor tissues. Digital analysis using Visiopharm software categorized staining intensity as negative or positive based on intensity. The final score was calculated as the mean positive ratio from six randomly selected different regions of the tumor section. D. Immunohistochemical staining for Ki-67 in xenograft tumor tissues. The Ki-67 expression index represents the mean percentage of positively stained cells from six representative regions of the xenograft tumor section. The data represent the mean ± SD. Statistical significance in experimental values was determined using the t-test. *, P<0.05; ***, P<0.001.
Figure 5
Figure 5
Transcriptional effects of GPC3 knockout in HepG2 and Hep3B cells. A. Volcano plot showing differential gene expression upon GPC3 knockout using CRISPR/Cas9 in HepG2 and Hep3B cell lines. Plot depicts log2 fold change vs. -log10 False discovery-corrected p-value (FDR) for individual genes. Downregulated genes are represented in blue and upregulated genes are represented in red. GPC3 is represented with red arrow. B. Plot showing enriched KEGG pathway and gene ontology, biological process (GO BP) terms in genes downregulated upon GPC3 knockout, relative to parental liver cancer cell lines. Gene ratio indicates proportion of the GO/KEGG term containing query genes, dot size indicates number of query genes in the GO term, and color indicates the false-discovery rate corrected/adjusted p-value. C. Gene set enrichment analysis (GSEA) of RNA sequencing data from HepG2 and Hep3B cells with GPC3-KO. Results show representative GSEA plots and tables of top enriched GO BP gene sets downregulated in GPC3-KO cells. D. Heatmap representation of cell cycle related genes upon GPC3-KO.
Figure 6
Figure 6
Impact of GPC3 knockout on cellular signaling in liver cancer cells. (A) Western blot analysis of cell-cycle related molecules, (B) signaling pathways, and (C) cytoplasmic and nuclear protein fractions in HepG2 and Hep3B parental and GPC3 knockout cells. The numerical values beneath the blot images represent the expression levels measured as fold-change. The cytoplasmic proteins were normalized using anti-calnexin antibody, while the nuclear proteins were normalized using anti-lamin B1 as a loading control. WC, wildtype cytoplasmic fraction; WN, wildtype nuclear fraction; KC, GPC3 knockout cytoplasmic fraction; KN, GPC3 knockout nuclear fraction. Additionally, the impacts of ERK and AKT inhibitors on HepG2 and Hep3B parental and GPC3 knockout cells was investigated. Cells were seeded at 2 × 10⁵ cells and then treated with GDC0994 (ERK inhibitor, 5 and 10 µM) (D) or MK2206 (AKT inhibitor, 2.5 and 5 µM) (E) after 24 h. Viable cell numbers were counted on day 2. The data are presented as the mean ± SD. Differences in cell viability were statistically assessed using the t-test. *, P<0.05; **, P<0.01; ***, P<0.001.
Figure 7
Figure 7
Validation of GPC3 knockout by GPC3-targeted immunoPET imaging and biodistribution in xenograft models. A. Representative MIP-PET/CT images of 89Zr-DFO-GC33 in HepG2 xenografts (WT and KO) and Hep3B xenografts (WT and KO) at 72 h post-injection (n=3, respectively). The tumor is indicated by white dotted circles. PET images display radioactivity calibrated in standardized uptake values (SUV). B. Biodistribution data of 89Zr-DFO-GC33 in the major organs of HepG2-WT and HepG2-KO xenografts at 72 h post-injection. Comparison of tumor-to-blood ratio and tumor-to-muscle ratio of 89Zr-DFO-GC33 at 72 h post-injection between HepG2-WT and HepG2-KO xenografts. Data are present as the mean ± SD (n=3, respectively). C. Biodistribution data of 89Zr-DFO-GC33 in the major organs of Hep3B-WT and Hep3B-KO xenografts at 72 h post-injection. Comparison of tumor-to-blood ratio and tumor-to-muscle ratio of 89Zr-DFO-GC33 at 72 h post-injection between Hep3B-WT and Hep3B-KO xenografts. Data are presented as the mean ± SD (n=3, respectively). Radioactivity uptakes in biodistribution were calculated as the percentage of the injected activity per gram of tissue (%IA/g). Statistical significance in biodistribution data and tumor-to-organ ratio calculation was determined by the t-test. A p-values of <0.05 was considered statistically significant: *, P<0.05; **, P<0.01.

Similar articles

Cited by

References

    1. Sung H, Ferlay J, Siegel RL, Laversanne M, Soerjomataram I, Jemal A, Bray F. Global cancer statistics 2020: GLOBOCAN estimates of incidence and mortality worldwide for 36 cancers in 185 countries. CA Cancer J Clin. 2021;71:209–249. - PubMed
    1. McGlynn KA, Petrick JL, El-Serag HB. Epidemiology of hepatocellular carcinoma. Hepatology. 2021;73(Suppl 1):4–13. - PMC - PubMed
    1. Siegel RL, Miller KD, Wagle NS, Jemal A. Cancer statistics, 2023. CA Cancer J Clin. 2023;73:17–48. - PubMed
    1. Bernfield M, Gotte M, Park PW, Reizes O, Fitzgerald ML, Lincecum J, Zako M. Functions of cell surface heparan sulfate proteoglycans. Annu Rev Biochem. 1999;68:729–777. - PubMed
    1. Filmus J, Capurro M, Rast J. Glypicans. Genome Biol. 2008;9:224. - PMC - PubMed

LinkOut - more resources