Based on machine learning, CDC20 has been identified as a biomarker for postoperative recurrence and progression in stage I & II lung adenocarcinoma patients
- PMID: 39114311
- PMCID: PMC11303833
- DOI: 10.3389/fonc.2024.1351393
Based on machine learning, CDC20 has been identified as a biomarker for postoperative recurrence and progression in stage I & II lung adenocarcinoma patients
Abstract
Objective: By utilizing machine learning, we can identify genes that are associated with recurrence, invasion, and tumor stemness, thus uncovering new therapeutic targets.
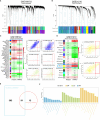
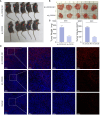
Methods: To begin, we obtained a gene set related to recurrence and invasion from the GEO database, a comprehensive gene expression database. We then employed the Weighted Gene Co-expression Network Analysis (WGCNA) to identify core gene modules and perform functional enrichment analysis on them. Next, we utilized the random forest and random survival forest algorithms to calculate the genes within the key modules, resulting in the identification of three crucial genes. Subsequently, one of these key genes was selected for prognosis analysis and potential drug screening using the Kaplan-Meier tool. Finally, in order to examine the role of CDC20 in lung adenocarcinoma (LUAD), we conducted a variety of in vitro and in vivo experiments, including wound healing assay, colony formation assays, Transwell migration assays, flow cytometric cell cycle analysis, western blotting, and a mouse tumor model experiment.
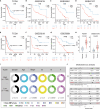
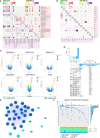
Results: First, we collected a total of 279 samples from two datasets, GSE166722 and GSE31210, to identify 91 differentially expressed genes associated with recurrence, invasion, and stemness in lung adenocarcinoma. Functional enrichment analysis revealed that these key gene clusters were primarily involved in microtubule binding, spindle, chromosomal region, organelle fission, and nuclear division. Next, using machine learning, we identified and validated three hub genes (CDC45, CDC20, TPX2), with CDC20 showing the highest correlation with tumor stemness and limited previous research. Furthermore, we found a close association between CDC20 and clinical pathological features, poor overall survival (OS), progression-free interval (PFI), progression-free survival (PFS), and adverse prognosis in lung adenocarcinoma patients. Lastly, our functional research demonstrated that knocking down CDC20 could inhibit cancer cell migration, invasion, proliferation, cell cycle progression, and tumor growth possibly through the MAPK signaling pathway.
Conclusion: CDC20 has emerged as a novel biomarker for monitoring treatment response, recurrence, and disease progression in patients with lung adenocarcinoma. Due to its significance, further research studying CDC20 as a potential therapeutic target is warranted. Investigating the role of CDC20 could lead to valuable insights for developing new treatments and improving patient outcomes.
Keywords: CDC20; invasion; lung adenocarcinoma; machine learning; recurrence.
Copyright © 2024 Miao, Xu, Han, Liu, Zhou, Guo, Xing, Bai, He, Wu, Wang and Hu.
Conflict of interest statement
The authors declare that the research was conducted in the absence of any commercial or financial relationships that could be construed as a potential conflict of interest.
Figures


Similar articles
-
Elevated mRNA Levels of AURKA, CDC20 and TPX2 are associated with poor prognosis of smoking related lung adenocarcinoma using bioinformatics analysis.Int J Med Sci. 2018 Nov 5;15(14):1676-1685. doi: 10.7150/ijms.28728. eCollection 2018. Int J Med Sci. 2018. PMID: 30588191 Free PMC article.
-
RACGAP1 promotes the progression and poor prognosis of lung adenocarcinoma through its effects on the cell cycle and tumor stemness.BMC Cancer. 2024 Jan 2;24(1):7. doi: 10.1186/s12885-023-11761-x. BMC Cancer. 2024. PMID: 38167018 Free PMC article.
-
mRNAsi Index: Machine Learning in Mining Lung Adenocarcinoma Stem Cell Biomarkers.Genes (Basel). 2020 Feb 27;11(3):257. doi: 10.3390/genes11030257. Genes (Basel). 2020. PMID: 32121037 Free PMC article.
-
Identification of CDC20 as a Novel Biomarker in Diagnosis and Treatment of Wilms Tumor.Front Pediatr. 2021 Aug 26;9:663054. doi: 10.3389/fped.2021.663054. eCollection 2021. Front Pediatr. 2021. PMID: 34513754 Free PMC article.
-
Stemness Related Genes Revealed by Network Analysis Associated With Tumor Immune Microenvironment and the Clinical Outcome in Lung Adenocarcinoma.Front Genet. 2020 Sep 16;11:549213. doi: 10.3389/fgene.2020.549213. eCollection 2020. Front Genet. 2020. PMID: 33193623 Free PMC article.
Cited by
-
Molecular signatures bidirectionally link myocardial infarction and lung cancer.Front Med (Lausanne). 2025 Apr 9;12:1576375. doi: 10.3389/fmed.2025.1576375. eCollection 2025. Front Med (Lausanne). 2025. PMID: 40270498 Free PMC article.
-
Exploration of telomere-related biomarkers for lung adenocarcinoma and targeted drug prediction.Discov Oncol. 2025 Feb 10;16(1):148. doi: 10.1007/s12672-025-01847-2. Discov Oncol. 2025. PMID: 39928198 Free PMC article.
-
Effectiveness of Artificial Intelligence Models in Predicting Lung Cancer Recurrence: A Gene Biomarker-Driven Review.Cancers (Basel). 2025 Jun 5;17(11):1892. doi: 10.3390/cancers17111892. Cancers (Basel). 2025. PMID: 40507370 Free PMC article. Review.
References
LinkOut - more resources
Full Text Sources
Miscellaneous

