. 2024 Jul 24:18:1401571.
doi: 10.3389/fnins.2024.1401571. eCollection 2024.

Retinal debris triggers cytotoxic damage in cocultivated primary porcine RPE cells

Affiliations

Retinal debris triggers cytotoxic damage in cocultivated primary porcine RPE cells

Natalie Wagner et al. Front Neurosci. .

Abstract

Introduction: One of the most common causes of vision loss in the elderly population worldwide is age-related macular degeneration (AMD). Subsequently, the number of people affected by AMD is estimated to reach approximately 288 million by the year 2040. The aim of this study was to develop an ex vivo model that simulates various aspects of the complex AMD pathogenesis.

Methods: For this purpose, primary porcine retinal pigment epithelial cells (ppRPE) were isolated and cultured. One group was exposed to medium containing sodium iodate (NaIO3) to induce degeneration. The others were exposed to different supplemented media, such as bovine serum albumin (BSA), homogenized porcine retinas (HPR), or rod outer segments (ROOS) for eight days to promote retinal deposits. Then, these ppRPE cells were cocultured with porcine neuroretina explants for another eight days. To assess the viability of ppRPE cells, live/dead assay was performed at the end of the study. The positive RPE65 and ZO1 area was evaluated by immunocytochemistry and the expression of RLBP1, RPE65, and TJP1 was analyzed by RT-qPCR. Additionally, drusen (APOE), inflammation (ITGAM, IL6, IL8, NLRP3, TNF), oxidative stress (NFE2L2, SOD1, SOD2), and hypoxia (HIF1A) markers were investigated. The concentration of the inflammatory cytokines IL-6 and IL-8 was determined in medium supernatants from day 16 and 24 via ELISA.

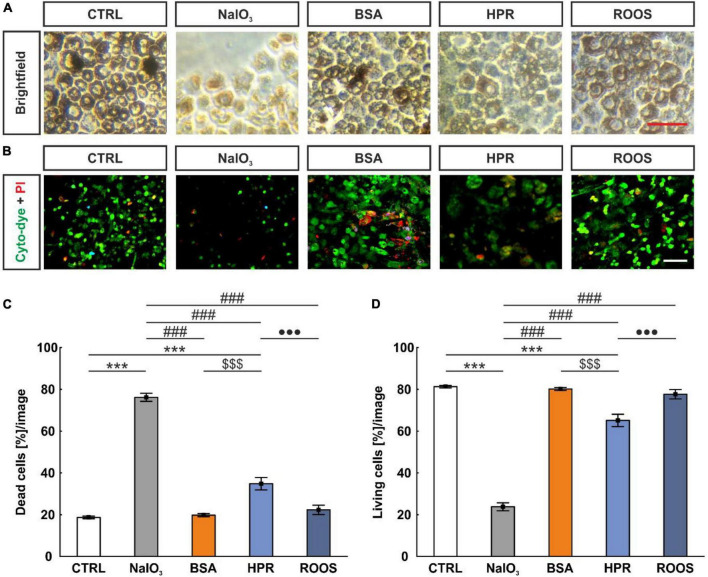
Results: Live/dead assay suggests that especially exposure to NaIO3 and HPR induced damage to ppRPE cells, leading in a significant ppRPE cell loss. All supplemented media resulted in decreased RPE-characteristic markers (RPE65; ZO-1) and gene expression like RLBP1 and RPE65 in the cultured ppRPE cells. Besides, some inflammatory, oxidative as well as hypoxic stress markers were altered in ppRPE cells cultivated with NaIO3. The application of HPR induced an enhanced APOE expression. Pre-exposure of the ppRPE cells led to a diminished number of cones in all supplemented media groups compared to controls.

Discussion: Overall, this novel coculture model represents an interesting initial approach to incorporating deposits into coculture to mimic AMD pathogenesis. Nevertheless, the effects of the media used need to be investigated in further studies.

Keywords: age-related macular degeneration; coculture system; deposits; neuroretina; retinal pigment epithelium (RPE).


Conflict of interest statement

The authors declare that the research was conducted in the absence of any commercial or financial relationships that could be construed as a potential conflict of interest.

Figures

FIGURE 1
FIGURE 1
Illustration of the experimental set-up and timeline. Fresh eyes were used to isolate ppRPE cells and these cells were cultivated in ppRPE medium (DMEM/F12) in T25 flasks until they reached confluence (days –8 to 0). Subsequently, about 300,000 cells were seeded per well in 12-well plates and allowed to grow in ppRPE medium for eight days (days 0 to 8). At day 8, the supplemented media were applied: NaIO3, BSA, HPR, or ROOS. Control samples received no supplement in their ppRPE medium (CTRL). The media were applied for eight days and every two days, 50% of the supplemented medium was replaced (days 8 to 16). From day 16 on, a coculture was performed by adding freshly isolated porcine neuroretina explants to all wells (days 16 to 24). Also, the supplemented media were replaced with 1:1 ppRPE and neuroretina (Neurobasal-A) medium. Medium was exchanged at day 20. On days 16 and 24, ELISA analysis of the medium supernatant was performed. On day 24, immunocytochemistry (ICC) and RT-qPCR were conducted of the ppRPE cells and immunohistochemistry (IHC) from the neuroretina samples.
FIGURE 2
FIGURE 2
NaIO3 exposure led to enhanced ppRPE cell death. (A) To evaluate the effects of different media on the survival of ppRPE cells brightfield images were obtained. (B) Also, cyto-dye (green) and PI (red) stain was performed. (C) The NaIO3 and HPR exposed ppRPE cells showed significantly more dead cells. (D) Accordingly, living cells per section were significantly diminished in the NaIO3 as well as in the HPR group. CTRL, control; BSA, bovine serum albumin; HPR, homogenized porcine retina; ROOS, rod outer segments. Scale bars: brightfield: 50 μm, ICC: 20 μm, values are mean ± SEM, n = 6/group, ***p < 0.001 vs. CTRL; ###p < 0.001 vs. NaIO3; $$$p < 0.001 vs. BSA; •••p < 0.001 vs. ROOS.
FIGURE 3
FIGURE 3
RPE65 decreased in all supplemented groups. (A) Immunocytochemistry images were evaluated to assess the RPE-specific RPE65 (red) and the distribution of the tight junction marker ZO-1 (green). Cell nuclei were stained with DAPI (blue). (B) RPE65+ stained area was significantly diminished in all four supplemented groups, while BSA ppRPE cells showed the lowest values compared to CTRL. (C) Relative expression of RPE65 was significantly reduced in NaIO3, BSA, and ROOS exposed ppRPE cells in comparison to CTRLs. (D) ZO-1+ area was significantly decreased in the NaIO3 group. (E) TJP1 expression was comparable in all groups. (F) The RPE-specific gene RLBP1 was significantly downregulated in RPE cells exposed to NaIO3, while all other groups did not show significant differences to CTRLs. (G) APOE expression was significantly downregulated in the NaIO3 group and compared to all other group enhanced in the HPR group when compared to CTRL. CTRL, control; BSA, bovine serum albumin; HPR, homogenized porcine retina; ROOS, rod outer segments. Scale bars: 20 μm, values in B+D are mean ± SEM and in (C,E,F,G) median ± quartile ± minimum/maximum, the dotted lines in (C,E,F,G) represent the relative expression of the CTRL group, n = 6/group, *p < 0.050, **p < 0.010, ***p < 0.001 vs. CTRL; $$p < 0.01 vs. BSA. ##p < 0.010, ###p < 0.001 vs. NaIO3.
FIGURE 4
FIGURE 4
Enhanced TNF expression in supplemented groups. (A) NLRP3 inflammasome expression was increased in the NaIO3 group, while expression was not altered in the other supplemented groups. (B) ITGAM mRNA expression levels showed a significantly diminished expression in BSA and NaIO3 samples in comparison to CTRL. (C) The inflammation marker TNF was highly upregulated in all supplemented groups compared to CTRLs. (D) No significant differences in IL-6 protein levels in supernatant samples were noted in comparison to CTRLs at day 16. Solely the NaIO3 group demonstrated a significantly decreased IL-6 protein level in supernatants compared to ROOS. (E) At day 24, IL-6 protein level in supernatant samples was significantly diminished in NaIO3 exposed ppRPE cells in comparison to all other groups. (F) On the other hand, IL6 mRNA expression was significantly enhanced in ppRPE cells after NaIO3 exposure in contrast to CTRL. (G) IL-8 protein level was significantly diminished in supernatant samples of the NaIO3 group on day 16, when compared to all other groups. On the other hand, in HPR supernatants the IL-8 level was significantly enhanced in contrast to CTRL. (H) At day 24, IL-8 level was significantly reduced in supernatants of the NaIO3 group in comparison to all other groups. (I) IL8 mRNA expression was unaltered in ppRPE samples from all groups. (J) By comparing ELISA measurements between both points in time for each group, the IL-6 levels were significantly higher at day 24 in CTRL, BSA, HPR, and ROOS samples when compared to IL-6 levels at day 16, while no changes were observed in NaIO3 supernatants. (K) The IL-8 levels were similar between both points in time in CTRL, BSA, and ROOS samples. IL-8 levels were found increased in the NaIO3 group at day 24 when compared to day 16, while less IL-8 was noted in HPR supernatants. CTRL, control; BSA, bovine serum albumin; HPR, homogenized porcine retina; ROOS, rod outer segments, values in (D,E,G,H,J,K) are mean ± SEM ± SD and values in (A,B,C,F,I) are median ± quartile ± minimum/maximum, the dotted lines in (A,B,C,F,I) represent the relative expression of the CTRL group, n = 6/group, *p < 0.050, **p < 0.010, ***p < 0.001 vs. CTRL; #p < 0.050, ##p < 0.010, ###p < 0.001 vs. NaIO3; $$p < 0.010 vs. BSA; ¥¥p < 0.010, ¥¥¥p < 0.001 vs. HPR; ••p < 0.010 vs. ROOS.
FIGURE 5
FIGURE 5
Altered expression of oxidative stress, hypoxia, and ECM marker in NaIO3 samples. (A) A marker for oxidative stress, SOD1, was upregulated in the NaIO3 group, while the other supplemented groups (BSA, HPR, and ROOS) showed comparable results as CTRL. (B) Interestingly, SOD2 was not regulated in any group. (C) Expression of NFE2L2 was elevated in the NaIO3 group compared to CTRL. (D) HIF1A, a marker for hypoxia, was downregulated in the NaIO3 group compared to CTRL. (E) MMP2 is involved in extracellular matrix remodeling and was significantly decreased in the NaIO3 group when compared to CTRLs. BSA, bovine serum albumin; HPR, homogenized porcine retina; ROOS, rod outer segments. Values are median ± quartile ± minimum/maximum, the dotted lines represent the expression levels of the CTRL group, n = 6/group, *p < 0.050, **p < 0.010 vs. CTRL.
FIGURE 6
FIGURE 6
Supplemented media led to decreased cone cell numbers. (A) In neuroretina cross-sections, cones were marked with M/L-opsin (red) and rods with rhodopsin (green). Cell nuclei were stained with DAPI (blue). (B) The number of M/L-opsin+ cells was significantly reduced in all four supplemented groups in comparison to CTRLs. (C) The rhodopsin+ signal area was comparable in all groups. (D) Apoptotic cells were labeled with TUNEL (red), while DAPI (blue) counterstained cell nuclei. (E) The number of TUNEL+ cells within the ONL was constant in all groups. (F) The DAPI+ area in the ONL was similar in all groups. CTRL, control; BSA, bovine serum albumin; HPR, homogenized porcine retina; ROOS, rod outer segments; ONL, outer nuclear layer; OS, outer segments. Scale bars: 20 μm, values are mean ± SEM, n = 4–5/group, **p < 0.010 vs. CTRL.
FIGURE 7
FIGURE 7
IL-8 diminished in NaIO3 neuroretinae. (A) Neuroretinal cross-sections were labeled with antibodies against IL-6 (green) and IL-8 (red), while DAPI counterstained cell nuclei (blue). (B) The IL-6+ staining area did not differ within the groups. (C) IL-8 staining revealed a smaller staining area in NaIO3 samples compared to CTRLs. Compared to NaIO3 supplemented neuroretinae, a higher IL-8+ area was noted in BSA specimens, while no difference was noted compared to CTRLs. CTRL, control; BSA, bovine serum albumin; HPR, homogenized porcine retina; ROOS, rod outer segments; ONL, outer nuclear layer; OS, outer segments. Scale bar: 20 μm, values are mean ± SEM, n = 4–5/group, *p < 0.050 vs. CTRL, #p < 0.050 vs. NaIO3.

Similar articles

References

    1. Ambati J., Fowler B. (2012). Mechanisms of age-related macular degeneration. Neuron 75 26–39. - PMC - PubMed
    1. Amin S., Chong N., Bailey T., Zhang J., Knupp C., Cheetham M., et al. (2004). Modulation of Sub-RPE deposits in vitro: A potential model for age-related macular degeneration. Invest. Ophthalmol. Vis. Sci. 45 1281–1288. - PubMed
    1. Aredo B., Li T., Chen X., Zhang K., Wang C., Gou D., et al. (2015). A chimeric Cfh transgene leads to increased retinal oxidative stress, inflammation, and accumulation of activated subretinal microglia in mice. Invest. Ophthalmol. Vis. Sci. 56 3427–3440. 10.1167/iovs.14-16089 - DOI - PMC - PubMed
    1. Armento A., Ueffing M., Clark S. (2021). The complement system in age-related macular degeneration. Cell Mol. Life Sci. 78 4487–4505. - PMC - PubMed
    1. Bellezza I. (2018). Oxidative stress in age-related macular degeneration: Nrf2 as therapeutic target. Front. Pharmacol. 9:1280. 10.3389/fphar.2018.01280 - DOI - PMC - PubMed

LinkOut - more resources