. 2024 Jun 18;8(1):945-957.
doi: 10.3233/ADR-240053. eCollection 2024.

Causal Association Between Type 2 Diabetes Mellitus and Alzheimer's Disease: A Two-Sample Mendelian Randomization Study

Affiliations

Causal Association Between Type 2 Diabetes Mellitus and Alzheimer's Disease: A Two-Sample Mendelian Randomization Study

Cong Li et al. J Alzheimers Dis Rep. .

Abstract

Background: There is now increasing evidence that type 2 diabetes mellitus (T2DM) is associated with Alzheimer's disease (AD). However, it is unclear whether the two are causally related.

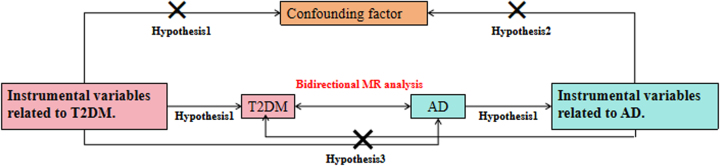
Objective: To reveal the causal association between T2DM and AD, we performed a bidirectional Mendelian randomization (MR) analysis.

Methods: Genetic instrumental variables were systematically screened, and inverse-variance weighting, MR-Egger regression, weighted median, simple mode, and weighted mode were applied to assess the pathogenic associations between the two diseases, and sensitivity analyses were used to further validate the robustness of the results.

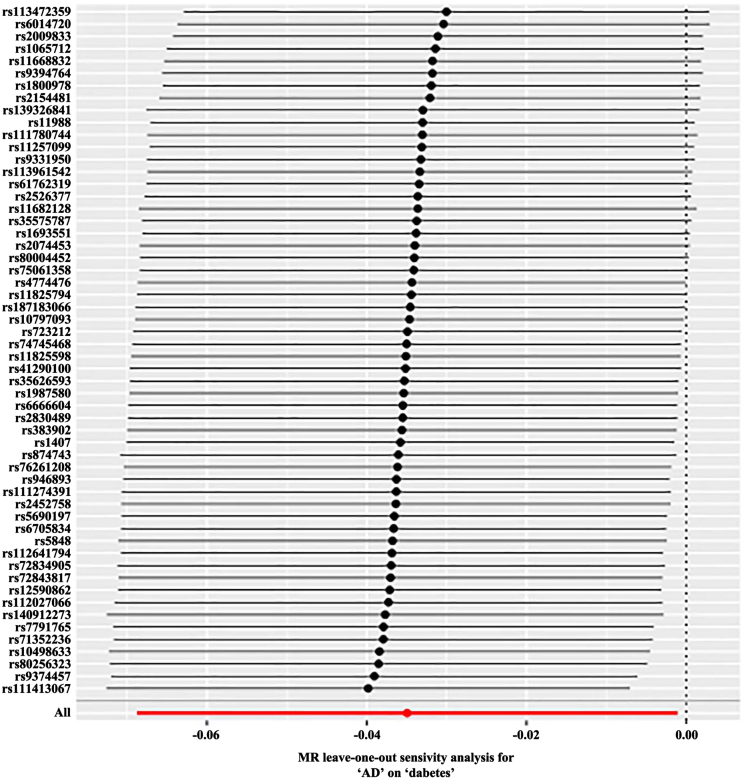
Results: The results of forward MR analysis with T2DM as the exposure were [OR = 0.998, 95% CI (0.975∼1.021), p = 0.857], and the results of reverse MR analysis with AD as the exposure were [OR = 0.966, 95% CI (0.934∼0.999), p = 0.043]. The results showed no significant association between T2DM and AD at the gene level (p < 0.025). Sensitivity analyses were consistent with the results of the main analysis, confirming the robustness of the study.

Conclusions: T2DM and AD may not be genetically causally associated.

Keywords: Alzheimer’s disease; Mendelian randomization; causal association; type 2 diabetes mellitus.


Conflict of interest statement

The authors have no conflict of interest to report.

Figures

Fig. 1
Fig. 1
Schematic diagram of a two-sample MR analysis.
Fig. 2
Fig. 2
Scatterplot of forward MR. Scatter plot of genetic correlations of T2DM on AD using different MR methods. The slopes of line represent the causal effect of each method, respectively. MR Test, Mendelian Randomization Test; MR Egger, Mendelian Randomization Egger; SNP, single nucleotide polymorphism.
Fig. 3
Fig. 3
Funnel plot of the results of the heterogeneity test for forward MR method analysis. The funnel plot demonstrates that a single SNP is a causally relevant point for IV generation and exhibits a symmetrical distribution, suggesting minimal variation between IVs. MR Method, Mendelian Randomization Method; MR Egger, Mendelian Randomization Egger; IV, instrumental variables.
Fig. 4
Fig. 4
Forward MR ‘Leave-one-out’ sensitivity analysis results. Sensitivity analysis employs the ‘leave-one-out ‘ method to systematically remove SNPs one at a time. By comparing the causal effects of the remaining SNPs with the MR analysis results of all SNPs to determine if the causal association is driven by a single instrumental variable. The MR analysis results demonstrate stable. MR, Mendelian Randomization.
Fig. 5
Fig. 5
Scatterplot of reverse MR. Scatter plot of genetic correlations of AD on T2DM using different MR methods. The slopes of line represent the causal effect of each method, respectively. MR Test, Mendelian Randomization Test; MR Egger, Mendelian Randomization Egger; SNP, Single-Nucleotide Polymorphism.
Fig. 6
Fig. 6
Funnel plot of the results of the heterogeneity test for reverse MR method analysis. The funnel plot demonstrates that a single SNP is a causally relevant point for IV generation and exhibits a symmetrical distribution, suggesting minimal variation between IVs. MR Method, Mendelian Randomization Method; MR Egger, Mendelian Randomization Egger. IV, instrumental variables.
Fig. 7
Fig. 7
Reverse MR ‘Leave-one-out’ sensitivity analysis results. Sensitivity analysis employs the ‘leave-one-out ‘ method to systematically remove SNPs one at a time. By comparing the causal effects of the remaining SNPs with the MR analysis results of all SNPs to determine if the causal association is driven by a single instrumental variable. The MR analysis results demonstrate stable. MR, Mendelian Randomization.

Similar articles

Cited by

References

    1. Barbagallo M, Dominguez LJ (2014) Type 2 diabetes mellitus and Alzheimer’s disease. World J Diabetes 5, 889–893. - PMC - PubMed
    1. Lee HJ, Seo HI, Cha HY, Yang YJ, Kwon SH, Yang SJ (2018) Diabetes and Alzheimer’s disease: Mechanisms and nutritional aspects. Clin Nutr Res 7, 229–240. - PMC - PubMed
    1. Salameh TS, Rhea EM, Banks WA, Hanson AJ (2016) Insulin resistance, dyslipidemia, and apolipoprotein E interactions as mechanisms in cognitive impairment and Alzheimer’s disease. Exp Biol Med 241, 1676–1683. - PMC - PubMed
    1. Hildreth KL, Van Pelt RE, Schwartz RS (2012) Obesity, insulin resistance, and Alzheimer’s disease. Obesity 20, 1549–1557. - PMC - PubMed
    1. Scheltens P, De Strooper B, Kivipelto M, Holstege H, Chételat G, Teunissen CE, Cummings J, van der Flier WM (2021) Alzheimer’s disease. Lancet 397, 1577–1590. - PMC - PubMed

LinkOut - more resources