. 2024 Jul 9:22:100455.
doi: 10.1016/j.ese.2024.100455. eCollection 2024 Nov.

Optimizing UVA and UVC synergy for effective control of harmful cyanobacterial blooms

Affiliations

Optimizing UVA and UVC synergy for effective control of harmful cyanobacterial blooms

Yinjie Zhu et al. Environ Sci Ecotechnol. .

Abstract

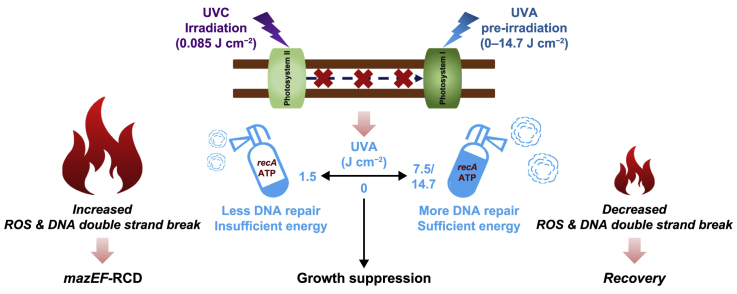
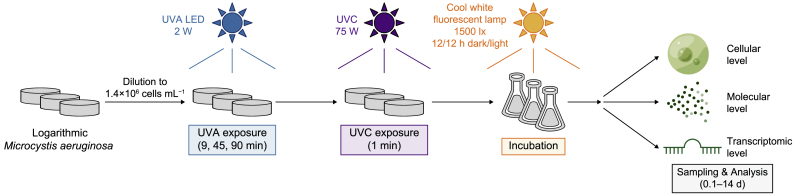
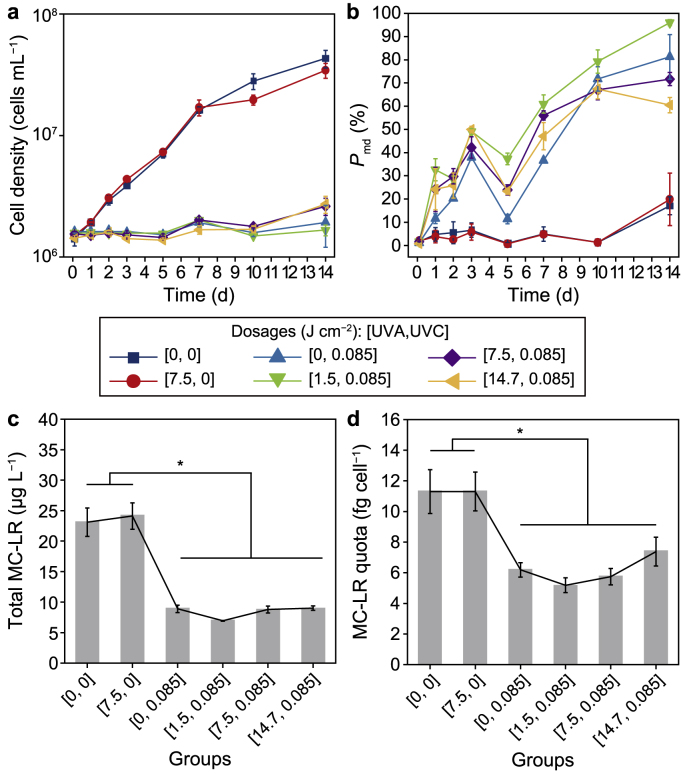
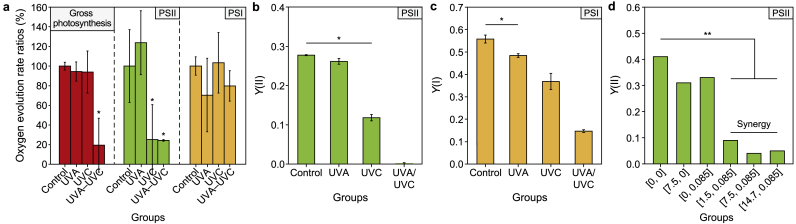
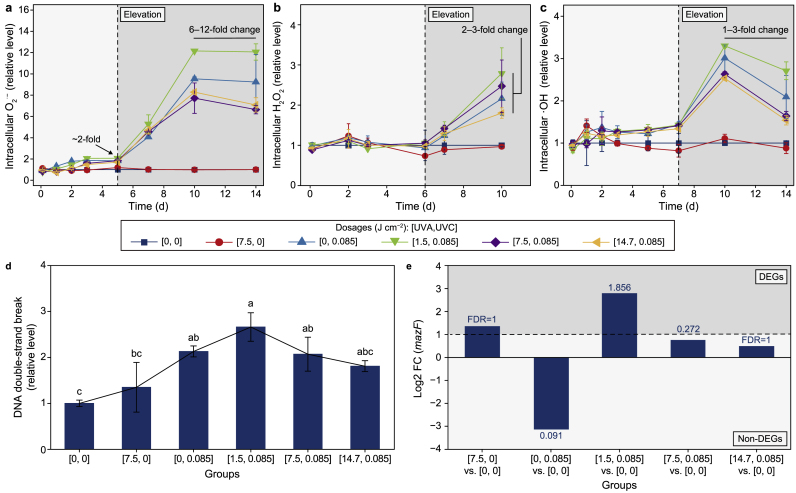
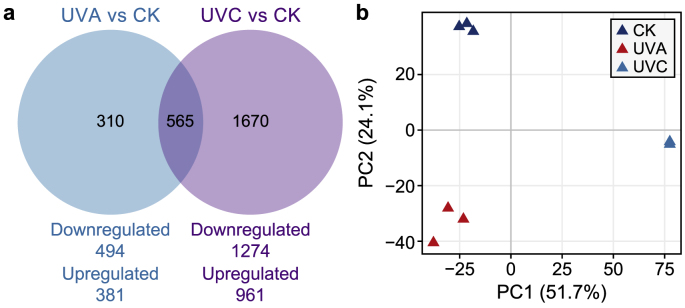
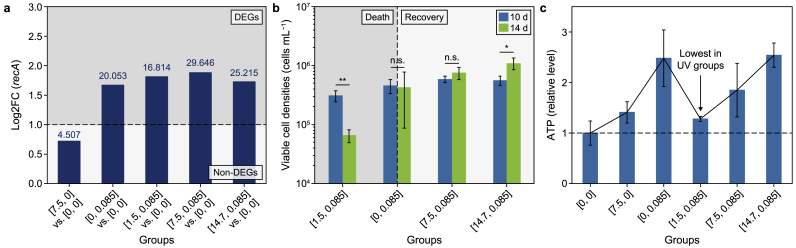
Harmful cyanobacterial blooms (HCBs) pose a global ecological threat. Ultraviolet C (UVC) irradiation at 254 nm is a promising method for controlling cyanobacterial proliferation, but the growth suppression is temporary. Resuscitation remains a challenge with UVC application, necessitating alternative strategies for lethal effects. Here, we show synergistic inhibition of Microcystis aeruginosa using ultraviolet A (UVA) pre-irradiation before UVC. We find that low-dosage UVA pre-irradiation (1.5 J cm-2) combined with UVC (0.085 J cm-2) reduces 85% more cell densities compared to UVC alone (0.085 J cm-2) and triggers mazEF-mediated regulated cell death (RCD), which led to cell lysis, while high-dosage UVA pre-irradiations (7.5 and 14.7 J cm-2) increase cell densities by 75-155%. Our oxygen evolution tests and transcriptomic analysis indicate that UVA pre-irradiation damages photosystem I (PSI) and, when combined with UVC-induced PSII damage, synergistically inhibits photosynthesis. However, higher UVA dosages activate the SOS response, facilitating the repair of UVC-induced DNA damage. This study highlights the impact of UVA pre-irradiation on UVC suppression of cyanobacteria and proposes a practical strategy for improved HCBs control.

Keywords: Cyanobacterial bloom; DNA damage/repair; Photosynthetic damage; Regulated cell death; Ultraviolet irradiation.


Conflict of interest statement

The authors declare that they have no known competing financial interests or personal relationships that could have appeared to influence the work reported in this paper.

Figures

Image 1
Graphical abstract
Fig. 1
Fig. 1
Schematic illustration of the experimental setup. The UVA LED and UVC wavelengths were 365 and 254 nm, respectively. Sampling and analysis were performed on 0.1, 1, 2, 3, 5, 7, 10, and 14 days after UV irradiation.
Fig. 2
Fig. 2
Physiological responses of Microcystis aeruginosa to UV irradiation. a, Time-scale total cell density changes under 1500 lx at 25 ± 1 °C with a 12/12 h dark/light cycle. b, Time-scale changes of the percentage of cells with permeabilized membranes under 1500 lx at 25 ± 1 °C with a 12/12 h dark/light cycle. c, Total microcystin-LR. d, Microcystin-LR cellular quota on the 7th day of post-incubation. Asterisks indicate significant differences at p < 0.05. The error bar represents the standard deviation from the three biological replicates.
Fig. 3
Fig. 3
Synergistic photosynthetic damage caused by sequential UVA and UVC irradiation. a, Oxygen evolution rates of algal solutions at 2 h after UVA and UVC irradiation. Oxygen evolution rates were measured under 800 μmol photons cm−1 s−1 and expressed as (irradiated/control groups) %. bc, The effective quantum yields of PSII (b) and PSI (c) of Microcystis aeruginosa cells were measured using Dual-PAM at 2 h after UV irradiation. d, The effective quantum yields of PSII of M. aeruginosa cells at 2 h after UV irradiation were measured using PHYTO-PAM. UVA and UVC independently target PSI and PSII, respectively. The sequential irradiation of UVA and UVC blocked all electron transport chains. In panels a, b, and c, the UVA and UVC dosages were 7.5 and 0.085 J cm−2, respectively. Asterisks indicate significant differences with ∗ at p < 0.05 and ∗∗ at p < 0.01. The error bar represents the standard deviation from the three biological replicates.
Fig. 4
Fig. 4
Oxidative and mazEF stress induced by UV irradiation of Microcystis aeruginosa cells. ac, Time-scale changes in intracellular oxidative stress as indicated by superoxide anion radicals (a), hydrogen peroxide (b), and hydroxyl radicals (c) in M. aeruginosa cells under 1500 lx at 25 ± 1 °C with a 12/12 h dark/light cycle. Light grey indicates negligible changes of, while dark grey suggests significant elevation of ROS compared with that of the control. d, DNA double-strand break on the 7th day after UV irradiation, as indicated by the TUNEL positive rates. e, Log2FC of gene mazF on the 10th day after UV irradiation. The data above columns represent −log10(FDR) of gene expression changes, and genes with −log10(FDR) above 1.301 are considered differentially expressed genes (DEGs). Light grey indicates Non-DEGs, while dark grey suggests DEGs. In general, synergistic damage to the whole photosynthetic ETC resulted in the generation and conversion of ROS in M. aeruginosa cells. The ROS burst, DNA double-strand break, and mazEF stress proceeded chronologically within 10 d. Different letters indicate significant differences between the groups. The error bar represents the standard deviation from the three biological replicates.
Fig. 5
Fig. 5
Comparisons of cellular transcriptomic responses between UVA- and UVC-irradiated Microcystis aeruginosa cells. a, Venn diagram. b, Principal component analysis of gene expression in the control, UVA, and UVC groups. Data presented in Fig. 5 represented the transcriptomic analysis conducted on the 2nd day after UVA and UVC irradiation as cells underwent UV damage, respectively.
Fig. 6
Fig. 6
Mechanisms of bidirectional impacts of UVA pre-irradiation on Microcystis aeruginosa cells upon UVC exposure. a, Log2FC of the gene recA on the 2nd day after UV irradiation. The data above columns represent −log10(FDR) of gene expression changes, and genes with −log10(FDR) values above 1.301 are considered DEGs. b, Variations of viable cell densities from the 10th to the 14th day after UV irradiation. c, ATP levels in M. aeruginosa cells on the 10th day after UV irradiation. UVA pre-irradiation provided RecA repair proteins for UVC-induced damage. Whether the repair kept pace with the damage determined the bidirectional impacts. Asterisks indicate significant differences with ∗ at p < 0.05 and ∗∗ at p < 0.01; n. s. represents not significant. The error bar represents the standard deviation from the three biological replicates.

Similar articles

Cited by

References

    1. Dai R., Xiong Y., Ma Y., Tang T. Algae removal performance of UV-radiation-enhanced coagulation for two representative algal species. Sci. Total Environ. 2020;745 - PubMed
    1. Santos A.A., Guedes D.O., Barros M.U.G., Oliveira S., Pacheco A.B.F., Azevedo S.M.F.O., Magalhães V.F., Pestana C.J., Edwards C., Lawton L.A., Capelo-Neto J. Effect of hydrogen peroxide on natural phytoplankton and bacterioplankton in a drinking water reservoir: mesocosm-scale study. Water Res. 2021;197 - PubMed
    1. Zhu X., Dao G., Tao Y., Zhan X., Hu H. A review on control of harmful algal blooms by plant-derived allelochemicals. J. Hazard Mater. 2021;401 - PubMed
    1. Tao Y., Hou D., Zhou T., Cao H., Zhang W., Wang X. UV-C suppression on hazardous metabolites in Microcystis aeruginosa: unsynchronized production of microcystins and odorous compounds at population and single-cell level. J. Hazard Mater. 2018;359:281–289. - PubMed
    1. Žegura B., Štraser A., Filipič M. Genotoxicity and potential carcinogenicity of cyanobacterial toxins-A review. Rev. Mutat. Res. 2011;727:16–41. - PubMed

LinkOut - more resources