. 2024 Jul 24:12:1412236.
doi: 10.3389/fcell.2024.1412236. eCollection 2024.

Cellular and functional evaluation of LDLR missense variants reported in hypercholesterolemic patients demonstrates their hypomorphic impacts on trafficking and LDL internalization

Affiliations

Cellular and functional evaluation of LDLR missense variants reported in hypercholesterolemic patients demonstrates their hypomorphic impacts on trafficking and LDL internalization

Aseel A Jawabri et al. Front Cell Dev Biol. .

Abstract

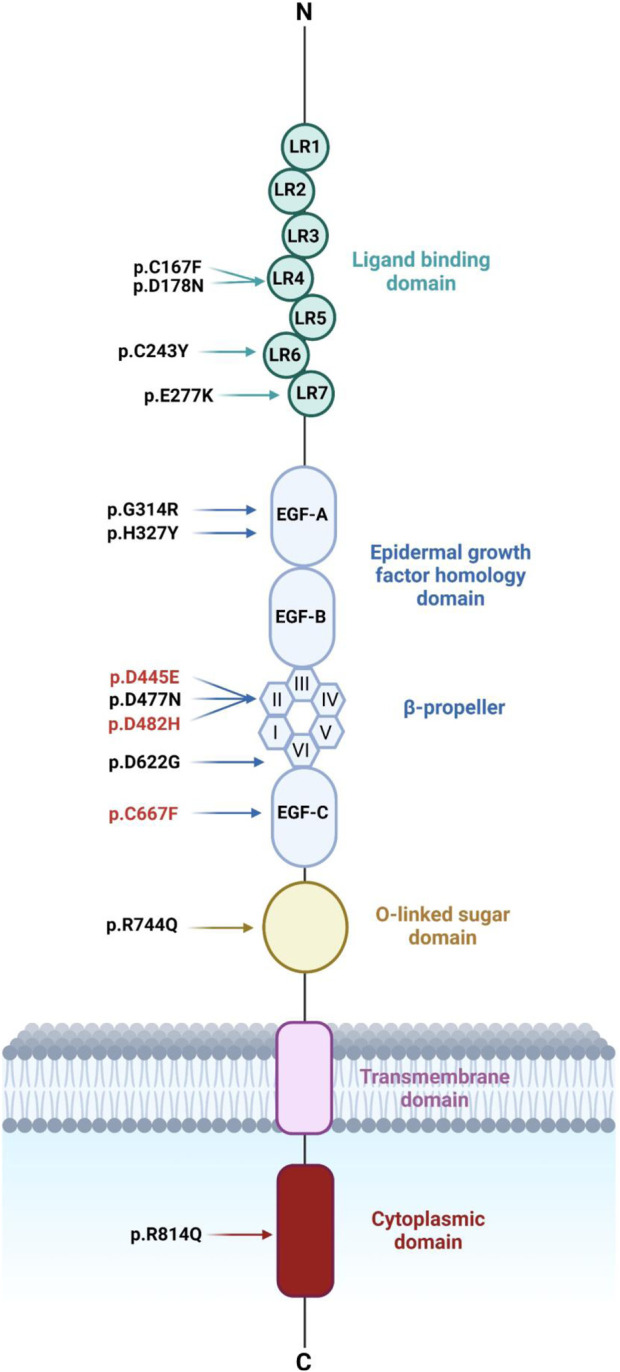
Background: Familial hypercholesterolemia (FH) is an autosomal dominant disorder characterized by increased LDL-cholesterol levels. About 85% of FH cases are caused by LDLR mutations encoding the low-density lipoprotein receptor (LDLR). LDLR is synthesized in the endoplasmic reticulum (ER) where it undergoes post-translational modifications and then transported through Golgi apparatus to the plasma membrane. Over 2900 LDLR variants have been reported in FH patients with limited information on the pathogenicity and functionality of many of them. This study aims to elucidate the cellular trafficking and functional implications of LDLR missense variants identified in suspected FH patients using biochemical and functional methods.

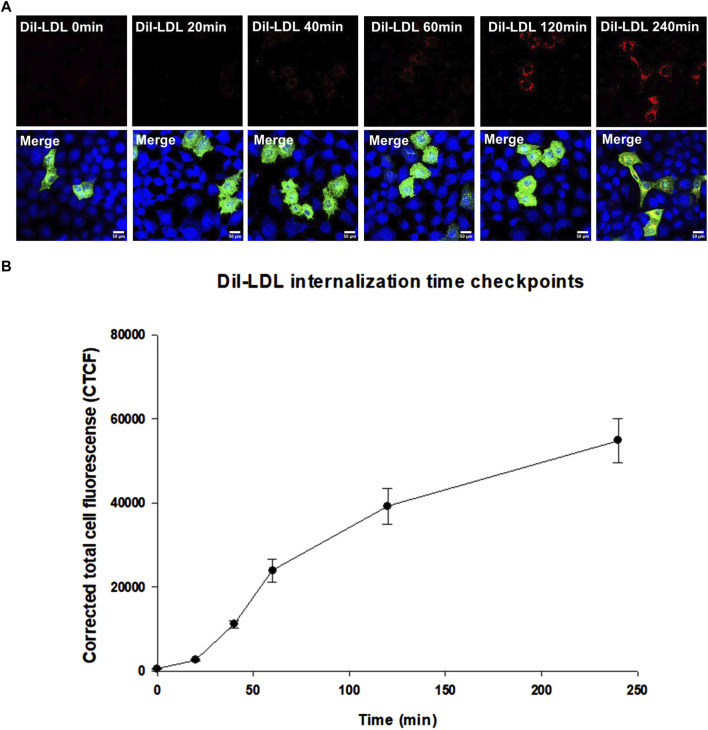
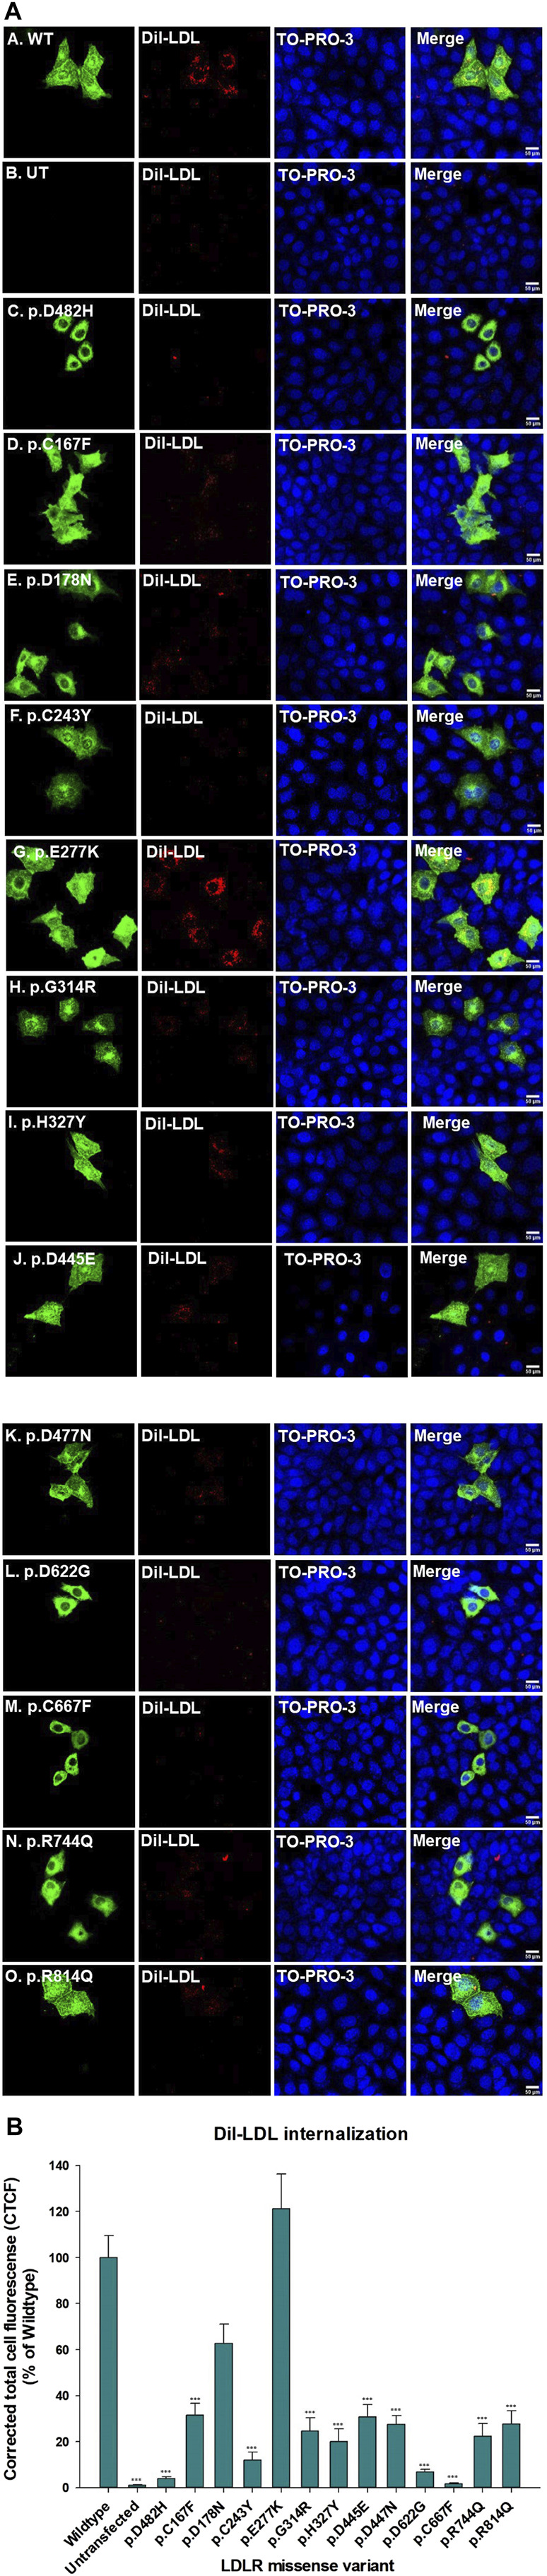
Methods: We used HeLa, HEK293T, and LDLR-deficient-CHO-ldlA7 cells to evaluate the subcellular localization and LDL internalization of ten LDLR missense variants (p.C167F, p.D178N, p.C243Y, p.E277K, p.G314R, p.H327Y, p.D477N, p.D622G, p.R744Q, and p.R814Q) reported in multiethnic suspected FH patients. We also analyzed the functional impact of three variants (p.D445E, p.D482H, and p.C677F), two of which previously shown to be retained in the ER.

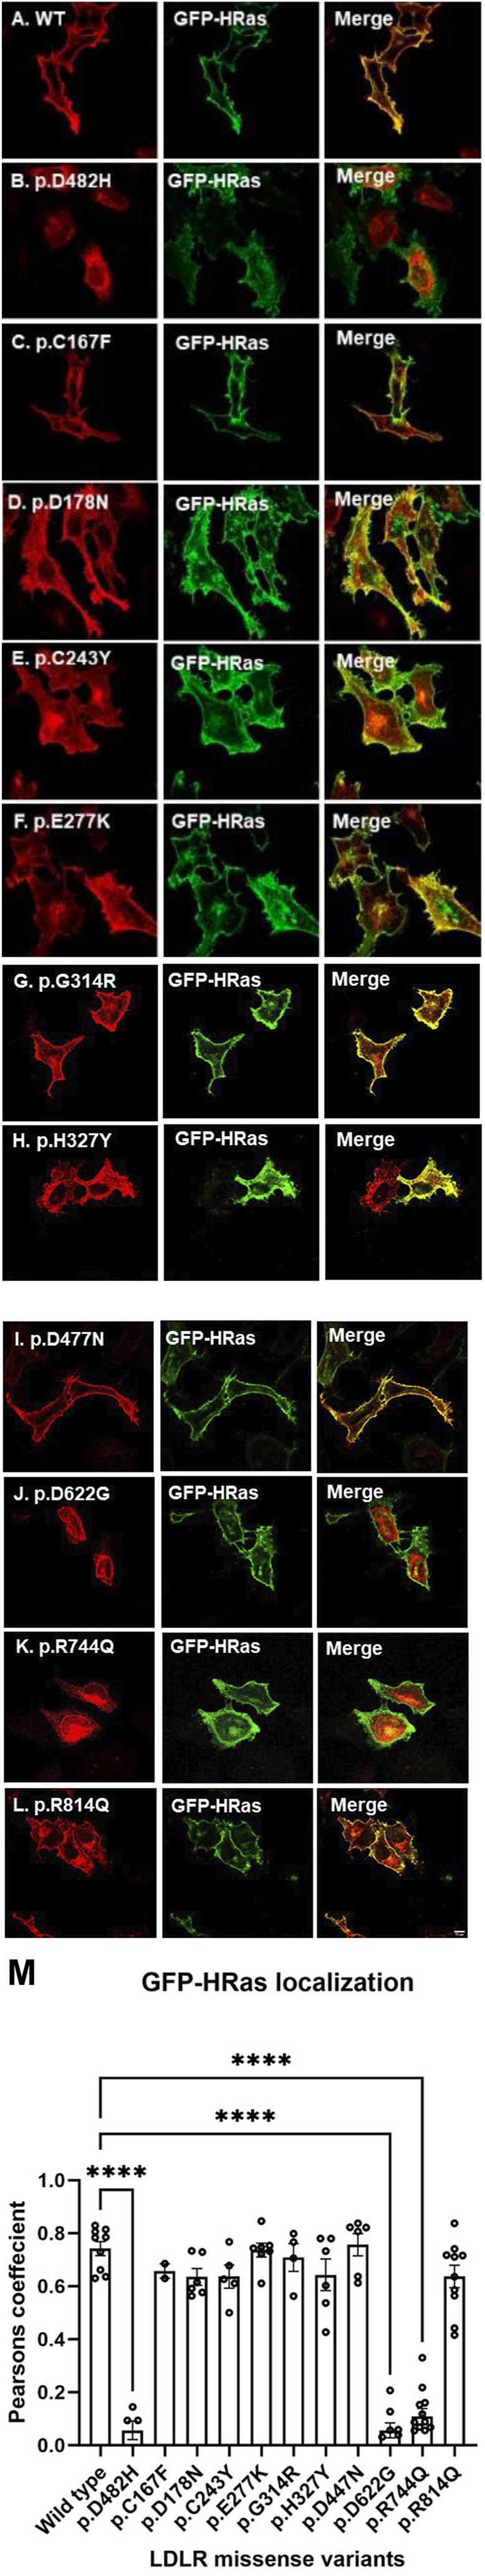
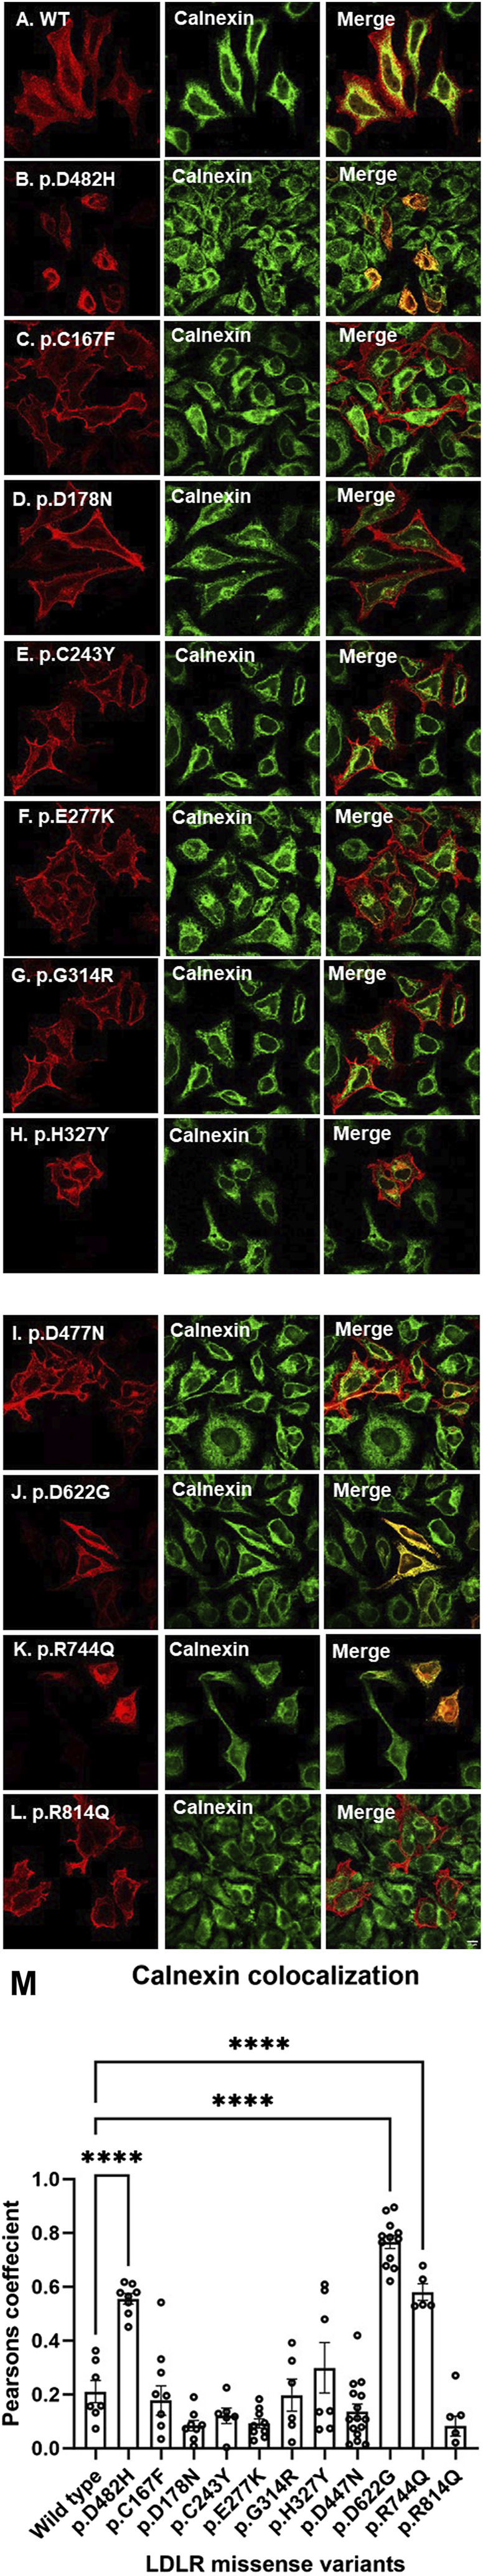
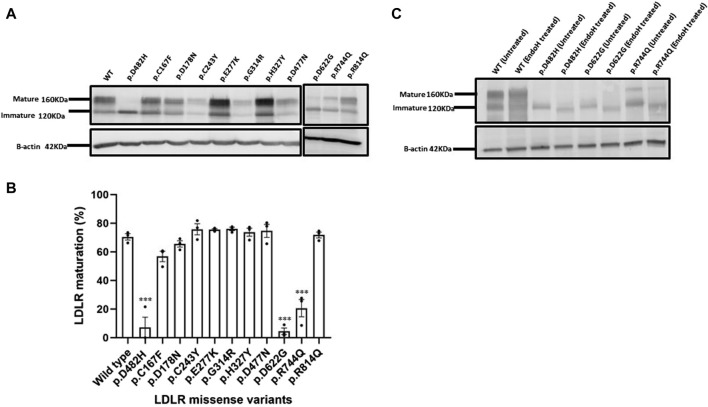
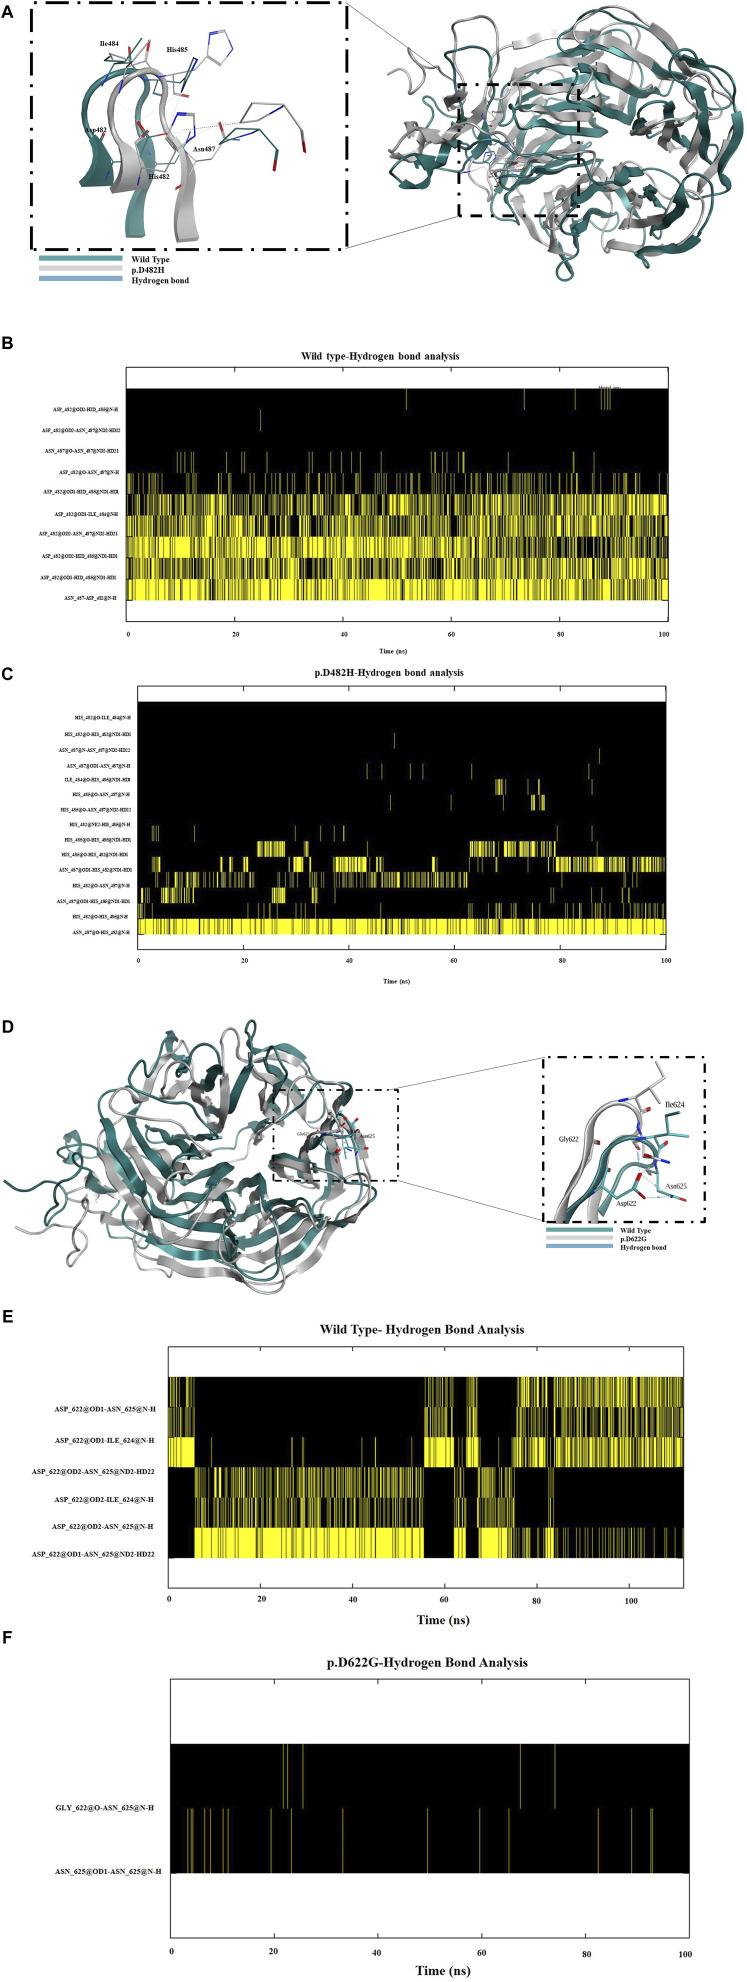
Results: We show that p.D622G, p.D482H, and p.C667F are largely retained in the ER whereas p.R744Q is partially retained. The other variants were predominantly localized to the plasma membrane. LDL internalization assays in CHO-ldlA7 cells indicate that p.D482H, p.C243Y, p.D622G, and p.C667F have quantitatively lost their ability to internalize Dil-LDL with the others (p.C167F, p.D178N, p.G314R, p.H327Y, p.D445E, p.D477N, p.R744Q and p.R814Q) showing significant losses except for p.E277K which retained full activity. However, the LDL internalization assay is only to able evaluate the impact of the variants on LDL internalization and not the exact functional defects such as failure to bind LDL. The data represented illustrate the hypomorphism nature of variants causing FH which may explain some of the variable expressivity of FH.

Conclusion: Our combinatorial approach of in silico, cellular, and functional analysis is a powerful strategy to determine pathogenicity and FH disease mechanisms which may provide opportunitites for novel therapeutic strategies.

Keywords: ER associated protein degradation (ERAD); ER stress; familial hypercholesterolemia (FH); low-density lipoprotein (LDL); low-density lipoprotein receptor (LDLR); protein quality control; receptor-mediated endocytosis.


Conflict of interest statement

The authors declare that the research was conducted in the absence of any commercial or financial relationships that could be construed as a potential conflict of interest.

Figures

FIGURE 1
FIGURE 1
Schematic diagram representing LDLR’s structure with the ten LDLR missense variants identified recently in Emiratis (in black) and three other LDLR variants (in red). LDLR comprises 18 exons encoding five distinct domains each domain is represented by a different color. These domains include the ligand-binding domain (LBD) followed by the EGF homology domain consisting of EGF-A, EGF-B, β-propeller domain of six YWTD motifs, and EGF-C. The third domain is O-linked sugars followed by the transmembrane domain and the cytoplasmic domain. Figure 1 was generated using BioRender (https://app.biorender.com/). (Accessed on 20, June 2024). Biorender’s license is provided in Supplementary data sheet 3.
FIGURE 2
FIGURE 2
HeLa cells transiently transfected with HA-tagged LDLR wild-type [panel (A)] or mutant (p.D482H, p.C167F, p.D178N, p.C243Y, p.E277K, p.G314R, p.H327Y, p.D477N, p.D622G, p.R744Q and p.R814Q in panels [(B–L), respectively] expression constructs were probed with anti-HA primary antibody and fluorescently stained in red with Alexa Fluor 555 as illustrated in the vertical panels (A–L) in the first and fourth columns. Cells were also co-transfected with GFP-tagged HRas plasmid acting as a plasma membrane marker as illustrated in vertical panels in the second and fifth columns. Merged images in vertical panels in the third and sixth columns demonstrate co-localization with GFP-tagged HRas. All images were captured using the Nikon Eclipse system (Nikon Instruments Inc., Tokyo, Japan) equipped with FITC and TRITC filters. Images were captured with a ×100 oil immersion objective lens. Images were enhanced and a scale bar was added using ImageJ (Fiji) software. Scale bar = 70 μm. Panel (M): The degree of co-localization of GFP-HRas with LDLR wild type and missense variants. Data are presented as bar charts, with individual data points representing each analyzed cell. LDLR variants p.D482H, p.D622G, and p.R744Q exhibited significantly the lowest colocalization with GFP-HRas compared to LDLR wild type. The statistical significance of differences between LDLR variants and the wild type (used as control) was assessed using one-way ANOVA followed by the Holm-Sidak method. p-values are denoted as: () p ≤ 0.05; () p ≤ 0.01; () p ≤ 0.001.
FIGURE 3
FIGURE 3
Transiently transfected HeLa cells expressing LDLR wild-type and missense variants (p.D482H, p.C167F, p.D178N, p.C243Y, p.E277K, p.G314R, p.H327Y, p.D477N, p.D622G, p.R744Q and p.R814Q in panels (B–L), respectively probed with anti-HA antibody primary antibody and fluorescently stained with CST Alexa Fluor 555 secondary antibody as demonstrated in the first and fourth vertical panels (A–L), which were also co-stained with ER marker calnexin probed with anti-calnexin primary antibody and fluorescently stained with Alexa Fluor 488 secondary antibody as demonstrated in the second and fifth vertical panels (A–L). Images were merged to visualize co-localization with calnexin as displayed in vertical panels (A–L) in the third and sixth columns. All images were captured using the Nikon Eclipse system (Nikon Instruments Inc., Tokyo, Japan) equipped with FITC and TRITC filters. Images were captured with a ×100 oil immersion objective lens. Images intensity was enhanced in ImageJ in addition to the scale bar set at 70 μm. Panel (M): The degree of co-localization of LDLR and missense variants with the ER marker, calnexin. Data are shown as bar charts, with individual data points representing each analyzed cell. LDLR variants p.D482H, p.D622G, and p.R744Q exhibited significantly the highest colocalization with GFP-HRas compared to LDLR wild type. The statistical significance of differences between LDLR variants and the wild type (used as control) was assessed using one-way ANOVA followed by the Holm-Sidak method. p-values are denoted as: () p ≤ 0.05; () p ≤ 0.01; () p ≤ 0.001.
FIGURE 4
FIGURE 4
(A) HEK293T cells overexpressing HA-tagged LDLR or the indicated HA-tagged LDLR mutant constructs were transiently transfected for 48 h, harvested, quantified and probed with primary antibody against HA tag resolved on 7.5% SDS polyacrylamide gel for Western blot analysis. The immunoblot shows an upper band representing the mature LDLR form at ∼160 KDa and a lower band which is the immature form of LDLR at ∼120KDa. Β-actin was used as a loading control with an apparent MW of 42 KDa. (B) using GraphPad Prism software, a bar graph was created displaying the percentage (%) with individual data points of LDLR maturation of each LDLR missense variant relative to WT. Error bars represent ±SEM of three independent experiments; One-way ANOVA was used to calculate the statistical significance of LDLR variants versus the wild type. p-value was calculated using Holm-Sidak method which is represented as (*) p ≤ 0.05; (**) p ≤ 0.01; (***) p ≤ 0.001. (C) The glycosylation profiles of LDLR wild type and ER-retained missense variants: p.D482H (positive control), p.D622G and p.R744Q were examined by Endoglycosidase H enzyme assay. HEK293T cell lysates were divided into treated with EndoH and untreated groups, both incubated at 37°C for 3.5 h, probed against anti-HA primary antibody and analyzed by Western blot on a 7.5% polyacrylamide gel. Β-actin with an apparent MW of 42 KDa was used as a loading control.
FIGURE 5
FIGURE 5
(A) A schematic diagram of the β propeller region in the EGF homology domain representing the wild type (in green), the LDLR missense variant p.D482H (in grey) and the hydrogen bonds established (in blue) between Asp482 with neighboring amino acids Ile484, His485 and Asn487. Similarly, (D) shows a schematic diagram of the β propeller region in the EGF homology domain representing the wild type (in green), the LDLR missense variant p.D622G (in grey) and the hydrogen bonds established (in blue) between Asp622 with neighboring amino acids Ile624 and Asn625. (B) Hydrogen bond analysis revealed that robust hydrogen bonds were formed between Asp482 and the neighboring amino acids Ile484, His485 and Asn487 but when substituted with His482 as seen in (C) very weak hydrogen bonds were formed with His485 and Asn487 and none with Ile484 but a strong hydrogen bond was formed between His482 and Asn487. (E) Hydrogen bond analysis revealed that Asp622 formed robust hydrogen bonds with amino acids Ile624 and Asn625. (F) Weak hydrogen bonds were formed between Asn625 and no hydrogen bonds were formed with Ile624.
FIGURE 6
FIGURE 6
(A) represents Dil-LDL internalization by LDLR wild-type at six-time checkpoints (0 min, 20 min, 40 min, 60 min, 120 min and 240 min). All images were acquired using the Nikon Eclipse system (Nikon Instruments Inc., Tokyo, Japan) equipped with FITC and TRITC filters. Images were taken with a ×100 oil immersion objective lens. Images were enhanced and scale bar were added using ImageJ (Fiji) software. Scale bar = 50 μm. (B) is a scatterplot created using SigmaPlot 12.0 software showing a gradual increase in Dil-LDL internalization between 0 min and 60 min, becomes higher between 60 min and 120 min and stabilizing at 240 min. At least n = 30 of cells were used for quantification of Dil-LDL signal. Error bars represent ±SEM.
FIGURE 7
FIGURE 7
(A) CHO-ldlA7 (LDLR knockout) cells overexpressing HA-tagged LDLR wild-type or HA-tagged mutant expression constructs were treated with 20 μg/ml of Dil-LDL for 2 hours. The first and the fifth vertical panels (a–o) were probed with anti-HA primary antibody and stained with Alexa-Fluor 488. Dil-LDL is already fluorescently RFP tagged and is represented in the second and sixth vertical panels (a–o). TO-PRO-3 iodide is a blue nucleus stain represented in the third and seventh vertical panels (a–o). LDLR, Dil-LDL, and TO-PRO-3 iodide images were merged as seen in the fourth and eighth vertical panels (a–o). All images were captured using the Nikon Eclipse system (Nikon Instruments Inc., Tokyo, Japan) equipped with FITC and TRITC filters in stacks. All images were merged using ImageJ (Fiji) software. Scale bar = 50 μm. (B) A bar graph was generated using SigmaPlot 12.0 software to measure the (%) of Dil-LDL internalization of all the LDLR missense variants in reference to the LDLR wild type. At least n = 20 cells were used to quantify Dil-LDL’s signal. p.E277K depicted the highest Dil-LDL internalization 20% higher than the wild type. p.D178N Dil-LDL internalization was reduced up to 60%. The rest of the LDLR missense variants have shown up to 60%–70% reduced Dil-LDL internalization. Statistical analysis was run with SigmaPlot 12.0 software using ANOVA on RANKS of the LDLR missense variants versus the wild type. The p-value was calculated at (*) p ≤ 0.05; (**) p ≤ 0.01; (***) p ≤ 0.001 using Dunn’s test.

Similar articles

References

    1. Abifadel M., Boileau C. (2023). Genetic and molecular architecture of familial hypercholesterolemia. J. Intern. Med. 293 (2), 144–165. 10.1111/joim.13577 - DOI - PMC - PubMed
    1. Alabi A., Xia X. D., Gu H. M., Wang F., Deng S. J., Yang N., et al. (2021). Membrane type 1 matrix metalloproteinase promotes LDL receptor shedding and accelerates the development of atherosclerosis. Nat. Commun. 12 (1), 1889. 10.1038/s41467-021-22167-3 - DOI - PMC - PubMed
    1. Albornoz N., Bustamante H., Soza A., Burgos P. (2019). Cellular responses to proteasome inhibition: molecular mechanisms and beyond. Int. J. Mol. Sci. 20 (14), 3379. 10.3390/ijms20143379 - DOI - PMC - PubMed
    1. Al-Shamsi S., Regmi D., Govender R. D. (2019). Incidence of cardiovascular disease and its associated risk factors in at-risk men and women in the United Arab Emirates: a 9-year retrospective cohort study. BMC Cardiovasc. Disord. 19 (1), 148–149. 10.1186/s12872-019-1131-2 - DOI - PMC - PubMed
    1. Arias-Moreno X., Velazquez-Campoy A., Rodríguez J. C., Pocoví M., Sancho J. (2008). Mechanism of low density lipoprotein (LDL) release in the endosome: implications of the stability and Ca2+ affinity of the fifth binding module of the LDL receptor. J. Biol. Chem. 283 (33), 22670–22679. 10.1074/jbc.M802153200 - DOI - PubMed

LinkOut - more resources