. 2024 Jul 24:15:1411957.
doi: 10.3389/fimmu.2024.1411957. eCollection 2024.

Cytosolic protein translation regulates cell asymmetry and function in early TCR activation of human CD8+ T lymphocytes

Affiliations

Cytosolic protein translation regulates cell asymmetry and function in early TCR activation of human CD8+ T lymphocytes

Álvaro Gómez-Morón et al. Front Immunol. .

Erratum in

Abstract

Introduction: CD8+ cytotoxic T lymphocytes (CTLs) are highly effective in defending against viral infections and tumours. They are activated through the recognition of peptide-MHC-I complex by the T-cell receptor (TCR) and co-stimulation. This cognate interaction promotes the organisation of intimate cell-cell connections that involve cytoskeleton rearrangement to enable effector function and clearance of the target cell. This is key for the asymmetric transport and mobilisation of lytic granules to the cell-cell contact, promoting directed secretion of lytic mediators such as granzymes and perforin. Mitochondria play a role in regulating CTL function by controlling processes such as calcium flux, providing the necessary energy through oxidative phosphorylation, and its own protein translation on 70S ribosomes. However, the effect of acute inhibition of cytosolic translation in the rapid response after TCR has not been studied in mature CTLs.

Methods: Here, we investigated the importance of cytosolic protein synthesis in human CTLs after early TCR activation and CD28 co-stimulation for the dynamic reorganisation of the cytoskeleton, mitochondria, and lytic granules through short-term chemical inhibition of 80S ribosomes by cycloheximide and 80S and 70S by puromycin.

Results: We observed that eukaryotic ribosome function is required to allow proper asymmetric reorganisation of the tubulin cytoskeleton and mitochondria and mTOR pathway activation early upon TCR activation in human primary CTLs.

Discussion: Cytosolic protein translation is required to increase glucose metabolism and degranulation capacity upon TCR activation and thus to regulate the full effector function of human CTLs.

Keywords: T cell activation; cell asymmetry; cytoskeleton; cytotoxic CD8+ T lymphocytes; immunological synapse; metabolism; mitochondria; protein translation.


Conflict of interest statement

The authors declare that the research was conducted in the absence of any commercial or financial relationships that could be construed as a potential conflict of interest. The author(s) declared that they were an editorial board member of Frontiers, at the time of submission. This had no impact on the peer review process and the final decision.

Figures

Figure 1
Figure 1
Cytosolic protein translation supports tubulin cytoskeleton reorganisation in human CD8+ cytotoxic T lymphocytes during T-cell receptor (TCR) and CD28 activation. (A, B) Fluorescence images of human cytotoxic T lymphocytes (CTLs) treated with vehicle (CTRL), cycloheximide (CHX; 20 μg/mL), or puromycin (PURO; 50 μg/mL) for 1 h and conjugated with (A) control or (B) stimulating beads. Green, α-tubulin; magenta, PCM1; blue, DAPI; BF, brightfield. Maximal projections are shown. Bar, 5 μm. (C) Graph showing quantification of microtubule-organising centre (MTOC) distance to the immunological synapse (IS). Data are mean ± SD; CTRL(−), n = 74; CTRL(+), n = 85; CHX(−), n = 74; CHX(+), n = 90; PURO(−), n = 74; and PURO(+), n = 80, cells analysed from six healthy donors; one-way ANOVA. **, p < 0.01; ****, p < 0.0001; ns, non-significant. (D) K40-α-tubulin acetylation in CTLs pre-treated as in panel A were stimulated or not with αCD3/αCD28 tetramers at indicated times. (E) Graph showing densitometric quantification of acetylated K40-α-tubulin normalised to total α-tubulin and referenced to non-stimulated CTRL. Data are mean ± SEM; n = 3; two-way ANOVA. *, p < 0.05. (F) Phosphorylation of PLCγ1 (pY783) and Erk1/2 (pT202/Y204) in CTLs pre-treated as in panel A and stimulated or not with αCD3/αCD28 tetramers at indicated times. (G, H) Graphs showing quantification of densitometries of (G) PLCγ1 (pY783) and (H) Erk1/2 (pT202/Y204) normalised to PLCγ1 and Erk1/2 and referenced to non-stimulated CTRL. Data are mean ± SEM; (G), n = 7; (H), n = 4; two-way ANOVA. *, p < 0.05; **, p < 0.01; ****, p < 0.0001. See also Supplementary Figure 1 .
Figure 2
Figure 2
Mitochondrial network reorganisation in human CD8+ cytotoxic T lymphocytes requires active cytosolic protein translation during T-cell receptor (TCR)-driven asymmetry. (A, B) Fluorescence images of human cytotoxic T lymphocytes (CTLs) treated with vehicle (CTRL), cycloheximide (CHX; 20 μg/mL), or puromycin (PURO; 50 μg/mL) for 1 h and conjugated with (A) control or (B) stimulating beads to establish immunological synapse (IS). Red, MitoTracker Orange; green, α-tubulin; magenta, PCM1; blue, DAPI; BF, brightfield. Maximal projections are shown. Bar, 5 μm. (C) Graph showing quantification of mitochondrial polarisation to the IS. Data are mean ± SD; CTRL(−), n = 63; CTRL(+), n = 65; CHX(−), n = 62; CHX(+), n = 64; PURO(−), n = 64; and PURO(+), n = 64, cells analysed from six healthy donors; one-way ANOVA. ****, p < 0.0001; ns, non-significant. (D) Graph showing quantification of mitochondria distance to PCM-1. Data are mean ± SD; CTRL(−), n = 26; CTRL(+), n = 27; CHX(−), n = 27; CHX(+), n = 29; PURO(−), n = 27; and PURO(+), n = 28, cells analysed from six healthy donors; one-way ANOVA. *, p < 0.05; **, p < 0.01; ***, p < 0.001; ****, p < 0.0001; ns, non-significant. (E) Fluorescence images of human cytotoxic T lymphocytes (CTLs) treated as in panel A and settled over stimulatory surfaces coated with anti-CD3 and anti-CD28 monoclonal antibodies. Magenta, MitoTracker Orange; green, Tom-20; blue, DAPI; BF, brightfield. Images are single planes of the IS plane. Bar, 5 μm. (F) Graph showing quantification of the ratio between MitoTracker Orange and Tom-20 mean fluorescence intensity (MFI). Data are mean ± SD; CTRL(−), n = 113; CTRL(+), n = 102; CHX(−), n = 77; CHX(+), n = 138; PURO(−), n = 77; and PURO(+), n = 96, cells analysed from six healthy donors; one-way ANOVA. *, p < 0.05; **, p < 0.01; ns, non-significant. See also Supplementary Figure 2 .
Figure 3
Figure 3
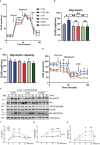
Protein translation on 80S ribosomes is required for mitochondrial respiration in human CD8+ cytotoxic T lymphocytes. (A) Mitochondrial oxygen consumption rate (OCR) in resting and stimulated human cytotoxic T lymphocytes (CTLs) treated with vehicle (CTRL), cycloheximide (CHX; 20 μg/mL), or puromycin (PURO; 50 μg/mL) for 1 h. Stimulation was with αCD3/αCD28 tetramers. Oligomycin, CCCP, and rotenone plus antimycin A were injected as indicated. (B, C) Graphs show (B) basal respiration and (C) ATP production. (D) Extracellular acidification rate (ECAR) from experiment shown in panel (A) Data are mean ± SEM from five technical replicates from six healthy donors. (A, D) A representative experiment out of six. Linear mixed model was used to analyse differences in (A) OCR and (D) ECAR and one-way ANOVA test for (B) basal respiration and (C) ATP production. *, p < 0.05; **, p < 0.01; ***, p < 0.001; ****, p < 0.0001; ns, non-significant. (E) Mitochondrial mass of CTLs treated as in panel (A) Graph shows the geometric mean (GeoMean) of nonyl acridine orange (NAO) fluorescence. Graph showing mean ± SD; n = 4. Unpaired t-test; ns, non-significant. See also Supplementary Figure 3 for gating strategy.
Figure 4
Figure 4
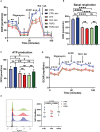
Glycolytic response during T-cell receptor (TCR) activation requires active cytosolic protein translation in human CD8+ cytotoxic T lymphocytes. (A) Glycolytic response estimated by extracellular acidification rate (ECAR) in resting or stimulated human cytotoxic T lymphocytes (CTLs) treated with vehicle (CTRL), cycloheximide (CHX; 20 μg/mL), or puromycin (PURO; 50 μg/mL) for 1 h. Stimulation was with αCD3/αCD28 tetramers. Glucose, oligomycin, and 2-deoxyglucose (2-DG) were injected as indicated. (B, C) Graphs show the rate of (B) glycolysis and (C) glycolytic capacity. Data are mean ± SEM from five technical replicates from six healthy donors. (D) Oxygen consumption rate (OCR) from the experiment in panel (A). (A, D) A representative experiment out of six. Linear mixed model was used to analyse differences in (A) ECAR and (D) OCR and one-way ANOVA test for (B) glycolysis and (C) glycolytic capacity. *, p < 0.05; **, p < 0.01; ****, p < 0.0001; ns, non-significant. (E) Phosphorylation of Akt (S473), mTOR (S2448), and S6 (S235/S236) in CTLs pre-treated as in panel A and stimulated with αCD3/αCD28 tetramers at indicated times. Graphs showing quantification of densitometries of (F) Akt (S473), (G) mTOR (S2448), and (H) S6 (S235/S236) blots; data are normalised to p150-Glued and referenced to non-stimulated CTRL. Data are mean ± SEM; (F), n = 4 (G), n = 5 (H), n = 4; two-way ANOVA. *, p < 0.05; **, p < 0.01; *** p < 0.001; **** p < 0.0001.
Figure 5
Figure 5
Polyfunctional capacity of human CD8+ cytotoxic T lymphocytes requires cytosolic protein translation during early T-cell activation. (A) Representative fluorescence images from total internal reflection fluorescence microscopy (TIRFm) of LysoTracker-Red DND-99-loaded cytotoxic T lymphocytes (CTLs). Brightfield images and granule trajectories are also provided. CTLs were treated with vehicle (CTRL), cycloheximide (CHX; 20 μg/mL), or puromycin (PURO; 50 μg/mL) for 1 h and then settled onto glass-bottom chambers coated with anti-CD3 (Hit3a clone) and anti-CD28 (CD28.2 clone) monoclonal antibodies. Video recording was initiated upon cell adhesion (37°C and 5% CO2). Images were acquired for 5 min every 90 ms. Individual granule trajectories were obtained by fluorescent tracking of puncta. Graphs showing quantification of lytic granule parameters at the immune-synapse-like structure performed for each cell: number of granules/cell, granule tracking duration in seconds, and granule displacement in µm. Data of mean ± SD; CTRL, n = 9; CHX, n = 9; and PURO, n = 10 cells analysed from four independent healthy donors; unpaired t-test; *, p < 0.05; ***, p < 0.001; ns, non-significant. (B) Flow cytometry analysis of LysoTracker-Red fluorescence in vehicle (CTRL), cycloheximide (CHX; 20 μg/mL), or puromycin (PURO; 50 μg/mL) pre-treated CTLs and loaded with LysoTracker-Red DND-99 (1 μM) for 1 h. Graph shows the geometric mean (GeoMean) of LysoTracker-Red fluorescence. Graph showing mean SD; n = 4; unpaired t-test. See also Supplementary Figure 3B for gating strategy. (C, D) IFN-γ production in (C) CTLs and (D) culture supernatants treated as in panel (B) Graph showing box and whiskers (median plus min and max) from n = 6 healthy donors; two-tailed non-parametric Wilcoxon test. (E–I) Fold change in proportions of CD8+ T cells stimulated with αCD3/αCD28 tetramers and treated with vehicle (CTRL), cycloheximide (CHX; 20 μg/mL), or puromycin (PURO; 50 μg/mL), expressing (E) CD107a, (F) perforin, (G) TNF-α, (H) IFN-γ, and (I) Granzyme (B) Graphs showing box and whiskers (median plus min and max) from n = 8 healthy donors; two-tailed non-parametric Wilcoxon test. *, p < 0.05; **, p < 0.01. (J–L) Peripheral blood mononuclear cells (PBMCs) treated with vehicle (CTRL), cycloheximide (CHX; 20 μg/mL), or puromycin (PURO; 50 μg/mL), stimulated with CMV-peptides for 18 h, and assayed for (J) IFN-γ production by enzyme-linked immunosorbent spot (ELISPOT). (K) Percentage of CD14+ live cells and (L) percentage of CD8+ live cells. Graphs showing mean ± SD; n = 3 healthy donors; two-tailed non-parametric Wilcoxon test. *, p < 0.05; **, p < 0.01. See also Supplementary Figures 4 , 6 for gating strategies.
Figure 6
Figure 6
Inhibition of cytosolic protein synthesis during T-cell receptor (TCR) and CD28 stimulation modulates the recruitment of tubulin molecular motors to mitochondria in human CD8+ cytotoxic T lymphocytes. (A, B) Western blotting showing distribution of components of dynein (p74-dynein intermediate chain) and kinesin-1 [Kinesin heavy chain (KHC); kinesin light chain (KLC)] molecular motors and the dynactin adaptor (p150-Glued), K40-acetylated and total α-tubulin, and β-actin and VDAC in (A) total lysate and (B) isolated mitochondria from cytotoxic T lymphocytes (CTLs) treated with vehicle (CTRL), cycloheximide (CHX; 20 μg/mL), or puromycin (PURO; 50 μg/mL) for 1 h and stimulated with αCD3/αCD28 tetramers for 15 min. A representative experiment out of four is shown. Graphs showing densitometric quantification ratios of indicated proteins normalised to VDAC and referenced to non-stimulated CTRL. Box and whiskers, data are median plus min and max from n = 4 healthy donors; two way ANOVA. *, p < 0.05; **, p < 0.01; ***, p < 0.001; ****, p < 0.0001; ns, non-significant.

References

    1. Zhang N, Bevan MJ. CD8(+) T cells: foot soldiers of the immune system. Immunity. (2011) 35:161–8. doi: 10.1016/j.immuni.2011.07.010 - DOI - PMC - PubMed
    1. Halle S, Halle O, Förster R. Mechanisms and dynamics of T cell-mediated cytotoxicity in vivo . Trends Immunol. (2017) 38:432–43. doi: 10.1016/j.it.2017.04.002 - DOI - PubMed
    1. de Saint Basile G, Ménasché G, Fischer A. Molecular mechanisms of biogenesis and exocytosis of cytotoxic granules. Nat Rev Immunol. (2010) 10:568–79. doi: 10.1038/nri2803 - DOI - PubMed
    1. Cassioli C, Baldari CT. The expanding arsenal of cytotoxic T cells. Front Immunol. (2022) 13:883010. doi: 10.3389/fimmu.2022.883010 - DOI - PMC - PubMed
    1. McKenzie B, Valitutti S. Resisting T cell attack: tumor-cell-intrinsic defense and reparation mechanisms. Trends Cancer. (2023) 9:198–211. doi: 10.1016/j.trecan.2022.12.003 - DOI - PubMed

MeSH terms

Substances

LinkOut - more resources