. 2024 Dec 5;26(12):2272-2287.
doi: 10.1093/neuonc/noae149.

Interferon regulatory factor 8-driven reprogramming of the immune microenvironment enhances antitumor adaptive immunity and reduces immunosuppression in murine glioblastoma

Affiliations

Interferon regulatory factor 8-driven reprogramming of the immune microenvironment enhances antitumor adaptive immunity and reduces immunosuppression in murine glioblastoma

Megan Montoya et al. Neuro Oncol. .

Abstract

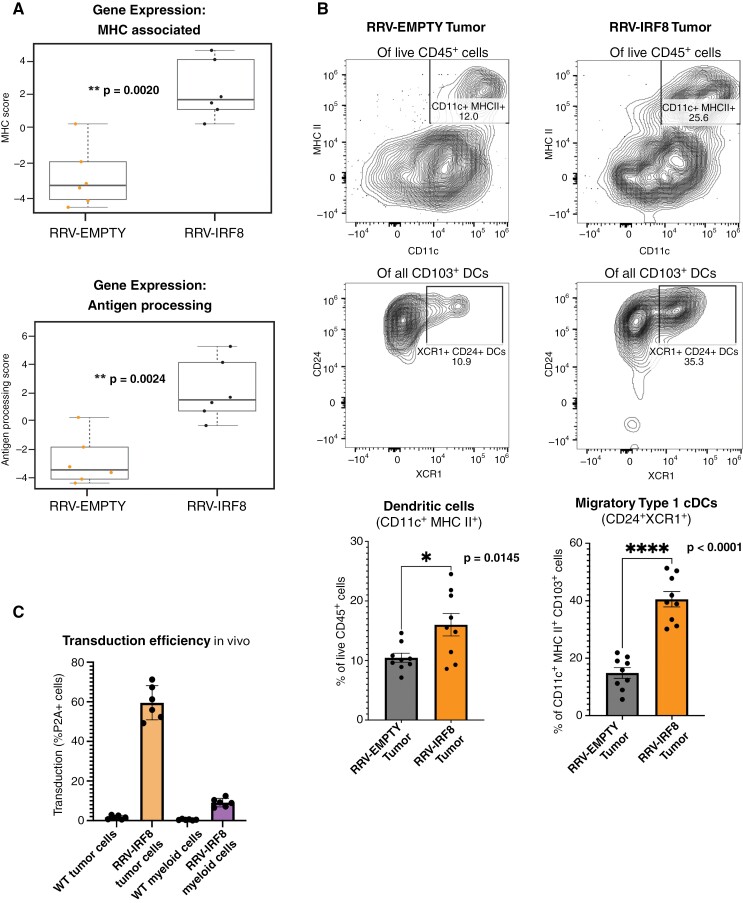
Background: Glioblastoma (GBM) has a highly immunosuppressive tumor immune microenvironment (TIME), largely mediated by myeloid-derived suppressor cells (MDSCs). Here, we utilized a retroviral replicating vector (RRV) to deliver Interferon Regulatory Factor 8 (IRF8), a master regulator of type 1 conventional dendritic cell (cDC1) development, in a syngeneic murine GBM model. We hypothesized that RRV-mediated delivery of IRF8 could "reprogram" intratumoral MDSCs into antigen-presenting cells and thereby restore T-cell responses.

Methods: Effects of RRV-IRF8 on survival and tumor growth kinetics were examined in the SB28 murine GBM model. The immunophenotype was analyzed by flow cytometry and gene expression assays. We assayed functional immunosuppression and antigen presentation by ex vivo T-cell-myeloid co-culture.

Results: Intratumoral injection of RRV-IRF8 in mice bearing intracerebral SB28 glioma significantly suppressed tumor growth and prolonged survival. RRV-IRF8 treated tumors exhibited significant enrichment of cDC1s and CD8+ T-cells. Additionally, myeloid cells derived from RRV-IRF8 tumors showed decreased expression of the immunosuppressive markers Arg1 and IDO1 and demonstrated reduced suppression of naïve T-cell proliferation in ex vivo co-culture, compared to controls. Furthermore, DCs from RRV-IRF8 tumors showed increased antigen presentation compared to those from control tumors. In vivo treatment with azidothymidine (AZT), a viral replication inhibitor, showed that IRF8 transduction in both tumor and non-tumor cells is necessary for survival benefit, associated with a reprogrammed, cDC1- and CD8 T-cell-enriched TIME.

Conclusions: Our results indicate that reprogramming of glioma-infiltrating myeloid cells by in vivo expression of IRF8 may reduce immunosuppression and enhance antigen presentation, achieving improved tumor control.

Keywords: IRF8; MDSC; RRV-mediated gene therapy; glioblastoma; immunosuppression.


Conflict of interest statement

NK is Chief Scientific Officer at 4D Molecular Therapeutics.

Figures

Figure 1.
Figure 1.
Human and murine glioblastoma contain proliferating myeloid cell populations. (A) Flow cytometric analysis of Arg1 expression in all myeloid cells (CD45+ CD11b+) and M-MDSCs (CD45+ CD11b+ Ly6C+). Bars represent the mean of 6 biological replicates. (B) Expression of intracellular Ki67 in immune (CD45+) and myeloid (CD45+ CD11b+) cells. IgG2a K isotype was used to define gates. Bar graph (right) represents in vivo expression of Ki67 in tumor, immune, and myeloid cells. Bars show the mean of 6 biological replicates. (C) Expression of proliferation markers Ki67, PCNA, Cyclin A, and Phosphorylated Histone H3 in human primary GBM samples. Flow cytometry plots are pre-gated for live CD45+ immune cells.
Figure 2.
Figure 2.
Transduction with Interferon Regulatory Factor 8 (IRF8) in vivo suppresses the growth of intracerebral SB28 tumors. (A) Schematic of in vivo studies. Pre-mixed model: SB28 cells pre-transduced at 2% with either RRV-EMPTY or RRV-IRF8 were implanted intracerebrally. Direct injection model: SB28 WT cells were implanted intracranially and concentrated RRV at 1.2 x 10⁷ transducing units (TU)/mL (EMPTY or IRF8) or PBS was injected at day 4 post-tumor inoculation using the same coordinates. Tumor growth kinetics were monitored using bioluminescence (BLI) twice per week until study completion. Tissues were harvested and dissociated into single cells for analysis. (B) Kaplan–Meier curves showing survival; Pre-mixed: SB28 WT, SB28 RRV-EMPTY, and SB28 RRV-IRF8 (C) Pre-mixed: BLI imaging data corresponding with tumor growth kinetics. P-values assessed on day 12 post-tumor inoculation. (D) Kaplan–Meier curves showing survival; Direct injection: PBS inj., RRV-EMPTY inj., RRV-IRF8 inj. (E) Direct Injection: averages of BLI imaging data corresponding with tumor growth kinetics (n = 20 mice per group); P-values assessed on day 14 post-tumor inoculation.
Figure 3.
Figure 3.
Interferon Regulatory Factor 8 (IRF8) transduction enhances the number of glioblastoma-infiltrating cytotoxic T-cells. (A) Left panel, Immune cell type changes between groups. Each cell type is associated with a set of genes; differential expression of gene sets is correlated with cell type abundance. Right panel, cell type scores for each animal (n = 6). Raw cell type scores, standard deviation, and P-values are shown in Supplementary Table 2. Cell type profiling algorithm was previously described by Danaher et al (PMID: 28239471). (B) Box-and-whisker plots derived from the expression of T-cell genes (Supplementary Table 3). (C) Representative flow plots of pan T-cells (CD45+ CD3+) and CD4 (CD45+ CD3+ CD4+) or CD8 (CD45+ CD3+ CD8+) T-cells. Bars represent the mean of 9–10 biological replicates.
Figure 4.
Figure 4.
Interferon Regulatory Factor 8 (IRF8) transduction enhances the number of glioblastoma-infiltrating type 1 conventional dendritic cells. (A) Box-and-whisker plots derived from the expression of MHC-associated or antigen-processing genes (Supplementary Tables 4 and 5). (B) Representative flow plots of the pan-DC (CD45+ CD11c+ MHC II+) and cDC1 populations. Live cells were gated on CD45+ CD11b- CD11c+ MHC II+ and CD103. The cDC1 populations were further refined by selecting CD24+ XCR1+, markers for terminally differentiated cDC1s capable of antigen cross-presentation. Bars represent the mean of 9 biological replicates derived from day 18 tumors. (C) Transduction efficiency represented by the expression of the RRV marker, P2A. Samples were analyzed at day 18 post-tumor inoculation. Bars represent the mean of 6 biological replicates.
Figure 5.
Figure 5.
Infection of non-tumor cells by RRV-IRF8 is necessary for survival benefit and slowed tumor growth. (A) Mice were given 0.4 mg/mL AZT + 2% sucrose water or 2% sucrose water-only control, with drug administration beginning 2 days prior to tumor inoculation and continuing until the study endpoint (day 17 post-tumor inoculation). Representative flow plots of green fluorescence protein+ tumor cells in mice receiving AZT or control water. Bars represent the mean of 3 biological replicates. (B) BLI tumor growth kinetics plots. Six groups; n = 10 mice per group. BLI was performed twice weekly until the study endpoint. BLI concluded at day 60 for 2 long-term surviving animals. (C) Average BLI tumor growth kinetics. (D) Kaplan–Meier curves showing survival. (E) Median survival for all groups and significance comparisons for RRV-IRF8 2% versus 100%, RRV-IRF8 2% versus 30%, and RRV-IRF8 30% versus 100%. (F) Box-and-whisker plots show differential expression of T-cell function- and DC function-related genes between RRV-IRF8 100% + AZT (n = 6 biological replicates) and RRV-IRF8 2% groups (n = 5 or 6 biological replicates).
Figure 6.
Figure 6.
IRF8 transduction reduces immunosuppressive myeloid cells and enhances antigen presentation. (A) Representative flow plots of Arg1 expression in Ly6C+ cells, all plots pre-gated on live CD45+ CD11b+ cells. (B) Bars show Arg1 expression in M-MDSCs and PMN-MDSCs, representing the mean of 6 biological replicates. (C) Left, positive, and negative controls for T-cell activation; gates set on negative control peak. T-cell/myeloid cell co-culture at 0.8:1 ratio. Intratumoral myeloid cells were isolated from day 18 RRV-EMPTY or RRV-IRF8 tumors. Naïve T-cells were isolated from age-matched non-tumor bearing mice. Representative flow plots show T-cell proliferation (CFSE peaks) after 4.5 days of co-culture. Bars represent the mean of 6 biological replicates (n = 3 technical replicates for each).(D) OT-1 T-cell/DC co-culture: CD11c+ DCs were isolated from SB28 OVA RRV-EMPTY or RRV-IRF8 tumors and cervical lymph nodes. Representative flow plots show T-cell proliferation (CFSE peaks) after 4 days of co-culture. Bars represent the mean of 6 biological replicates (n = 2 technical replicates for each biological replicate).

Update of

References

    1. Mohammed S, Dinesan M, Ajayakumar T.. Survival and quality of life analysis in glioblastoma multiforme with adjuvant chemoradiotherapy: A retrospective study. Rep Pract Oncol Radiother. 2022;27(6):1026–1036. - PMC - PubMed
    1. Schaff LR, Mellinghoff IK.. Glioblastoma and other primary brain malignancies in adults: a review. JAMA. 2023;329(7):574–587. - PMC - PubMed
    1. Chuntova P, Chow F, Watchmaker PB, et al. Unique challenges for glioblastoma immunotherapy-discussions across neuro-oncology and non-neuro-oncology experts in cancer immunology. Meeting Report from the 2019 SNO immuno-oncology think tank. Neuro-Oncol. 2021;23(3):356–375. - PMC - PubMed
    1. Alban TJ, Alvarado AG, Sorensen MD, et al. Global immune fingerprinting in glioblastoma patient peripheral blood reveals immune-suppression signatures associated with prognosis. JCI Insight. 2264;3(21):e12. - PMC - PubMed
    1. Sharma P, Aaroe A, Liang J, Puduvalli VK.. Tumor microenvironment in glioblastoma: Current and emerging concepts. Neurooncol. Adv.. 2023;5(1):vdad009. - PMC - PubMed

MeSH terms

Substances