. 2024 Oct 7;223(10):e202401024.
doi: 10.1083/jcb.202401024. Epub 2024 Aug 8.

AMPK activation induces RALDH+ tolerogenic dendritic cells by rewiring glucose and lipid metabolism

Affiliations

AMPK activation induces RALDH+ tolerogenic dendritic cells by rewiring glucose and lipid metabolism

Eline C Brombacher et al. J Cell Biol. .

Abstract

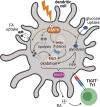
Dendritic cell (DC) activation and function are underpinned by profound changes in cellular metabolism. Several studies indicate that the ability of DCs to promote tolerance is dependent on catabolic metabolism. Yet the contribution of AMP-activated kinase (AMPK), a central energy sensor promoting catabolism, to DC tolerogenicity remains unknown. Here, we show that AMPK activation renders human monocyte-derived DCs tolerogenic as evidenced by an enhanced ability to drive differentiation of regulatory T cells, a process dependent on increased RALDH activity. This is accompanied by several metabolic changes, including increased breakdown of glycerophospholipids, enhanced mitochondrial fission-dependent fatty acid oxidation, and upregulated glucose catabolism. This metabolic rewiring is functionally important as we found interference with these metabolic processes to reduce to various degrees AMPK-induced RALDH activity as well as the tolerogenic capacity of moDCs. Altogether, our findings reveal a key role for AMPK signaling in shaping DC tolerogenicity and suggest AMPK as a target to direct DC-driven tolerogenic responses in therapeutic settings.


Conflict of interest statement

Disclosures: C.R. Berkers reported grants from Trajectum Pharma outside the submitted work. No other disclosures were reported.

Figures
None
Graphical abstract
Figure S1.
Figure S1.
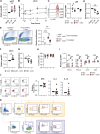
Effects of 991 and RALDH inhibition on moDCs and T cell priming. (A and B) Phosphorylation of ACC (Ser79) as determined by flow cytometry upon (A) different concentrations of 991 and (B) at different time points after treatment with 100 µM 991. (C) Representative histogram and normalized quantification of phosphorylation of S6 (Ser240). (D) Normalized percentage of proliferation of bystander T cells after a T cell suppression assay. (E) Representative plots of irradiated and non-irradiated T cells and percentage of proliferation of bystander T cells after a T cell suppression assay with either non-irradiated or irradiated test T cells. (F) Normalized quantification of phosphorylation of ACC (Ser79) after treatment with H2O/AICAR. (G) Normalized percentage of proliferation of bystander T cells after a T cell suppression assay. (H) Percentage of live cells as % of total moDCs. (I) Normalized expression of indicated markers on moDCs. (J) Representative plots and normalized percentages of CD4+ T cells of intracellular cytokines after restimulation with PMA/ionomycin in the presence of Brefeldin A. (K) Gating strategy of Treg subsets as described in Fig. 1 I. Results are expressed as means ± SEM. Error bars represent SEM. Data are pooled from six donors from four independent experiments (A); three donors from three independent experiments (B); five donors from three independent experiments (C); three donors from one experiment (D); representative of one out of two donors from one experiment (E); four to six donors from three independent experiments (G and H); four donors from one experiment (I); and eight donors from four independent experiments (J). Statistical analyses were performed using repeated measures one-way ANOVA with Tukey’s post hoc test (A, D, and G), repeated measures two-way ANOVA with Sidak’s post-hoc test (C, E, H, and I) and paired t test (J). *P < 0.05, **P < 0.01, ***P < 0.001. geoMFI, geometric mean fluorescence intensity.
Figure 1.
Figure 1.
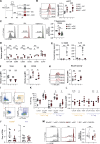
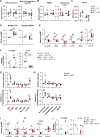
AMPK activation induces tolerogenic DCs via promotion of RALDH activity. (A) Schematic overview of experimental setup. Monocytes were isolated from PBMCs and differentiated in moDCs in the presence of GM-CSF + IL-4. On day (d) 5, cells were treated with either DMSO or 100 µM 991. On day 6, 100 ng/ml of LPS was added if indicated, and 24 h later, cells were harvested for functional assays. (B) Representative histogram and normalized quantification of phosphorylation of ACC (Ser79). (C) Representative histograms and normalized percentage of proliferation of bystander T cells after co-culture with irradiated T cells primed with 991/DMSO-treated mDCs. (D) Normalized expression of indicated markers by moDCs. (E) Concentration of IL-10 and IL12p40 in the supernatants of mDCs after a 24-h stimulation. (F and G) Normalized expression of TLR4 and CD103. (H) Representative histogram and normalized quantification of RALDH activity. (I) Representative gating strategy to identify Foxp3+CD25+CD127-induced Treg and Foxp3CD25CD127LAG3+CD49b+ Tr1s. (J) Frequency of Foxp3+ Tregs and Tr1s DC–T cell co-cultures. (K) Frequency of each Treg subset expressing indicated markers. (L) Normalized expression of indicated markers by Treg subsets. (M) Representative histograms and normalized percentage of the proliferation of bystander T cells after co-culture with irradiated T cells primed with 991/DMSO-treated mDCs and in the presence or absence of RALDH inhibitor (RALDHi) bisdiamine during both mDC maturation and mDC–T cell co-culture. Results are expressed as means ± SEM. Error bars represent SEM. Data are pooled from four to six donors from three independent experiments (B–D, G, and H); representative of one out of four independent experiments (E); pooled from four donors from two independent experiments (F); and pooled from nine donors from four independent experiments (I–M). Statistical analyses were performed using repeated measures two-way ANOVA with Sidak’s post-hoc test (B, D–H, and M), one-way ANOVA for repeated measures with Sidak post-hoc test (C), or paired t test (J–L). *P < 0.05, **P < 0.01, ***P < 0.001. geoMFI, geometric mean fluorescence intensity.
Figure S2.
Figure S2.
AMPK activation induces tolerogenic DCs via promotion of RALDH activity. (A–I) Unnormalized data on which Fig. 1, B–H and Fig. S1 I is based. (A) Quantification of phosphorylation of ACC (Ser79). (B) Percentage of proliferation of bystander T cells after co-culture with irradiated T cells primed with 991/DMSO-treated mDCs. (C) Expression of indicated markers by moDCs. (D and E) Expression of TLR4 and CD103. (F) Quantification of RALDH activity by flow cytometry. (GI) Percentage of CD4+ T cells expressing indicated intracellular cytokines after restimulation with PMA/ionomycin in the presence of Brefeldin A, after coculture with indicated DCs. (J) IL-10 secretion in supernatants of CD4+ T cells as determined by ELISA, harvested after a 24 h restimulation with anti-CD3 and anti-CD28, after coculture with indicated DCs. (K) Representative histograms of RALDH activity after treatment with RALDH inhibitor bisdiamine (RALDHi). Representative of four independent experiments. (L) Normalized expression of indicated markers. (M) Normalized concentration of IL-12p40 and IL-10 after a 24-h coculture with CD40L-expressing J558 cells. (N) Normalized quantification of bystander T cell proliferation after co-culture with irradiated T cells primed with 991/DMSO-treated mDCs cultured in the presence or absence of RALDH inhibitor bisdiamine (RALDHi). Results are expressed as means ± SEM. Error bars represent SEM. Data are pooled from four to six donors from three independent experiments (A, B, and D–F); eight donors from four independent experiments (G–I), nine donors from five independent experiments, representative of one out of two donors from one experiment (K); pooled from 10 to 12 donors from five independent experiments (L); five donors from three independent experiments (M); and five donors from two independent experiments (N). Statistical analyses were performed using repeated measures two-way ANOVA with Sidak’s post-hoc test (A, C–F, and K–N), one-way ANOVA for repeated measures with Sidak post-hoc test (B) or paired t test (G–J). *P < 0.05, **P < 0.01, ***P < 0.001. geoMFI, geometric mean fluorescence intensity.
Figure S3.
Figure S3.
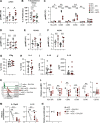
Effects of AMPK activation on proteome and metabolome of moDCs. (A and B) Volcano plots depicting all identified (A) proteins and (B) metabolites. Blue and red dots denote the significantly down- and upregulated proteins/metabolites, respectively. (C) Venn diagrams showing the overlap between up- and downregulated proteins and metabolites upon AMPK activation in mDCs and iDCs. (D and E) Heatmaps depicting the relative expression of the 20 most up- and downregulated (D) proteins and (E) metabolites upon AMPK activation in mDCs, ranked by log2 fold change and filtered by adjusted P value <0.05. (F) Normalized expression of indicated markers. (G) The relative concentration of IL-12p40 and IL-10 in the supernatants of mDCs after co-culture with CD40L-expressing J558 cells. Results are expressed as means ± SEM. Error bars represent SEM. Data are pooled from four donors from two independent experiments (A–E); pooled from seven donors from three independent experiments (F); and five donors from two independent experiments (G). Statistical analyses were performed using repeated measures two-way ANOVA with Sidak’s post-hoc test. *P < 0.05, **P < 0.01. geoMFI, geometric mean fluorescence intensity.
Figure 2.
Figure 2.
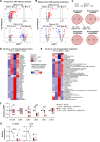
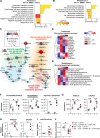
AMPK activation drives glycerophospholipid breakdown. Proteomics and metabolomics were performed on DMSO/991-treated iDCs and mDCs. (A) GO pathway enrichment of significantly up- and downregulated proteins in AMPK-activated mDCs. (B) KEGG enrichment analysis of significantly up- and downregulated metabolites in AMPK-activated mDCs. (C) Network analysis of integrated proteomics and metabolomics data from mDCs. (D and E) Heatmap depicting relative expression of (D) proteins and (E) metabolites involved in glycerophospholipid metabolism. (F and G) Dotplots showing the abundance as determined by metabolomics or proteomics of (F) metabolites and (G) proteins involved in glycerophospholipid metabolism that are strongly affected by AMPK activation. (H) Relative gene expression of PNPLA6 and GPCPD1 72 h after electroporation with control siRNA (siCTR), or siRNA targeting PNPLA6 or GPCPD1. (I) Normalized quantification of RALDH activity. (J) Normalized percentage of proliferation of bystander T cells after a T cell suppression assay. Results are expressed as means ± SEM. Error bars represent SEM. Data are pooled from four donors from two independent experiments (A–G), three donors from two independent experiments (H), and six donors from three independent experiments (I and J). Statistical analyses were performed using repeated measures two-way ANOVA with Sidak’s post-hoc test (F–J). *P < 0.05, **P < 0.01. geoMFI, geometric mean fluorescence intensity.
Figure 3.
Figure 3.
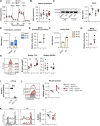
AMPK-induced tolerogenicity is driven by FAO. (A and B) Real-time OCR as measured by (A) Seahorse extracellular flux analysis and (B) quantification of basal respiration rates. R+A, rotenone + Antimycin A. (C) Western Blot of complex I (CI) and complex II (CII) of the electron transport chain and quantification of the ratio between CII and CI. (D–G) [U-13C]-palmitate tracing was performed in DMSO/991-treated mDCs. Figures show (D) total abundance of palmitoyl-L-carnitine, (E) abundance of the labeled M+16 fraction of palmitoyl-L-carnitine normalized per donor, (F) total abundance of acetyl-CoA, and (G) abundance of the labeled M+02 fraction of acetyl-CoA normalized per donor. (H) Representative histogram of Bodipy C16 uptake and normalized quantification of Bodipy C16 and Bodipy 495/503. (I) Relative gene expression of CPT1A in mDCs 72 h after electroporation with control siRNA (siCTR) or siRNA targeting CPT1A (siCPT1A). (J) Representative histogram and normalized quantification of RALDH activity. (K) Representative histograms and normalized percentage of proliferation of bystander T cells after a T cell suppression assay. Results are expressed as means ± SEM, with error bars representing SEM (B, C, E, and G–I) or means ± SD, with error bars representing SD (D and F). Data are representative of one out of three independent experiments with pooled data from two donors (A), pooled from six donors from three independent experiments (B), three donors from two independent experiments (C), three donors from one experiment (D–G), and three to five donors from three independent experiments (H–K). Statistical analyses were performed using repeated measures two-way ANOVA with Sidak’s post-hoc test (B, C, H, J, and K) or paired t tests (D–G). *P < 0.05, **P < 0.01. FCCP, fluoro-carbonyl cyanide phenylhydrazone. geoMFI, geometric mean fluorescence intensity. Source data are available for this figure: SourceData F3.
Figure S4.
Figure S4.
Effects of AMPK activation on mitochondrial metabolism and glucose metabolism. (A) Quantification of ATP production and maximal respiratory capacity of OCR derived from Fig. 3 A. (B) Normalized quantification of mitochondrial membrane potential (TMRM) and mitochondrial mass (Mitotracker green). (C) Expression of CPT1A derived from the proteomics data. (D) Normalized quantification of Bodipy C16 and Bodipy 493/503 staining. (E) Normalized expression of indicated markers. (F) Normalized concentration of IL-12p40 and IL-10 after a 24 h coculture with CD40L-expressing J558 cells. (G and H) Normalized abundance and normalized quantification of relative C13-glucose–labeled fraction of metabolites involved in (G) glycolysis and (H) TCA cycle, derived from Fig. 5, A and B. (I) Normalized expression of indicated markers. (J) Normalized concentration of IL-12p40 and IL-10 after a 24 h co-culture with CD40L-expressing J558 cells. G6P, fructose 1,6-biphosphate (F1,6BP), glycerol 3-phosphate (G3P), phosphoenolpyruvate (PEP). Results are expressed as means ± SEM. Error bars represent SEM. Data are pooled from six donors from three independent experiments (A), four to six donors from three independent experiments, (B), four donors from one experiment (C), five to six donors from three independent experiments (D–F), four donors from one experiment (G and H), eight donors from four independent experiments (I), and four donors from two independent experiments (J). Statistical analyses were performed using repeated measures two-way ANOVA with Sidak’s post-hoc test (A–F), paired t tests (G and H), or repeated measures two-way ANOVA with Tukey post-hoc test (I and J). *P < 0.05, **P < 0.01, ****P < 0.0001. geoMFI, geometric mean fluorescence intensity.
Figure 4.
Figure 4.
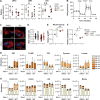
Mitochondrial fission induced by AMPK activation promotes FAO. (A) Confocal images of DMSO/991-treated iDCs and mDCs. Blue: nucleus. Red: mitochondria. (B) Quantification of the average aspect ratio of mitochondria per cell. (C) Western Blot of phosphorylated DRP1 (pDRP1), total DRP1 (tDRP1), phosphorylated MFF (pMFF), total MFF (tMFF), and HSP90 and the ratio for pDRP1/tDRP1 and pMFF/tMFF, normalized for HSP90 and relative to DMSO-treated mDCs. (D–G) [U-13C]-palmitate tracing was performed in DMSO/991-treated mDCs, with or without mdivi1. (D) Total abundance of palmitoyl-L-carnitine and (E) abundance of the labeled M+16 fraction of palmitoyl-L-carnitine normalized per donor and (F) total abundance of acetyl-CoA and (G) abundance of the labeled M+02 fraction of acetyl-CoA normalized per donor. Results are expressed as means ± SEM, with error bars representing SEM (B, C, E, and G) or means ± SD (D and F), with error bars representing SD. Data are pooled from seven donors from four independent experiments (B), four donors from two independent experiments (C), and four donors from one experiment (D–G). Statistical analyses were performed using repeated measures two-way ANOVA with Sidak’s post-hoc test. *P < 0.05, **P < 0.01. Source data are available for this figure: SourceData F4.
Figure S5.
Figure S5.
Effects of AMPK activation on mitochondrial fission. (A) Relative gene expression of genes regulating mitochondrial dynamics. (B) Real-time OCR as measured by Seahorse extracellular flux analysis. FCCP, fluoro-carbonyl cyanide phenylhydrazone. R+A, Rotenone + Antimycin A. (C) Confocal images of DMSO/991-treated mDCs with or without mdivi1 treatment. Blue: nucleus. Red: mitochondria. (D) Quantification of the average aspect ratio of mitochondria per cell. (E and F) (E) Normalized quantification of RALDH activity and (F) normalized percentage of proliferation of bystander T cells after a T cell suppression assay. (G and H) [U-13C]-glucose tracing was performed in DMSO/991-treated mDCs, with or without mdivi1. Figures show the total abundance of (labeled) metabolites involved in (G) glycolysis and (H) TCA cycle. G6P, fructose 1,6-biphosphate (F1,6BP), glycerol 3-phosphate (G3P), phosphoenolpyruvate (PEP), α-ketoglutarate (αKG). Results are expressed as means ± SEM, with error bars representing SEM (A, D, and E) or means ± SD, with error bars representing SD (F and G). Data are pooled from four donors from two independent experiments (A); representative of one out of two donors from one experiment (B); six donors from three independent experiments (D); five donors from three independent experiments (E); three donors from two independent experiments, (F); and four donors from one experiment (G and H). Statistical analyses were performed using repeated measures two-way ANOVA with Tukey post-hoc test (A, D–F, G, and H). *P < 0.05, **P < 0.01. geoMFI, geometric mean fluorescence intensity.
Figure 5.
Figure 5.
Glucose oxidation supports AMPK-induced tolerogenicity. (A, B, and E) [U-13C]-glucose tracing was performed in DMSO/991-treated mDCs. Figures show total abundance of (labeled) metabolites involved in (A) glycolysis, (B) TCA cycle, and (E) PPP. (C and F) Normalized quantification of RALDH activity. (D and G) Representative histograms and normalized percentage of proliferation of bystander T cells after a T cell suppression assay. G6P, fructose 1,6-biphosphate (F1,6BP), phosphoenolpyruvate (PEP), α-ketoglutarate (αKG), and Sep7P. Results are expressed as means ± SD. Error bars represent SD (A, B, and E). Data are pooled from four donors from one experiment (A, B, and E), eight donors from four independent experiments (C and D), and four donors from two experiments (F and G). Statistical analyses were performed using repeated measures two-way ANOVA with Sidak’s post-hoc test (C, D, F, and G) or paired t test (A, B, and E). *P < 0.05, ***P < 0.001. Colored * displays differences between different M+ groups. gMFI, geometric mean fluorescence intensity.

References

    1. Adamik, J., Munson P.V., Hartmann F.J., Combes A.J., Pierre P., Krummel M.F., Bendall S.C., Argüello R.J., and Butterfield L.H.. 2022. Distinct metabolic states guide maturation of inflammatory and tolerogenic dendritic cells. Nat. Commun. 13:5184. 10.1038/s41467-022-32849-1 - DOI - PMC - PubMed
    1. An, J., Ding Y., Yu C., Li J., You S., Liu Z., Song P., and Zou M.H.. 2021. AMP-activated protein kinase alpha1 promotes tumor development via FOXP3 elevation in tumor-infiltrating Treg cells. iScience. 25:103570. 10.1016/j.isci.2021.103570 - DOI - PMC - PubMed
    1. Arner, E.N., and Rathmell J.C.. 2023. Metabolic programming and immune suppression in the tumor microenvironment. Cancer Cell. 41:421–433. 10.1016/j.ccell.2023.01.009 - DOI - PMC - PubMed
    1. Awasthi, A., Carrier Y., Peron J.P.S., Bettelli E., Kamanaka M., Flavell R.A., Kuchroo V.K., Oukka M., and Weiner H.L.. 2007. A dominant function for interleukin 27 in generating interleukin 10-producing anti-inflammatory T cells. Nat. Immunol. 8:1380–1389. 10.1038/ni1541 - DOI - PubMed
    1. Basit, F., and de Vries I.J.M.. 2019. Dendritic cells require PINK1-mediated phosphorylation of BCKDE1α to promote fatty acid oxidation for immune function. Front. Immunol. 10:2386. 10.3389/fimmu.2019.02386 - DOI - PMC - PubMed

LinkOut - more resources