. 2024 Aug 27;43(8):114611.
doi: 10.1016/j.celrep.2024.114611. Epub 2024 Aug 7.

Vocalization modulates the mouse auditory cortex even in the absence of hearing

Affiliations

Vocalization modulates the mouse auditory cortex even in the absence of hearing

Thomas C Harmon et al. Cell Rep. .

Abstract

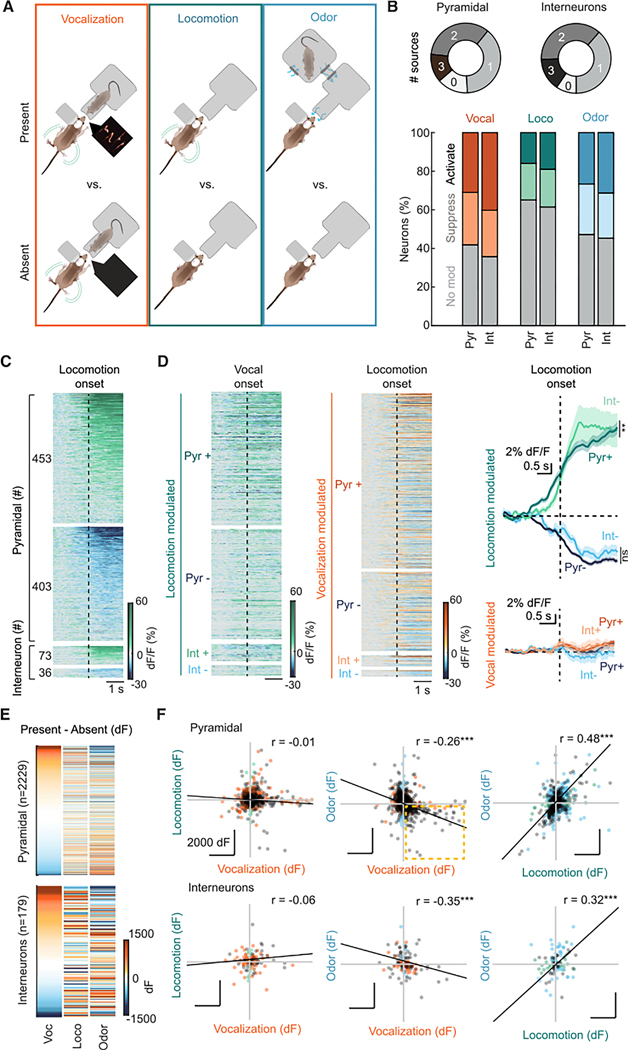
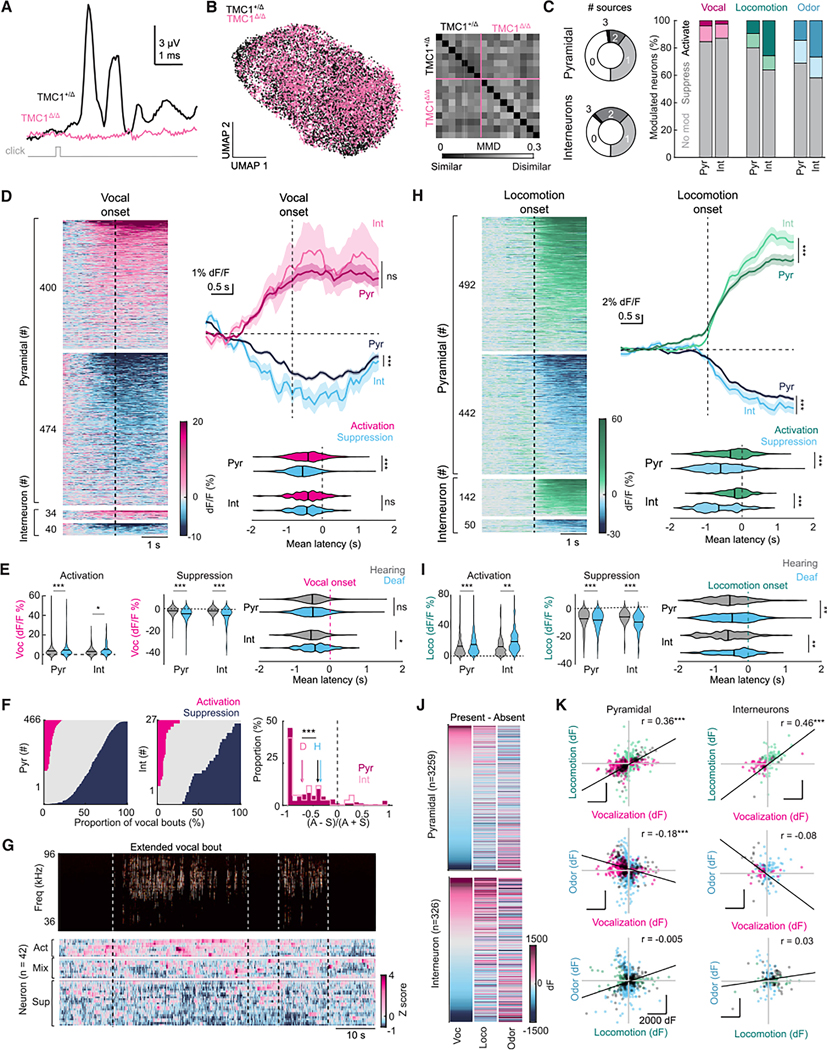
Vocal communication depends on distinguishing self-generated vocalizations from other sounds. Vocal motor corollary discharge (CD) signals are thought to support this ability by adaptively suppressing auditory cortical responses to auditory feedback. One challenge is that vocalizations, especially those produced during courtship and other social interactions, are accompanied by other movements and are emitted during a state of heightened arousal, factors that could potentially modulate auditory cortical activity. Here, we monitor auditory cortical activity, ultrasonic vocalizations (USVs), and other non-vocal courtship behaviors in a head-fixed male mouse while he interacts with a female mouse. This approach reveals a vocalization-specific signature in the auditory cortex that suppresses the activity of USV playback-excited neurons, emerges before vocal onset, and scales with USV band power. Notably, this vocal modulatory signature is also present in the auditory cortex of congenitally deaf mice, revealing an adaptive vocal CD signal that manifests independently of auditory feedback or auditory experience.

Keywords: CP: Neuroscience; auditory cortex; corollary discharge; courtship behavior; deafness; multimodal processing; vocalization.


Conflict of interest statement

Declaration of interests The authors declare no competing interests.

Figures

Figure 1.
Figure 1.. Vocalization modulates the mouse auditory cortex
(A) Schematic of experimental protocol. (B) Max projection of the GCaMP8s signal (top), tdTomato signal (middle), and both signals merged (bottom) from an example field of view. Green arrow, putative pyramidal neuron. White, interneuron with GCaMP8s. Magenta, interneuron without GCaMP8s. (C) Top, mean dF/F of neurons that responded to ≥ 1 USV playback stimulus aligned to presentations of all playback stimuli (left) and vocalization (right) ordered by magnitude of playback dF/F. Bottom left, mean dF/F ± SEM aligned to playback (light) and vocalization (dark). Asterisks, significant difference (repeated-measures ANOVA): *p < 0.05; **p < 0.01; and ***p < 0.001. Bottom right, mean dF/F during playback plotted against mean dF/F during vocalization. Blue line, linear fit. Dashed line, unity. See also Figure S1. (D) Schematic of permutation procedure. Top, time courses of female presence (binary), speed, and vocal rate. Middle, epochs when vocal modulation was present (orange) or absent (gray) and fluorescence from a modulated neuron. Bottom, markers, mean fluorescence for each epoch during which vocal modulation was present or absent, before and after shuffling, and the distribution of differences between the means of shuffled fluorescence values and the unshuffled difference value. Dotted line, threshold for considering the neuron positively modulated. (E) Left, mean dF/F of vocalization-modulated pyramidal (top) and interneurons (bottom) at vocal onset sorted into groups with positive or negative values and ordered by absolute magnitude. Right, mean ± SEM dF/F of pyramidal (dark shade) or interneurons (light) that show positive (orange) or negative (blue) values. Stats, repeated-measures ANOVA. Bottom, kernel-smoothed distributions of mean latencies of activation or suppression relative to vocalization onset for individual pyramidal neurons (top) or interneurons (bottom). Black line, group mean. Stats, ANOVA with Tukey-Kramer test. (F) dF/F aligned to onset of single vocal bouts and ordered by mean amplitude of three example neurons that show bouts with activation (left), suppression (right), or either activation or suppression (mixture, center). (G) Proportions of vocal bouts (−2 to +2 s from onset) during which significant activation (orange), suppression (blue), or no significant dF/F (gray) was detected in pyramidal (left) or interneurons (right). Right, distribution of difference between the number of activation and suppression episodes divided by the sum of episodes. −1, neuron only shows suppression during vocalization. +1, neuron only shows activation. Arrows, group means. (H) Top, spectrogram of a long-duration (~40 s) vocal bout. Bottom, fluorescence of vocalization-modulated neurons ordered by mean fluorescence during vocalization.
Figure 2.
Figure 2.. Behavioral correlates of vocalization
(A) Top to bottom, USVs, female distance (dashed line, threshold of interaction), speed, pupil size, and face movement of the male mouse during a social interaction. (B) Left, schematics showing position of male and female mice and direction of airflow in each condition. Right, vocalization probability (black line) and female position (blue) aligned to female approach under neutral (top), negative (middle), or positive (bottom) airflow. Bottom right, proportion of experiments in which USVs were present while the female was in the proximal chamber under neural airflow (Prox), in the distal chamber with positive airflow (Dist, +), or absent (Abs). Stats, chi-squared test with Bonferroni correction. Asterisks, *p < 0.05; **p < 0.01; and ***p < 0.001. For all images, N = 13 mice, 116 sessions. (C) Mean ± SEM of speed, pupil size, and movement of the whisker pad, snout, or jaw aligned to vocalization onset (vertical dashed line). Horizontal line, baseline. (D) Mean ± SEM of measurements in (C) and USV probability aligned to when the female enters the approach corridor (Interaction onset, vertical line) that did (colored) or did not (black) coincide with USVs.
Figure 3.
Figure 3.. Dissociating vocal modulation from locomotor and odor modulation
(A) Schematics of conditions used to detect modulation in which vocalization (left), locomotion (center), or odor (right) modulation was coded as present or absent. (B) Top, proportion of pyramidal or interneurons that were significantly modulated by 0–3 sources. Bottom, proportions of pyramidal or interneurons that were activated, suppressed, or unmodulated by vocalization, locomotion, or female odor. N = 2,229 pyramidal neurons, 179 interneurons. (C) Mean dF/F of locomotion-modulated pyramidal (top) and interneurons (bottom) at locomotion onset sorted into groups with positive or negative values and ordered by absolute magnitude. (D) Left, mean dF/F of neurons that were activated (+) or suppressed (−) by locomotion at vocal onset. Same neurons and ordering as (D). Center, mean dF/F of vocalization-modulated neurons at locomotion onset. Same neurons and ordering as Figure 1E. Right, mean ± SEM dF/F of locomotion-modulated (top) or vocalization-modulated (bottom) pyramidal (dark shade) or interneurons (light) that show positive (green/orange) or negative values. Stats, repeated-measures ANOVA. *p < 0.05; **p < 0.01; and ***p < 0.001. (E) Vocalization, locomotion, and odor dF among pyramidal neurons (left) and interneurons (right) ordered by magnitude of vocal dF. (F) Pairwise comparisons and Pearson correlations of differences between mean fluorescence during present and absent epochs (dF) for vocalization, locomotion, and odor. Colored markers, neurons significantly modulated by only vocalization (orange), locomotion (green), or odor (blue). Black markers, modulated by both factors. Black line, linear fit of black markers. Yellow box, neurons activated by vocalization and suppressed by odor. Unmodulated neurons are not plotted but are included in the correlation calculation.
Figure 4.
Figure 4.. Vocal and non-vocal modulation of auditory cortical neurons in deaf mice
(A) Mean auditory brainstem responses to a brief click stimulus (1 ms) collected from a hearing (Tmc1+/Δ, black) and a deaf (Tmc1Δ/Δ, pink) mouse. (B) Left, projections of the uniform manifold approximation of latent values that represent the spectral features of USV syllables (N = 12,780) generated by hearing (black) or deaf (pink) mice. Right, similarity matrix between pairs of syllable repertoires of individual hearing or deaf mice, as captured by the maximum mean discrepancy. (C) Same as Figure 3B but for neurons from deaf mice. See also Figure S5B. (D) Same as Figure 1E but for neurons from deaf mice. Stats, repeated-measures ANOVA (mean dF/F) and ANOVA with Tukey-Kramer test (latency). *p < 0.05; **p < 0.01; and ***p < 0.001. (E) Distribution of the mean dF/F magnitude and mean latencies of episodes of activation or suppression of auditory cortical neurons relative to vocal onset among auditory cortical neurons from hearing (gray) or deaf (blue) mice that were activated or suppressed by vocalization. Black line, group mean. Stats, ANOVA with Tukey-Kramer test. N, hearing = 2,083 pyramidal neurons, 201 interneurons, 4,858 episodes; deaf = 874 pyramidal, 74 interneurons, and 2,376 episodes. (F and G) Same as Figures 1G and 1H but for neurons from deaf mice. Magenta arrows, means of deaf group. Blue arrows, means of pyramidal (dark) and interneurons (light) from hearing mice. Stats, ANOVA with Tukey-Kramer test. (H) Mean dF/F of locomotion-modulated pyramidal (top) and interneurons (bottom) from deaf mice at locomotion onset sorted into those with positive or negative values and ordered by absolute magnitude. Right top, mean ± SEM dF/F of pyramidal (dark shade) or interneurons (light) with positive (green) or negative (blue) values. Right bottom, distribution of mean latencies after kernel density smoothing of activation or suppression relative to locomotion onset for individual pyramidal neurons (top) or interneurons (bottom). Black line, group mean. Stats, repeated-measures ANOVA (mean dF/F) and ANOVA with Tukey-Kramer test (latency). See also Figure S4. (I) Same as (E) but among locomotion-modulated neurons, relative to locomotion onset. Stats, ANOVA with Tukey-Kramer test. N, hearing = 856 pyramidal neurons, 109 interneurons, 1,818 episodes; deaf = 934 pyramidal, 192 interneurons, and 2,129 episodes. (J and K) Same as Figures 3F and 3G but for neurons from deaf mice. Stats, pairwise Pearson correlations.
Figure 5.
Figure 5.. Vocal modulation scales with band power in the auditory cortex of hearing and deaf mice
(A) Spectrograms of the first 2 s of vocal bouts from the same mouse with mean band power values in the low third (“low,” top), middle third (“mid,” center), or high third (“high,” top) of all recordings in the dataset. (B) Top, relationship between sound frequency and intensity for the spectrograms in (A). Bottom, distributions of mean frequency (left), sound intensity (middle), and entropy (right) of 1 s vocal block with low, mid, or high band powers. Stats, one-way ANOVA. *p < 0.05; **p < 0.01; and ***p < 0.001. N = 152,961 blocks. (C) Left, mean dF/F of individual vocalization-modulated neurons that showed significant scaling to band power aligned to low, mid, or high band power vocal bouts sorted by whether the dF/F increases (direct) or decreases (inverse) with increasing band power and ordered by magnitude during high-band-power bouts. Vertical dashed line, vocal onset. Right, mean ± SEM dF/F aligned to onset of low-, mid-, or high-band-power bouts among neurons that show direct (orange, top) or inverse (blue, bottom) band power scaling. (D) Same as (C) but for neurons from deaf mice. (E) Proportions of pyramidal and interneurons that show significant direct or inverse scaling, or no significant scaling, in hearing (orange, throughout) and deaf (magenta, throughout) mice. (F) Distribution of mean trial-based correlations, calculated between the single vocal bout dF/F and the mean dF/F, among pyramidal (left) and interneurons (right) from hearing and deaf mice. Stats, ANOVA with Tukey-Kramer test. (G) Group mean ± SEM dF/F for vocal bouts with episodes of significant activation (top) or suppression (bottom) among pyramidal neurons (left) or interneurons (right) from hearing and deaf mice. Stats, repeated-measures ANOVA with Tukey-Kramer test.

References

    1. Müller-Preuss P, and Ploog D (1981). Inhibition of auditory cortical neurons during phonation. Brain Res. 215, 61–76. 10.1016/0006-8993(81)90491-1. - DOI - PubMed
    1. Paus T, Perry DW, Zatorre RJ, Worsley KJ, and Evans AC (1996). Modulation of cerebral blood flow in the human auditory cortex during speech: role of motor-to-sensory discharges. Eur. J. Neurosci 8, 2236– 2246. 10.1111/j.1460-9568.1996.tb01187.x. - DOI - PubMed
    1. Numminen J, and Curio G (1999). Differential effects of overt, covert and replayed speech on vowel-evoked responses of the human auditory cortex. Neurosci. Lett 272, 29–32. 10.1016/s0304-3940(99)00573-x. - DOI - PubMed
    1. Curio G, Neuloh G, Numminen J, Jousmä ki V, and Hari R. (2000). Speaking modifies voice-evoked activity in the human auditory cortex. Hum. Brain Mapp. 9, 183–191. 10.1002/(sici)1097-0193(200004)9:4&lt;183::aid-hbm1&gt;3.0.co;2-z. - DOI - PMC - PubMed
    1. Houde JF, Nagarajan SS, Sekihara K, and Merzenich MM (2002). Modulation of the auditory cortex during speech: an MEG study. J. Cognit. Neurosci 14, 1125–1138. 10.1162/089892902760807140. - DOI - PubMed

Publication types

LinkOut - more resources