. 2024 Aug 27;43(8):114587.
doi: 10.1016/j.celrep.2024.114587. Epub 2024 Aug 7.

A molecular pathway for cancer cachexia-induced muscle atrophy revealed at single-nucleus resolution

Affiliations

A molecular pathway for cancer cachexia-induced muscle atrophy revealed at single-nucleus resolution

Yichi Zhang et al. Cell Rep. .

Abstract

Cancer cachexia is a prevalent and often fatal wasting condition that cannot be fully reversed with nutritional interventions. Muscle atrophy is a central component of the syndrome, but the mechanisms whereby cancer leads to skeletal muscle atrophy are not well understood. We performed single-nucleus multi-omics on skeletal muscles from a mouse model of cancer cachexia and profiled the molecular changes in cachexic muscle. Our results revealed the activation of a denervation-dependent gene program that upregulates the transcription factor myogenin. Further studies showed that a myogenin-myostatin pathway promotes muscle atrophy in response to cancer cachexia. Short hairpin RNA inhibition of myogenin or inhibition of myostatin through overexpression of its endogenous inhibitor follistatin prevented cancer cachexia-induced muscle atrophy in mice. Our findings uncover a molecular basis of muscle atrophy associated with cancer cachexia and highlight potential therapeutic targets for this disorder.

Keywords: AAV; CP: Cancer; CP: Metabolism; atrophy; cachexia; denervation; myogenin; myostatin; single nucleus ATAC-seq; single nucleus RNA-seq; single nucleus multiome.


Conflict of interest statement

Declaration of interests The authors declare no competing interests.

Figures

Figure 1.
Figure 1.. KIC mice serve as a PDAC model and develop cachexia
(A) Survival curve of KrasLSLG12D/+;Ink4afl/fl;Ptf1aCre/+ (KIC) mice. Early pancreatic ductal adenocarcinoma (PDAC) at 40–55 days (purple), mid PDAC at 55–65 days (green), and late PDAC at 66–82 days (blue). n = 12 KIC mice. (B) H&E staining of early PDAC (40–55 days of age) and late PDAC (66–82 days of age) tumors from KIC mice. Scale bar, 100 μm. (C) Tumor-free animal weights of control (blue) and KIC (red) mice, where the tumor weights were subtracted from the animal weights of KIC mice during late PDAC (66–80 days of age). n = 5 control and KIC mice. (D) Gross morphology of control (left) and KIC (right) hindlimb muscles during late PDAC (66 days). (E) Muscle weight to tibia length ratios for the indicated muscles in male (left) and female (right) control (blue) and KIC (red) mice during late PDAC. TA, tibialis anterior; Quad, quadriceps; GP, gastrocnemius and plantaris muscles; MW/TL, muscle weight (mg)/tibia length (mm). n = 3–10 male or female control or KIC mice. (F) Hindlimb grip strength measurements of control (blue) and KIC (red) mice during late PDAC (66–82 days). n = 5 mice per condition. (G) Wheat germ agglutinin (WGA) staining (green) of control (top) and KIC (bottom) TA, Quad, and GP muscles during late PDAC (66–80 days of age). Scale bar, 100 μm. (H) Average myofiber areas of control (blue) and KIC (red) TA, Quad, and GP muscles during late PDAC. n = 4 mice per condition. (I) mRNA expression of Trim63 and Fbxo32 in control (blue) and KIC (red) GP muscles during late PDAC. n = 4–5 mice per condition. Female mice were analyzed unless otherwise stated. Statistical comparisons in (C), (E), (F), (H), and (I) were evaluated by unpaired two-tailed Student’s t test. *p < 0.05, **p < 0.01, ***p < 0.001, ****p < 0.0001. Data represent mean ± SEM.
Figure 2.
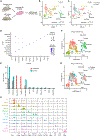
Figure 2.. Multi-omics single-nucleus analysis of mouse cancer cachexia-induced muscle atrophy
(A) Experimental design of snRNA-seq and snATAC-seq analysis of control and KIC GP muscles during late PDAC from female mice. All nuclei were isolated from GP muscles, FAC sorted, encapsulated in oil droplets, and sequenced. Unsupervised clustering was then performed to identify cellular identities. (B) UMAP visualization of nuclear transcriptomes of control and KIC GP muscles during late PDAC by snRNA-seq (8,192 nuclei), colored by cluster identity. UMAP, uniform manifold approximation and projection for dimension reduction; MTJ, myotendinous junction; EC, endothelial cells; MuSC, muscle satellite cells; IIX, type IIX myonuclei; IIA, type IIA myonuclei; IIB, type IIB myonuclei; I, type I myonuclei; Immune, immune cells. (C) UMAP visualization of control (3,293 nuclei) (blue) and KIC (4,899 nuclei) (red) nuclear transcriptomes by snRNA-seq. (D) Dot plot from snRNA-seq showing the expression of top markers for each cluster from combined control and KIC nuclear transcriptomes. Darker-colored dots indicate higher expression, and larger dots indicate a higher percentage of nuclei expressing the gene of interest in each population. (E) Distribution plot showing the percentage of nuclei corresponding to the indicated populations in control (blue) and cachexia (red) samples. (F) UMAP plots of single-nucleus ATAC-seq (snATAC-seq) profiling chromatin accessibility in control and KIC GP muscles (8,192 nuclei). MTJ, myotendinous junction; EC, endothelial cells; MuSC, muscle satellite cells; IIX, type IIX myonuclei; IIA, type IIA myonuclei; IIB, type IIB myonuclei; I, type I myonuclei; Immune, immune cells. (G) UMAP plots of single-nucleus ATAC-seq (snATAC-seq) profiling chromatin accessibility in control (3,293 nuclei) (blue) and KIC (4,899 nuclei) (red) GP muscles separated by condition. (H) snATAC-seq tracks of open chromatin peaks that are associated with cell-type-specific genes across different cell clusters, including Ckm (IIB and IIX/IIA/I marker), Chrng (denervated marker), Tmem140 (catabolic marker), Pdgfra (fibroblast marker), Cd163 (immune cell marker), Col22a1 (MTJ marker), Col11a1 (tenotype marker), Rgs5 (pericyte marker), Flit1 (EC marker), Pax7 (MuSC marker), and Cidec (adipocyte marker). Female mice were used for all analyses.
Figure 3.
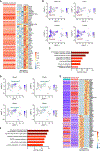
Figure 3.. Single-nucleus RNA-seq identifies two cachexia-specific gene programs in KIC muscle
(A) Heatmaps showing the expression of the top upregulated genes by bulk RNA-seq performed on GP muscles of 48-h fasting or control mice (Ink4afl/fl) that induced muscle atrophy (right). These differentially expressed genes were highly expressed in the catabolic cluster of myonuclei from our snRNA-seq dataset (left). Color indicates Z score. (B) UMAP visualization of the gene expression for Tmem140, Phaf1, Fbxo32, and Trim63, which are enriched in the catabolic cluster from combined control and KIC nuclear transcriptomes. Catabolic cluster is encircled in red. (C) Gene ontology (GO) pathway analysis of the upregulated genes enriched in the catabolic cluster relative to other clusters. (D) UMAP visualization of the gene expression of Ncam1, Chrng, Runx1, and Myog, which are enriched in the denervated cluster from combined control and KIC nuclear transcriptomes. Denervated cluster is encircled in green. (E) Heatmaps showing the differentially expressed genes enriched in a publicly available bulk RNA-seq dataset (accession BioProject: PRJNA541778) comparing 7-day denervated mouse GP muscle to control muscle (right). The expression of these genes in control IIB and denervated clusters from the snRNA-seq dataset are shown (left). Color indicates Z score. The denervated cluster label is highlighted in red. (F) Gene ontology (GO) pathway analysis of the upregulated genes enriched in the denervated cluster relative to other clusters. Female mice were used for all analyses.
Figure 4.
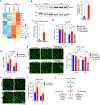
Figure 4.. Myogenin contributes to cancer cachexia-induced muscle atrophy
(A) snATAC-seq UMAP plots showing the enrichment of MYOG motifs in nuclei within the denervated cluster. Increased intensity of the red color reflects the level of MYOG motif enrichment in accessible genes in the nuclei. Green lines enclose denervated myonuclei. (B) Western blot analysis (left) showing induction of MYOG protein levels in GP muscles from KIC and control mice during late PDAC. Vinculin (VCL) protein was used as the loading control. Densitometry analysis of the western blots is shown on the right. n = 3 mice per condition. (C) mRNA expression of MYOG in human healthy control (blue) and cachexia (red) rectus abdominis (RA) muscle biopsies. n = 4 patients per group. (D) Experimental design for AAV9-mediated knockdown of Myog in TA muscles from adult control or KIC mice. Seven-week-old control or KIC mice were injected with 1 × 10¹¹ viral genomes (vg)/leg of AAV9-shMyog into the left TA muscle, and the TA from the right leg was used as the uninjected control. When KIC mice became cachexic during late PDAC (3–4 weeks post AAV9 injection), muscles were collected. (E) Quantification of TA (left) and GP (right) muscle weights of uninjected (blue) and AAV9-shMyog-injected (red) muscles in control and KIC mice at late PDAC. n = 3–5 mice per group. (F) WGA staining (green) and DAPI nuclear staining (white) of uninjected TA muscles and AAV9-shMyog-injected TA muscles in control and KIC mice at late PDAC. Combined WGA and DAPI staining is shown on top, and WGA staining alone is shown on the bottom. Scale bar, 50 μm. (G) Quantification of average myofiber area from WGA-stained TA (top) and GP (bottom) sections of uninjected (blue) and AAV9-shMyog-injected (red) muscles in control and KIC mice at late PDAC. n = 3–6 mice per group. (H) Immunostaining of bungarotoxin (BTX) (red) for acetylcholine receptors (AchRs) and SYNTAXIN-1 (green) for peripheral nerves in isolated myofibers of control uninjected, control AAV9-shMyog-injected, KIC uninjected, and KIC AAV9-shMyog-injected TA muscles. Scale bar, 10 μm. (I) Quantification of denervated NMJs showing loss of SYNTAXIN-1 staining on AchRs from staining in (H). n = 3 TA muscles from separate mice per condition. Female mice and humans were analyzed. Statistical comparisons between groups were evaluated in (B) and (C) by unpaired two-tailed Student’s t test. One-way ANOVA followed by Tukey’s multiple comparisons test was performed in (E), (G), and (I) to determine statistical significance. ns, not significant; *p < 0.05, **p < 0.01, ****p < 0.0001. Data represent mean ± SEM.
Figure 5.
Figure 5.. Intramuscular injection of AAV9-MSTN promotes muscle atrophy and AAV9-Fst288 rescues muscle atrophy by inhibiting MSTN in KIC mice
(A) Heatmaps of six significantly upregulated and six significantly downregulated genes following AAV9-shMyog injection in KIC TA muscle compared to uninjected KIC TA. Expression of these genes in control AAV9-shMyog and uninjected TA muscles is shown for reference. Colors indicate Z score. (B) Western blot analysis of myostatin (MSTN) and VCL loading control in control and KIC GP muscles (left). Densitometry analysis of the relative expression of MSTN/VCL between control (blue) and KIC (red) (right). n = 3 mice per group. (C) mRNA expression of MSTN in human healthy control (blue) and cachexia (red) rectus abdominis (RA) muscle biopsies. n = 4 patients per group. (D) Quantification of TA muscle weights of uninjected (blue), AAV9-shMyog-injected (red), and AAV9-shMyog with AAV9-MSTN-injected (gray) muscles in control and KIC mice at late PDAC. n = 3 mice per group. (E) WGA staining (green) of uninjected TA muscles (left), AAV9-shMyog-injected TA muscles (middle), and AAV9-shMyog with AAV9-MSTN-injected TA muscles (right) from control and KIC mice at late PDAC. Scale bar, 100 μm. (F) Quantification of average myofiber area from WGA-stained TA sections of uninjected (blue) muscle and those injected with AAV9-shMyog (red) or AAV9-shMyog with AAV9-MSTN (gray) in control and KIC mice at late PDAC. n = 3 mice per group. (G) Quantification of TA muscle weights of uninjected (blue) and AAV9-Fst288-injected (red) muscles in control and KIC mice at late PDAC. n = 5 mice per group. (H) WGA staining of control and KIC uninjected (left) and AAV9-Fst288-injected (right) TA muscles at late PDAC. Scale bar, 100 μm. (I) Quantification of average myofiber area from WGA-stained TA sections from uninjected (blue) and AAV9-Fst288-injected (red) muscles in control and KIC mice at late PDAC. n = 5 mice per group. (J) Model showing that denervation occurs in cancer cachexic muscle, leading to activation of the myogenin-myostatin axis, which contributes to muscle atrophy in cancer cachexia. Inhibition of myostatin via follistatin rescues muscle atrophy in cancer cachexia. Female mice and humans were analyzed in (A) to (I). Statistical comparisons between groups in (B) and (C) were evaluated by unpaired two-tailed Student’s t test. One-way ANOVA followed by Tukey’s multiple comparisons test was performed in (D), (F), (G), and (I) to determine statistical significance. ns, not significant; *p < 0.05, **p < 0.01, ***p < 0.001, ****p < 0.0001. Data represent mean ± SEM.

References

    1. Fearon K, Strasser F, Anker SD, Bosaeus I, Bruera E, Fainsinger RL, Jatoi A, Loprinzi C, MacDonald N, Mantovani G, et al. (2011). Definition and classification of cancer cachexia: An international consensus. Lancet Oncol. 12, 489–495. 10.1016/S1470-2045(10)70218-7. - DOI - PubMed
    1. Evans WK, Makuch R, Clamon GH, Feld R, Weiner RS, Moran E, Blum R, Shepherd FA, Jeejeebhoy KN, and DeWys WD (1985). Limited impact of total parenteral nutrition on nutritional status during treatment for small cell lung cancer. Cancer Res. 45, 3347–3353. - PubMed
    1. Gannavarapu BS, Lau SKM, Carter K, Cannon NA, Gao A, Ahn C, Meyer JJ, Sher DJ, Jatoi A, Infante R, and Iyengar P (2018). Prevalence and Survival Impact of Pretreatment Cancer-Associated Weight Loss: A Tool for Guiding Early Palliative Care. J. Oncol. Pract. 14, e238–e250. 10.1200/JOP.2017.025221. - DOI - PMC - PubMed
    1. Argilés JM, Busquets S, Stemmler B, and López-Soriano FJ (2014). Cancer cachexia: Understanding the molecular basis. Nat. Rev. Cancer 14, 754–762. 10.1038/nrc3829. - DOI - PubMed
    1. Baracos VE, Martin L, Korc M, Guttridge DC, and Fearon KCH (2018). Cancer-associated cachexia. Nat. Rev. Dis. Prim. 4, 1–18. 10.1038/nrdp.2017.105. - DOI - PubMed

Publication types

MeSH terms