. 2024 Aug 21;146(33):23230-23239.
doi: 10.1021/jacs.4c05623. Epub 2024 Aug 8.

Discovery of Selective Inhibitors for the Lysosomal Parkinson's Disease Channel TMEM175

Affiliations

Discovery of Selective Inhibitors for the Lysosomal Parkinson's Disease Channel TMEM175

SeCheol Oh et al. J Am Chem Soc. .

Abstract

TMEM175 is a lysosomal potassium and proton channel that is associated with the development of Parkinson's disease. Advances in understanding the physiological roles of TMEM175 have been hampered by the absence of selective inhibitors, and studies involving genetic perturbations have yielded conflicting results. Here, we report the discovery and characterization of the first reported TMEM175-selective inhibitors, 2-phenylpyridin-4-ylamine (2-PPA), and AP-6. Cryo-EM structures of human TMEM175 bound by 2-PPA and AP-6 reveal that they act as pore blockers, binding at distinct sites in the pore and occluding the ion permeation pathway. Acute inhibition of TMEM175 by 2-PPA or AP-6 increases the level of lysosomal macromolecule catabolism, thereby accelerating macropinocytosis and other digestive processes. These inhibitors may serve as valuable tools to study the roles of TMEM175 in regulating lysosomal function and provide useful templates for future therapeutic development in Parkinson's disease.


Figures

Figure 1:
Figure 1:. 4-aminopyridine is the key for TMEM175 inhibition.
(A) Schematic of the fluorescence-based liposome flux assay (LFA). Addition of the proton ionophore CCCP enables K+ efflux through TMEM175-containing vesicles. Proton influx is monitored by quenching the fluorophore ACMA. (B) Chemical structures of tested compounds. 4-AP; 4-Aminopyridine, 3-AP; 3-Aminopyridine, 2-AP; 2-Aminopyridine, and 4-AMP; 4-(Aminomethyl)pyridine, 2-PPA; 2-phenylpyridin-4-ylamine, 4-APM; (4-amino-pyridin-3-yl)-methanol, and 2,4-DAPTA; 2,4-diamino-6-phenyl-1,3,5-triazine. (C to E) Representative traces depicting ACMA fluorescence quenching (left), and normalized ACMA fluorescence quenching at ~600 s (right, data are mean ± s.e.m.; one-way ANOVA with Fisher’s LSD test), in the presence of aminopyridines (B, n=4), isonicotinic acid and isonicotinamide (C, n=3) and 4-AP derivatives with added functional groups (D, n=3). Inverted filled and empty triangles indicate the addition of CCCP to initiate K+ flux and addition of K+ ionophore valinomycin to measure total flux capacity of the liposome, respectively. *P < 0.05, **P < 0.01, ***P < 0.001, ****P < 0.0001. NS, not significant. (F) Normalized dose-response curves of three independent experiments of LFA for 4-AP derivatives with added functional groups. All experiments were performed at least in triplicate and error bars represent SEM.
Figure 2:
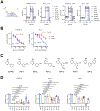
Figure 2:. 2-PPA and its derivatives selectively inhibit TMEM175.
(A) A schematic of whole-cell patch clamp and representative whole-cell recordings of TMEM175-transfected and hKv3.1-transfected HEK293T in the presence of 4-AP and 2-PPA. For 2-PPA recordings, 1 mM 4-AP was added at the end of experiment for normalization. (B) Normalized dose-response curve of three independent experiments of whole-cell recordings in (A) using +80-mV and +40-mV pulse for hTMEM175 and hKv3.1, respectively. (C) Chemical structures of 2-PPA derivatives. (D) Comparison of relative potencies of 4-AP, 2-PPA and 2-PPA derivatives against hTMEM175, hKv3.1, and mKv1.1. Currents were normalized to a baseline of 1.0 in the bath solution and 0.0 in the presence of 1 mM 4-AP. Data are mean ± s.e.m.; one-way ANOVA with Fisher’s LSD test). All experiments were performed at least in triplicate. P-values are presented.
Figure 3:
Figure 3:. 2-PPA blocks the ion conduction pathway of TMEM175.
(A and B) Structure of TMEM175 in the presence of 2-PPA, shown as side and top views. Non-protein density is shown as an orange surface contoured at 5 σ. (C and D) TMEM175 ion conduction pathway. Side chains for S45, I46 and I271 are shown in sticks. Non-protein density is shown as an orange mesh contoured at 5 σ. TM7 and TM1 are removed for clarity in (C) and (D), respectively. (E) Schematic of 2-PPA interactions with hTMEM175 residues. The figure was generated by LigPlot+.
Figure 4:
Figure 4:. AP-6 blocks the luminal entrance to the ion conduction pathway.
(A and B) Structure of TMEM175 in the presence of AP-6, shown as side and bottom views. Non-protein densities are shown as orange surfaces contoured at 7 σ. (C and D) TMEM175 ion conduction pathway. Side chains for S45, I46 and I271 are shown in sticks. Non-protein density is shown as an orange mesh contoured at 7 σ. TM7 and TM1 are removed for clarity in (C) and (D), respectively. (E) Schematic of AP-6 interactions with hTMEM175 residues. The figure was generated by LigPlot+.
Figure 5:
Figure 5:. Acute inhibition of TMEM175 increases lysosomal degradative activity.
(A) Schematic of macropinocytosis and lysosomal protein degradation assay using DQ-red-BSA. (B) Degradation of DQ-red-BSA in MEFs after 1 hr treatment with 400 nM torin 1, 50 nM bafilomycin A1, 300 μM 2-PPA, 20 μM AP-6 or 300 μM 4-AP. Scale bar: 20 μm. Area in green box in the left panel is shown in right panel. (C) Quantification of degradation of DQ-red-BSA in cells treated as in (B); n = 5 and n = 3 biologically independent experiments for scrambled and TMEM175 KO MEFs, respectively. (D) Quantification of DQ-red-BSA degradation in scramble or TMEM175 KO MEFs; n = 5 biologically independent experiments. (E) Confocal microscope images of TMR-dextran in MEF after 1 hr treatment with 400 nM torin1, 50 nM bafilomycin A1, 300 μM 2-PPA, 20 μM AP-6 or 300 μM 4-AP. (F) Quantification of TMR-dextran fluorescence in (E); n = 3 biologically independent experiments. (G) Degradation of lysosome-accumulated DQ-red-BSA in MEF after 1 hr treatment with 300 μM 2-PPA or 20 μM AP-6 . (H) Quantification of dequenched DQ-red-BSA in cells treated as in (G); n = 3 biologically independent experiments. One-way ANOVA (Dunnett’s test) was used to calculate P values for comparison between groups. *P < 0.05, **P < 0.01, ***P < 0.001, ****P < 0.0001. NS, not significant.

References

    1. Cang C; Aranda K; Seo YJ; Gasnier B; Ren D TMEM175 Is an Organelle K(+) Channel Regulating Lysosomal Function. Cell 2015, 162 (5), 1101–1112. DOI: 10.1016/j.cell.2015.08.002. - DOI - PubMed
    1. Zheng W; Shen C; Wang LF; Rawson S; Xie WJ; Nist-Lund C; Wu J; Shen ZF; Xia SY; Holt JR; et al. pH regulates potassium conductance and drives a constitutive proton current in human TMEM175. Science Advances 2022, 8 (12). DOI: ARTN eabm1568 10.1126/sciadv.abm1568. - DOI - PMC - PubMed
    1. Hu M; Li P; Wang C; Feng X; Geng Q; Chen W; Marthi M; Zhang W; Gao C; Reid W; et al. Parkinson's disease-risk protein TMEM175 is a proton-activated proton channel in lysosomes. Cell 2022, 185 (13), 2292–2308 e2220. DOI: 10.1016/j.cell.2022.05.021. - DOI - PMC - PubMed
    1. Wie J; Liu Z; Song H; Tropea TF; Yang L; Wang H; Liang Y; Cang C; Aranda K; Lohmann J; et al. A growth-factor-activated lysosomal K+ channel regulates Parkinson’s pathology. Nature 2021, 591 (7850), 431–437. DOI: 10.1038/s41586-021-03185-z. - DOI - PMC - PubMed
    1. Jinn S; Drolet RE; Cramer PE; Wong AH; Toolan DM; Gretzula CA; Voleti B; Vassileva G; Disa J; Tadin-Strapps M; et al. TMEM175 deficiency impairs lysosomal and mitochondrial function and increases alpha-synuclein aggregation. Proc Natl Acad Sci U S A 2017, 114 (9), 2389–2394. DOI: 10.1073/pnas.1616332114. - DOI - PMC - PubMed