. 2024 Aug 9;385(6709):eado7010.
doi: 10.1126/science.ado7010. Epub 2024 Aug 9.

Brain region-specific action of ketamine as a rapid antidepressant

Affiliations

Brain region-specific action of ketamine as a rapid antidepressant

Min Chen et al. Science. .

Abstract

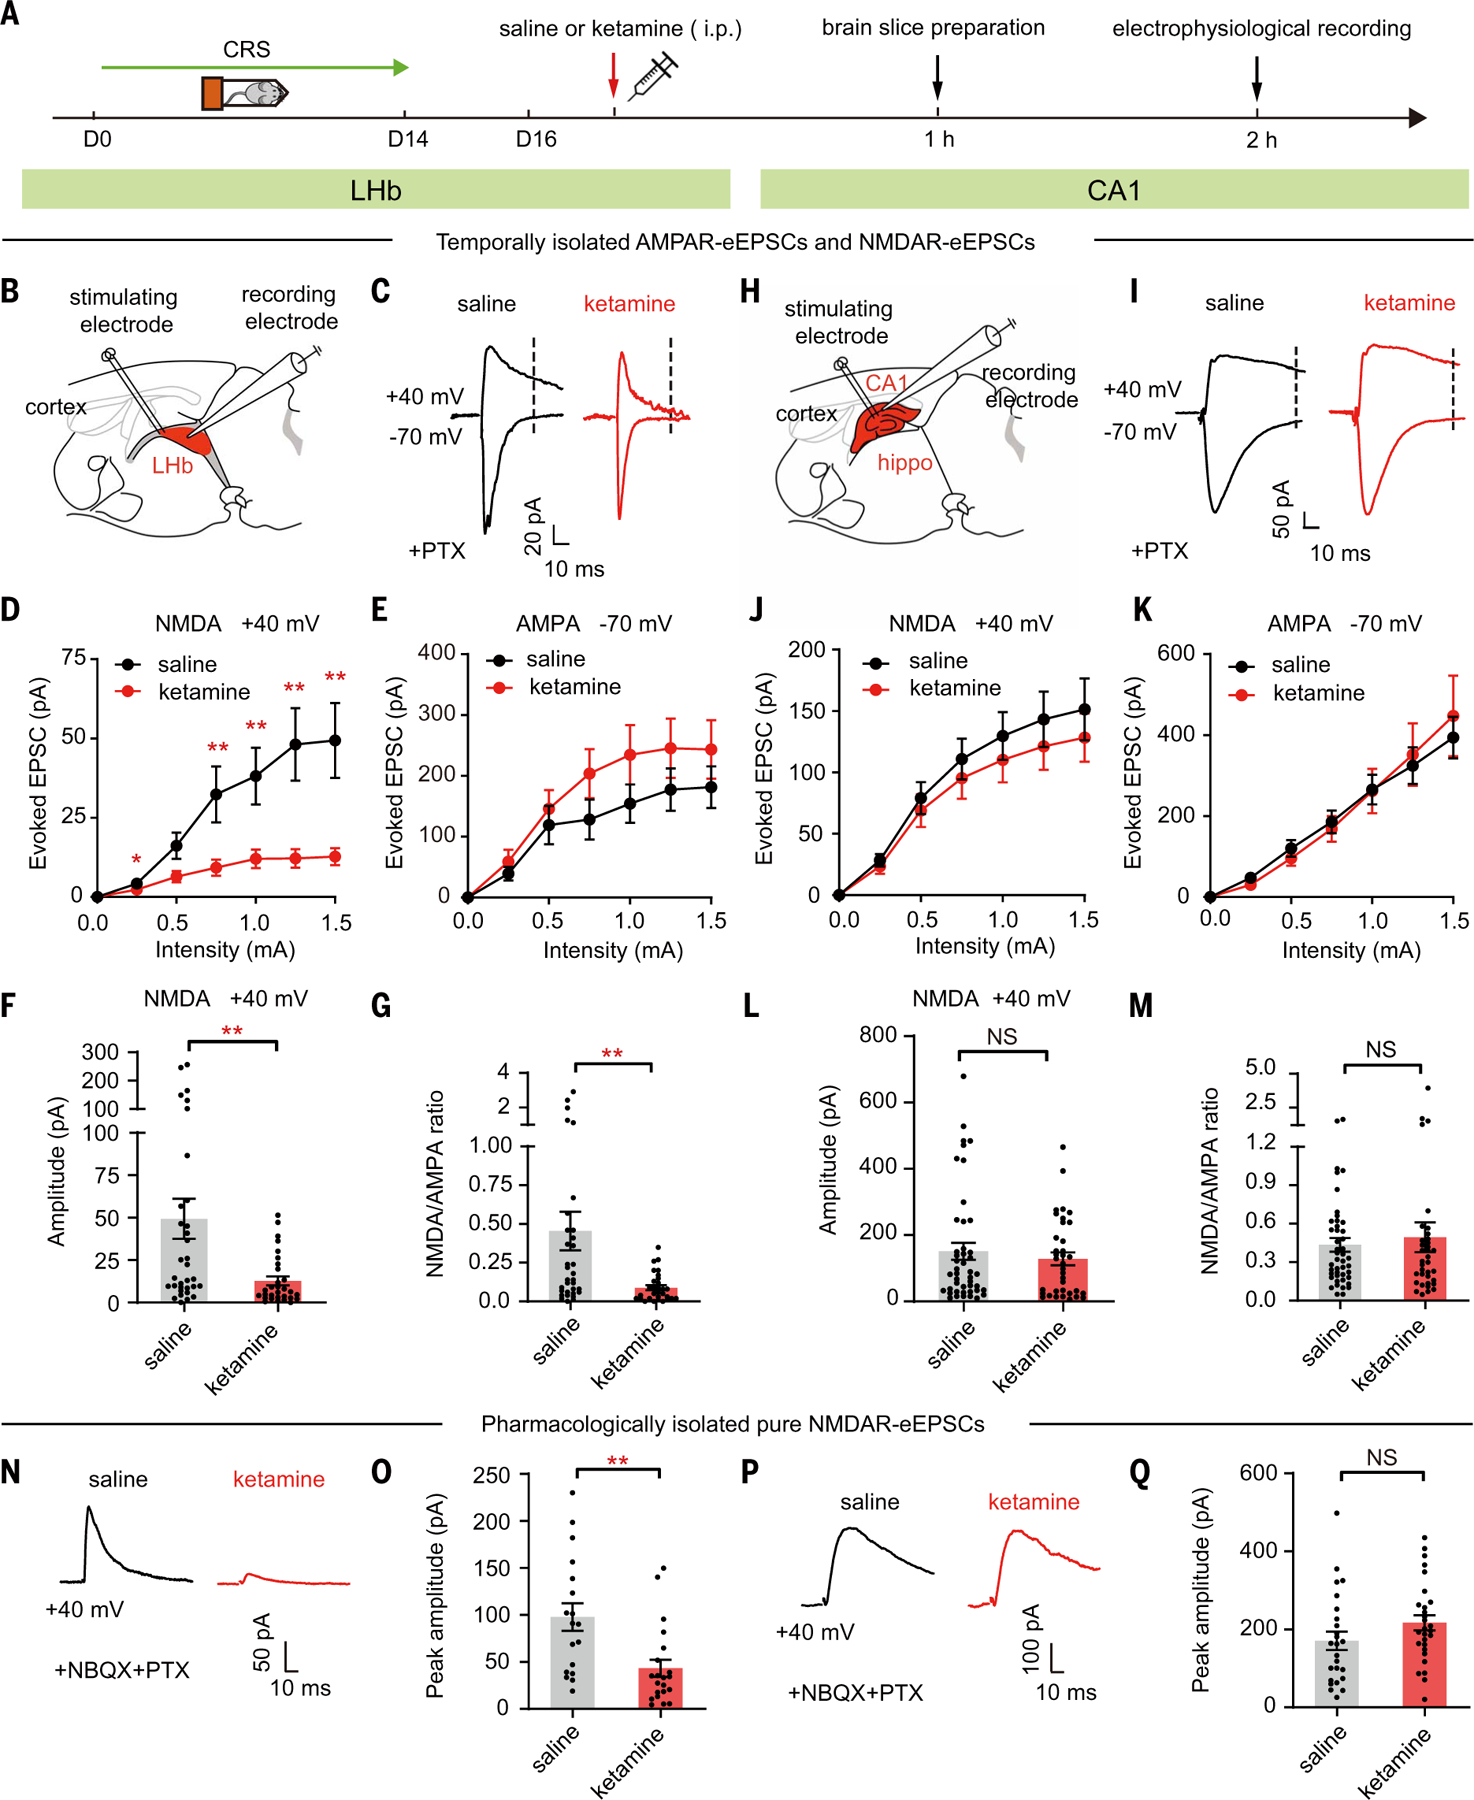
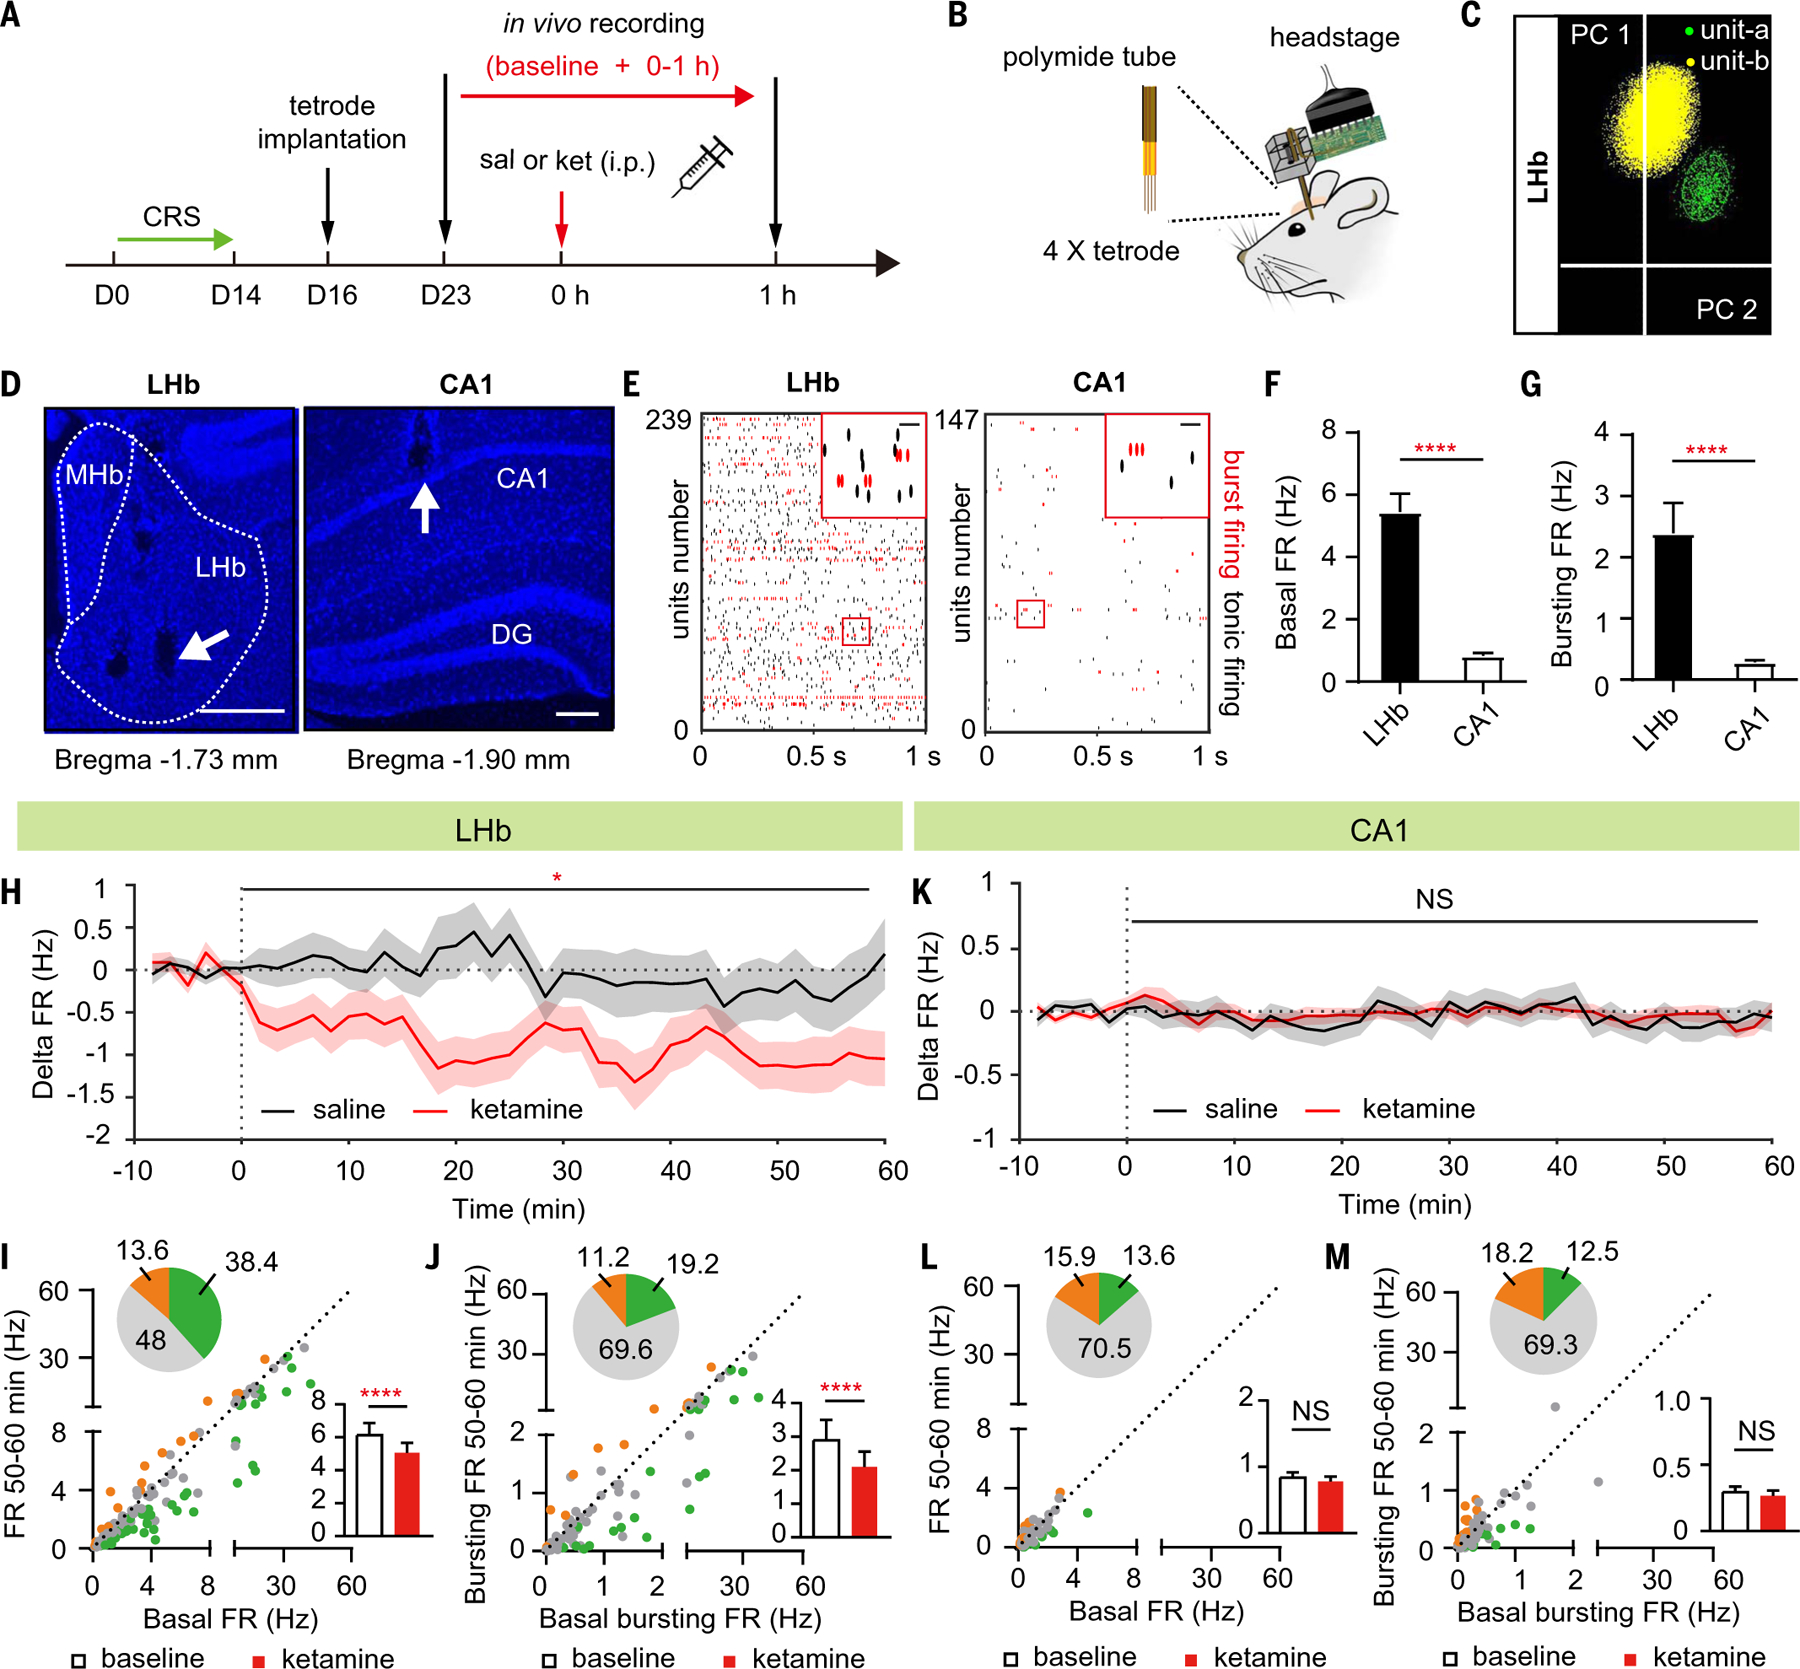
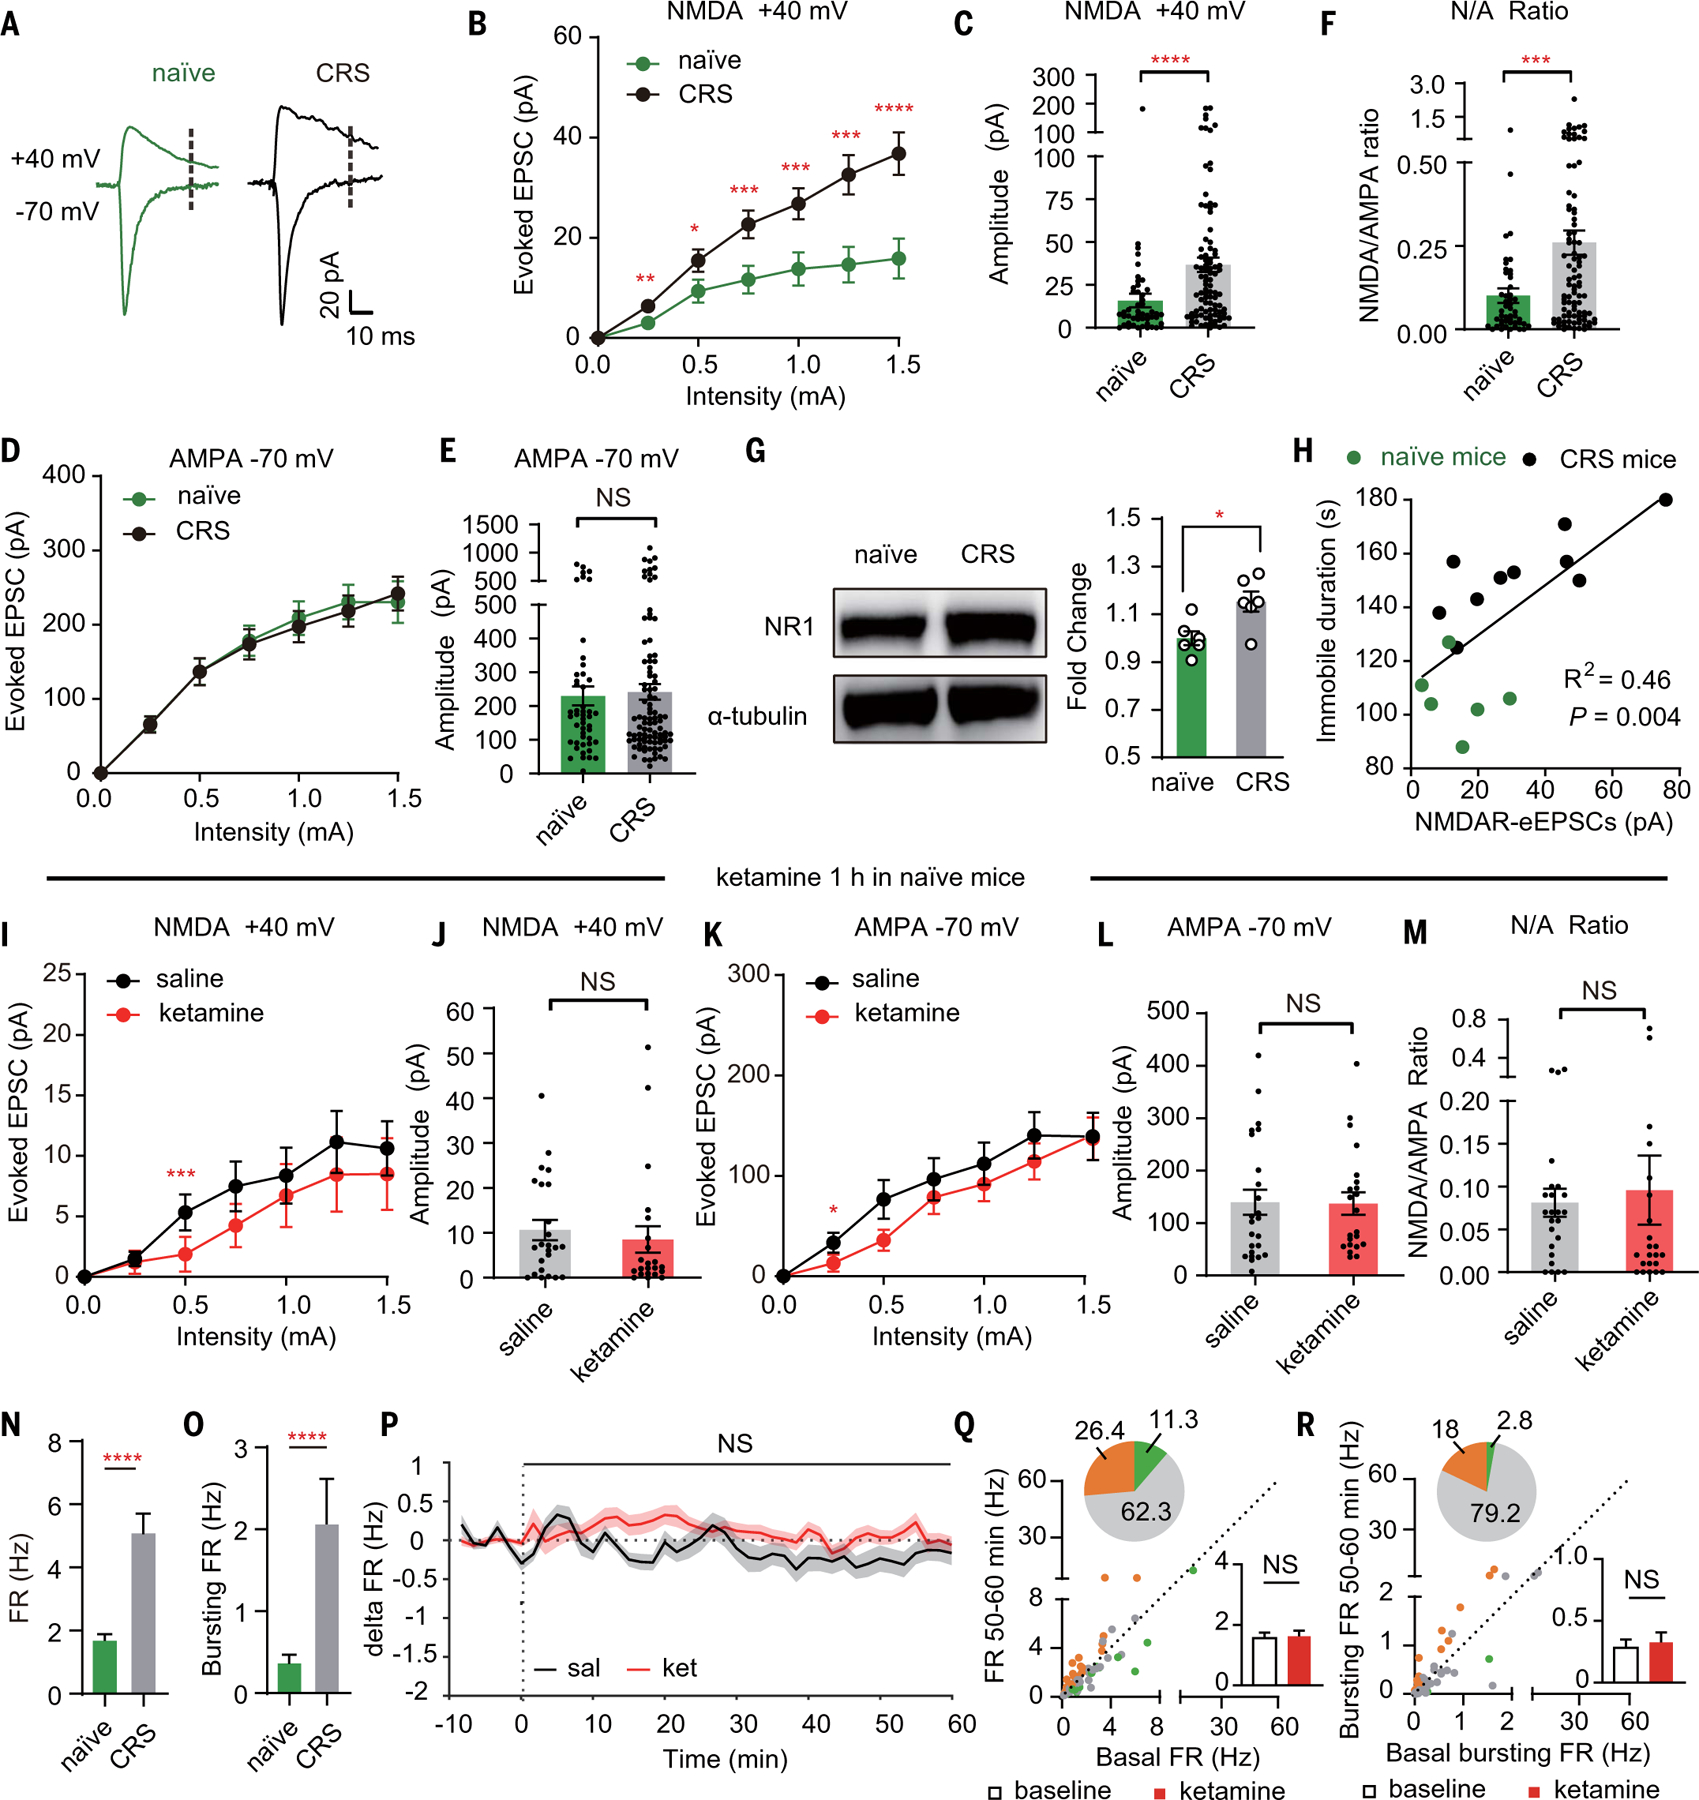
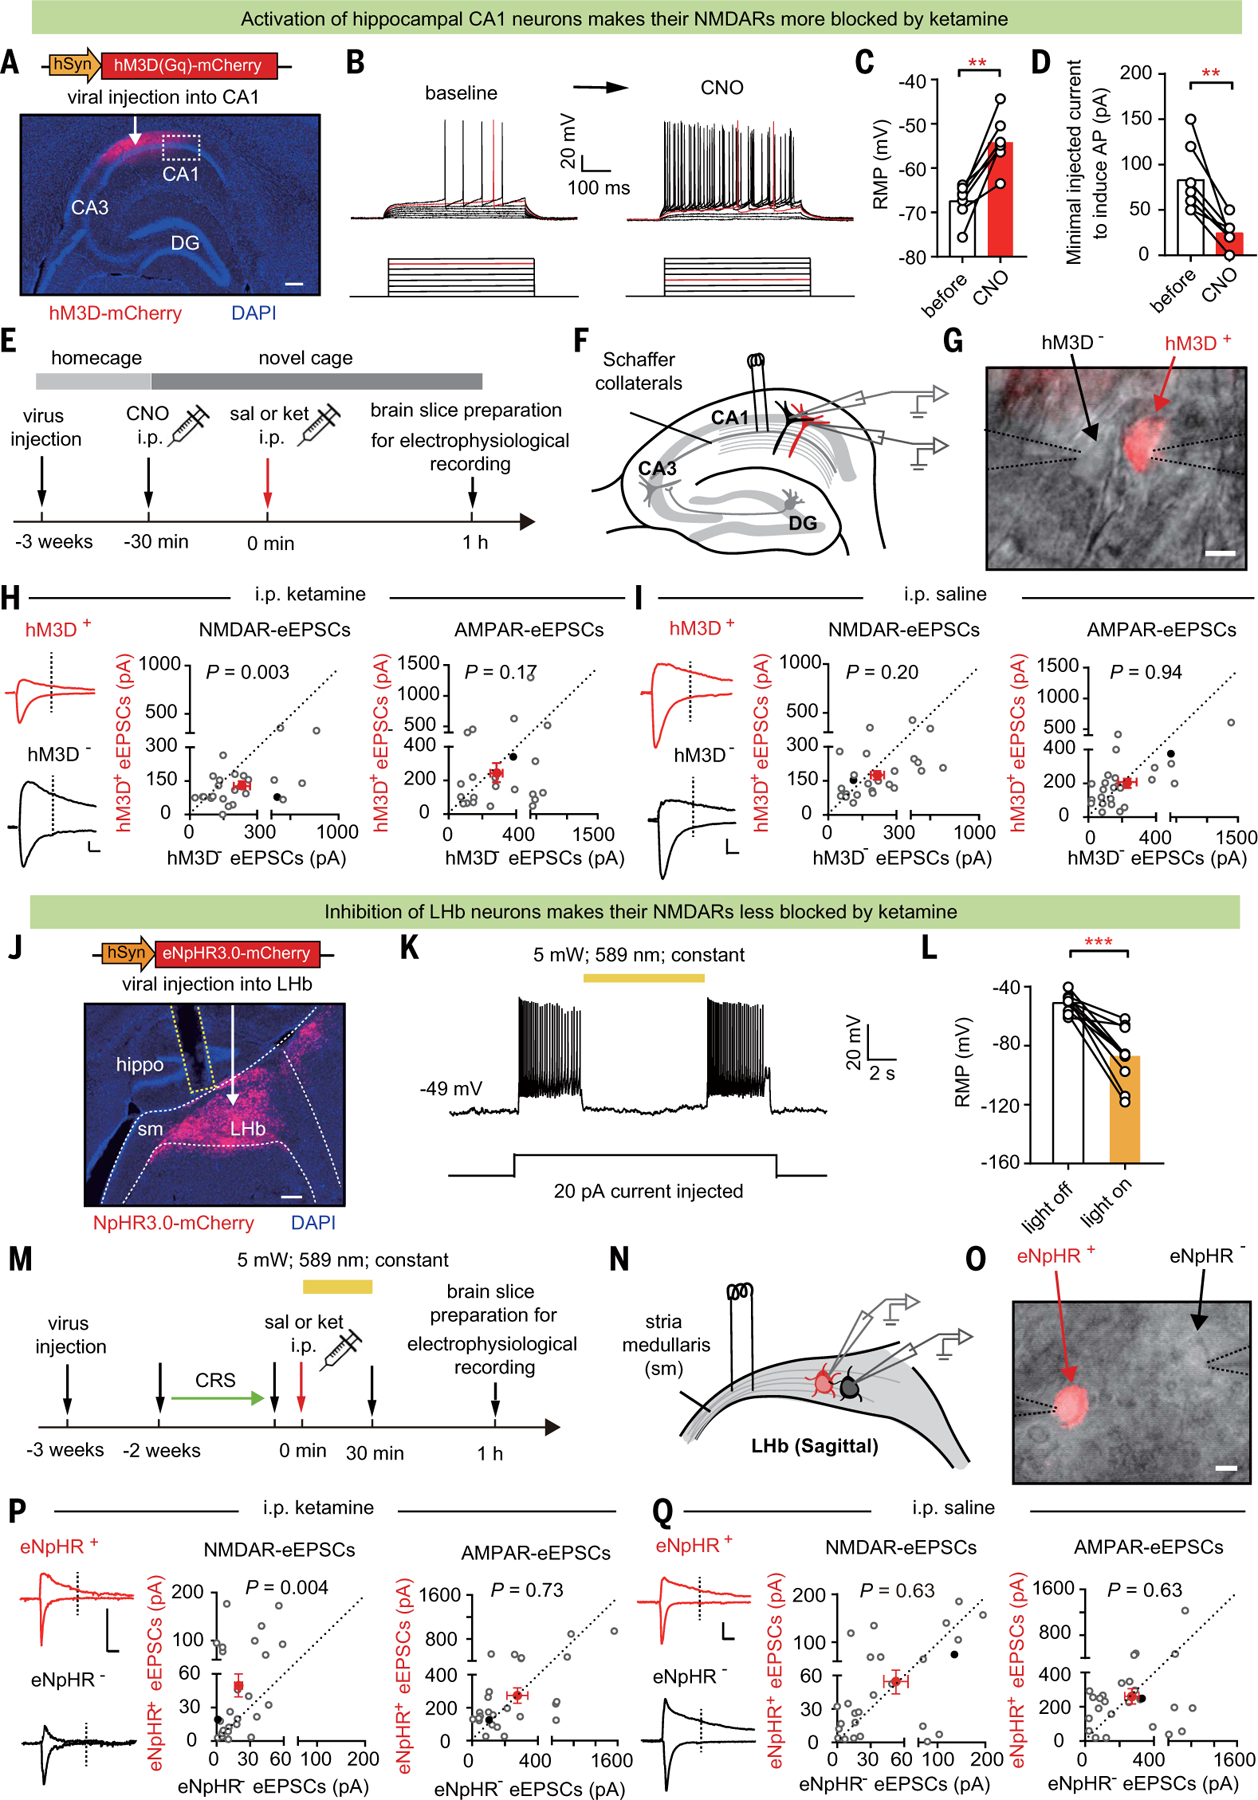
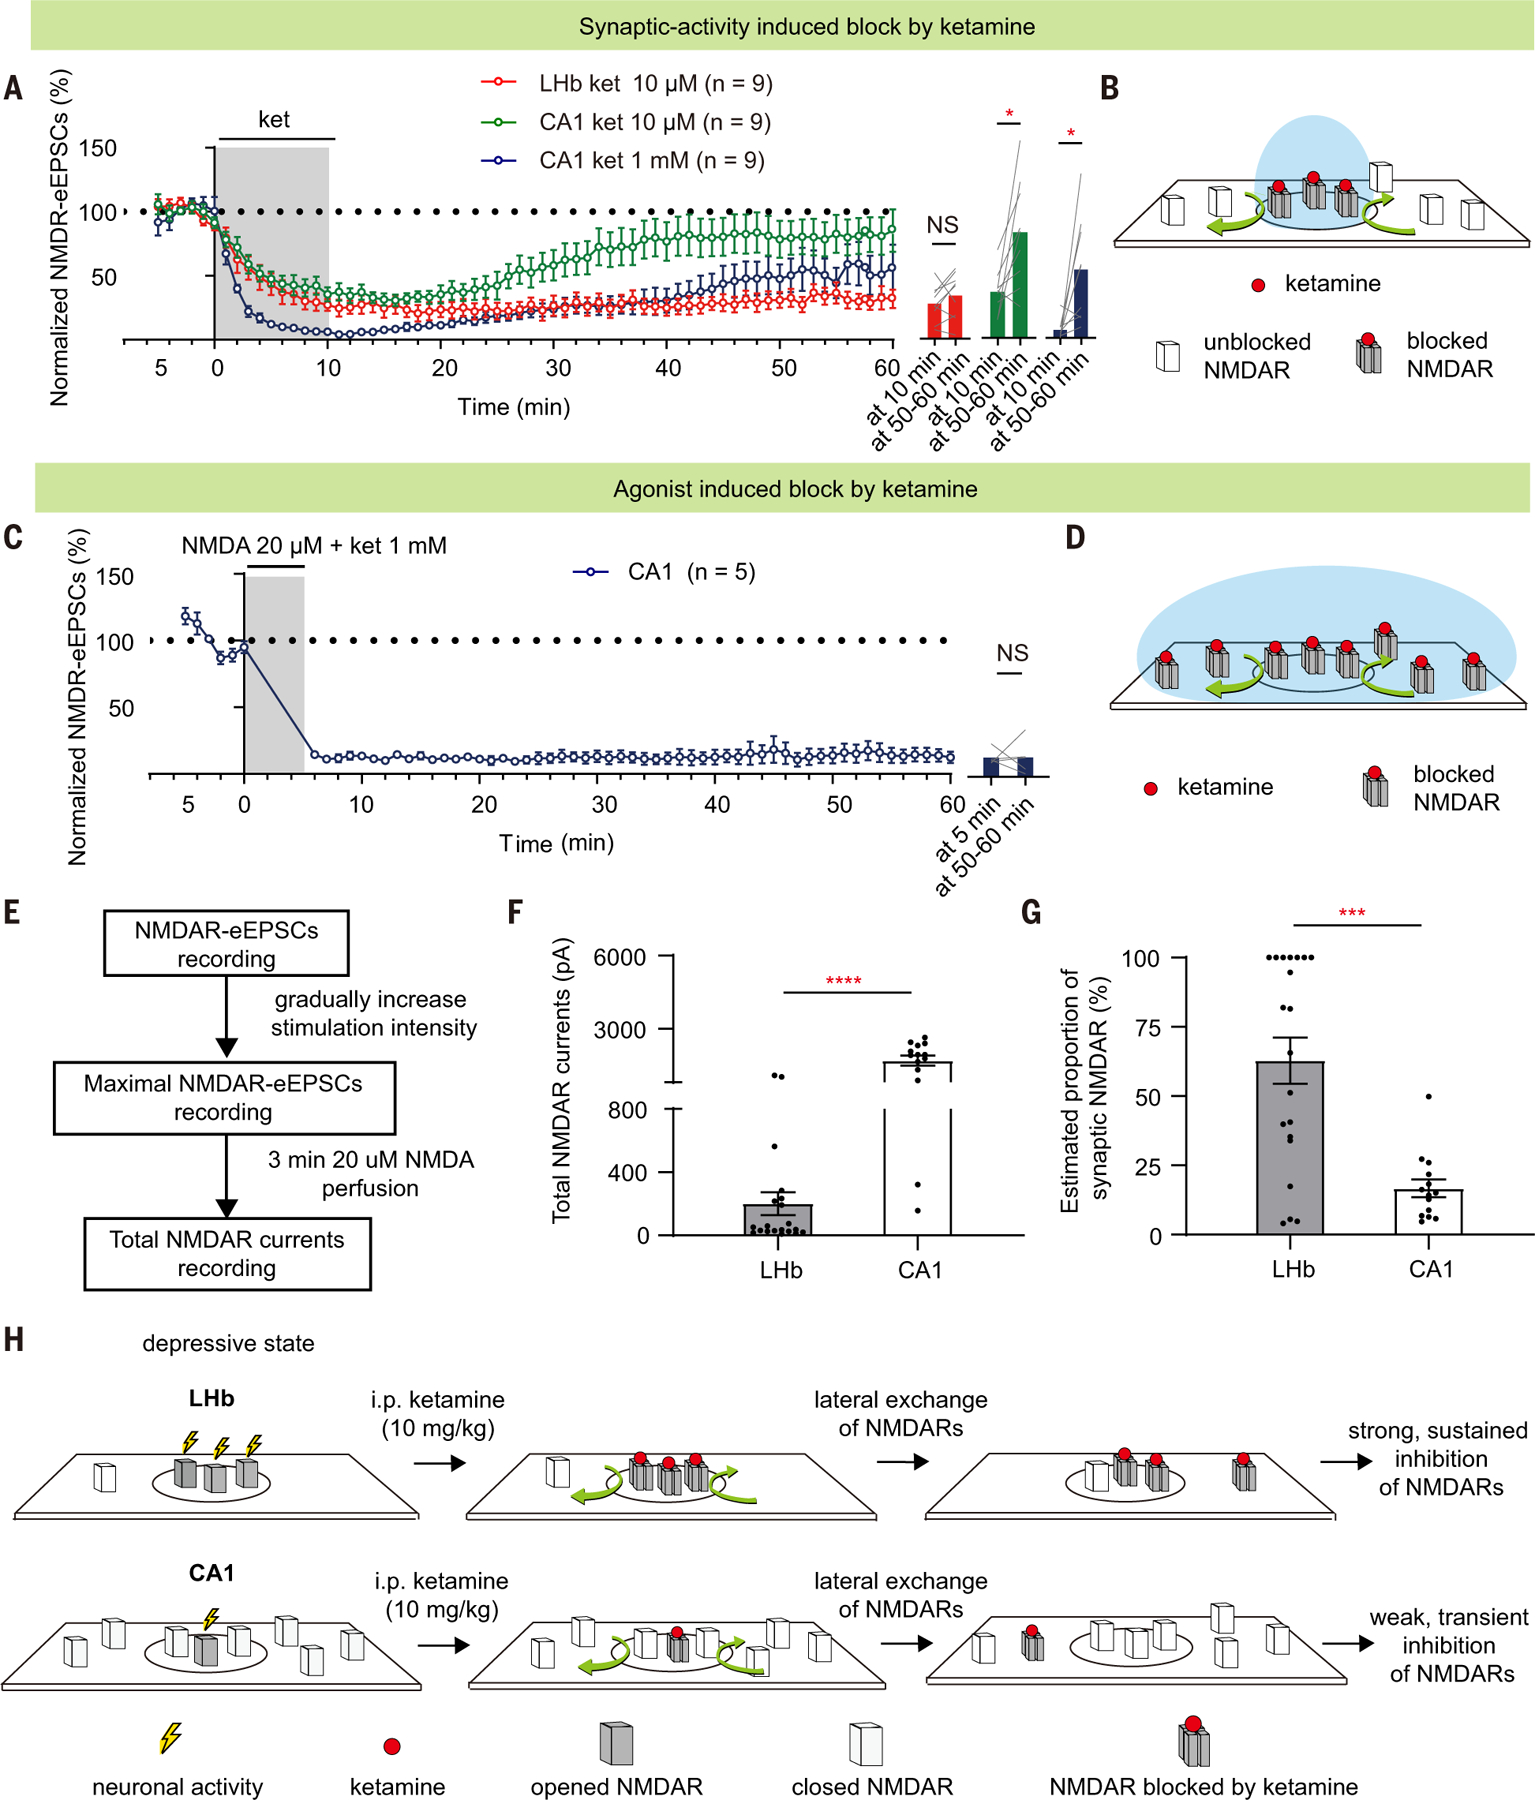
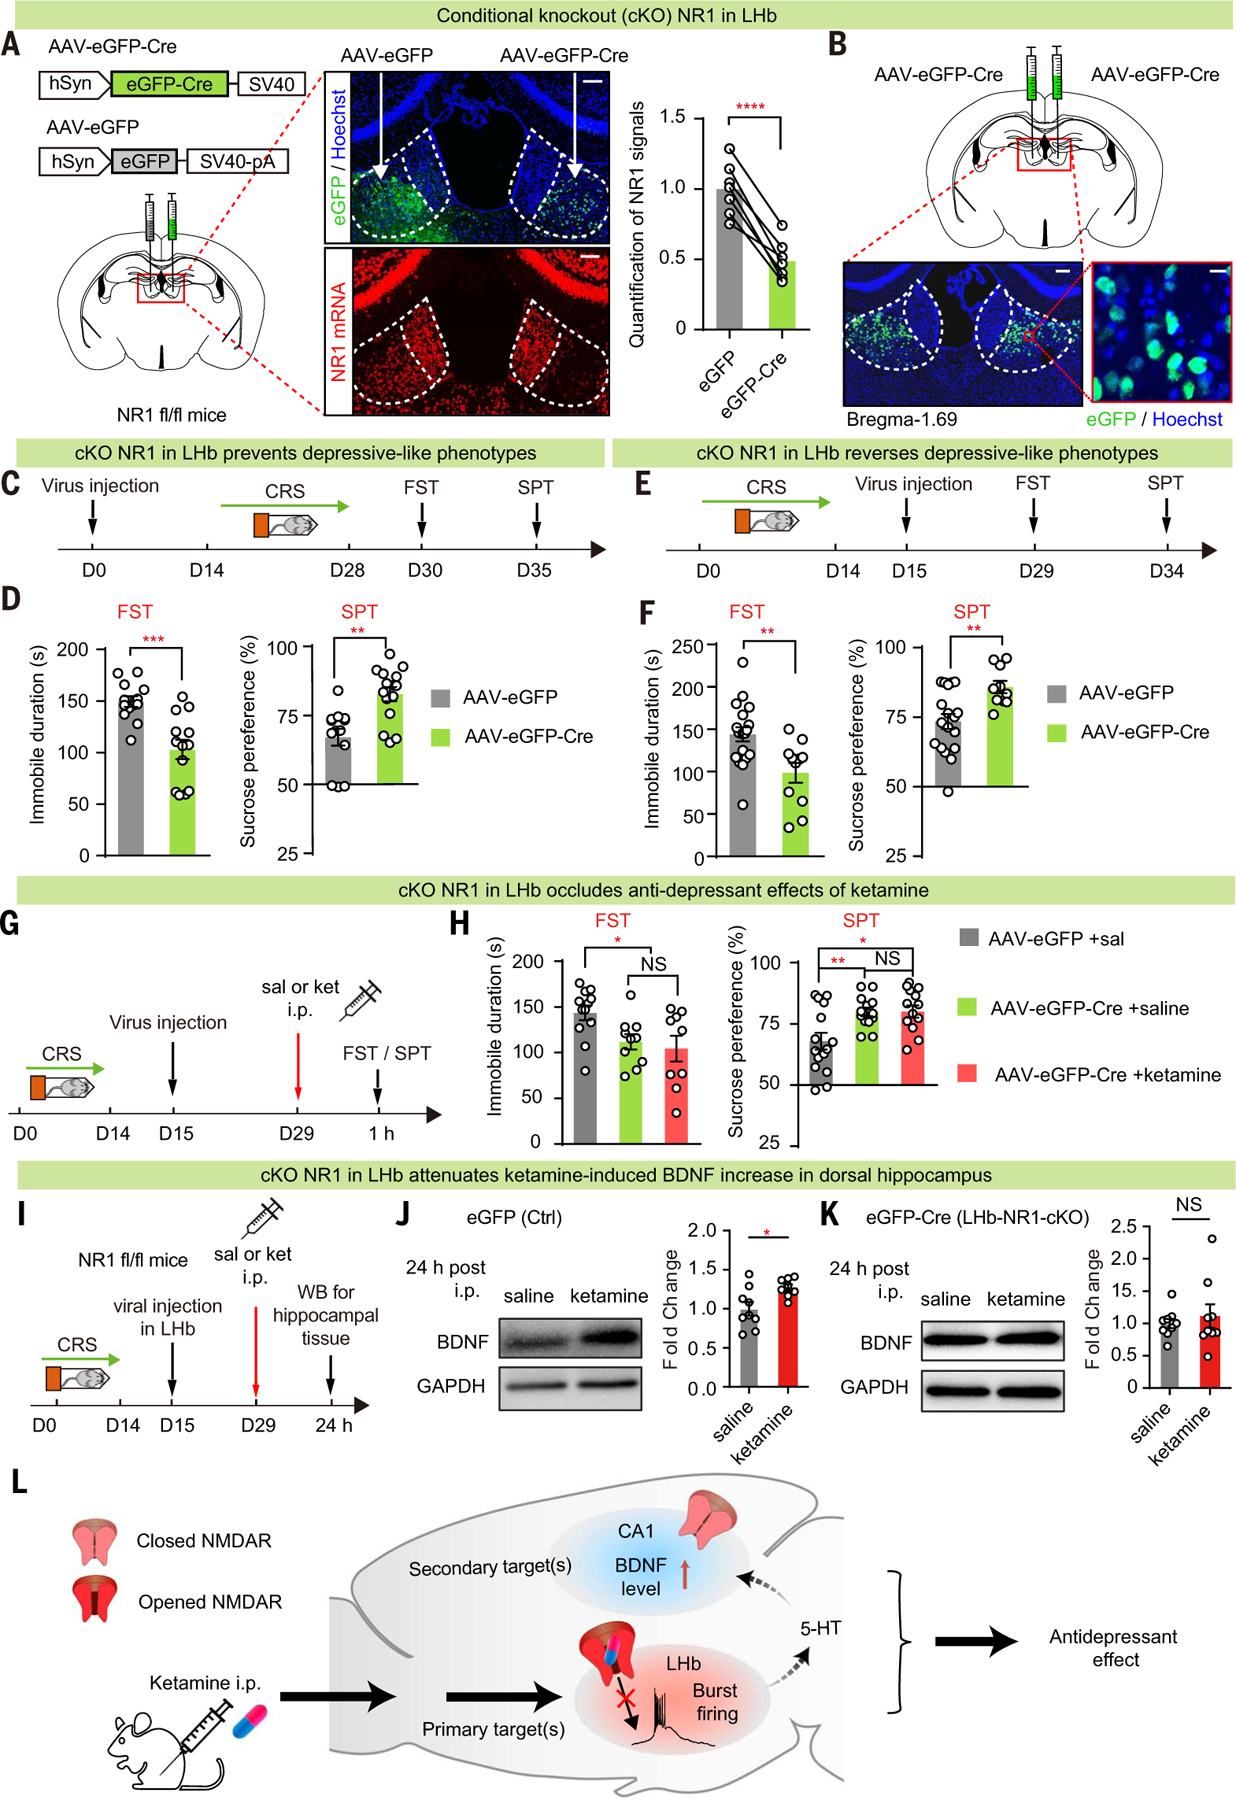
Ketamine has been found to have rapid and potent antidepressant activity. However, despite the ubiquitous brain expression of its molecular target, the N-methyl-d-aspartate receptor (NMDAR), it was not clear whether there is a selective, primary site for ketamine's antidepressant action. We found that ketamine injection in depressive-like mice specifically blocks NMDARs in lateral habenular (LHb) neurons, but not in hippocampal pyramidal neurons. This regional specificity depended on the use-dependent nature of ketamine as a channel blocker, local neural activity, and the extrasynaptic reservoir pool size of NMDARs. Activating hippocampal or inactivating LHb neurons swapped their ketamine sensitivity. Conditional knockout of NMDARs in the LHb occluded ketamine's antidepressant effects and blocked the systemic ketamine-induced elevation of serotonin and brain-derived neurotrophic factor in the hippocampus. This distinction of the primary versus secondary brain target(s) of ketamine should help with the design of more precise and efficient antidepressant treatments.


Figures

Fig. 1.
Fig. 1.. Systemic ketamine injection in depressive-like mice specifically inhibits NMDAR currents in LHb neurons, but not hippocampal CA1 PYR neurons.
(A) Experimental paradigm. Intraperitoneal injection of ketamine (10 mg/kg) in CRS mice. (B and H) Schematic of the whole-cell recording of evoked responses (eEPSCs) in LHb (B) and hippocampal CA1 (H) slices. Hippo, hippocampus. (C and I) AMPAR-eEPSCs (–70 mV, measured at the peak) and NMDAR-eEPSCs (+40 mV, measured at 35 ms after stimulation in LHb neurons and at 60 ms after stimulation in CA1 neurons, dotted lines) in LHb (C) and CA1 PYR (I) neurons in presence of PTX. (D and J) Stimulus-response (input-output) curves of NMDAR-eEPSCs of LHb neurons (D) and CA1 PYR neurons (J). (E and K) Stimulus-response curves of AMPAR-eEPSCs of LHb neurons (E) and CA1 PYR neurons (K). (F and L) Bar graphs of NMDAR-eEPSCs of LHb neurons [P = 0.002, Mann-Whitney test (F)] and CA1 PYR neurons [P = 0.73, Mann-Whitney test (L)] recorded at 1.5-mA stimulation intensity. (G and M) Ratios of NMDAR-eEPSCs and AMPAR-eEPSCs recorded at 1.5-mA stimulation intensity in LHb neurons [P = 0.002, Mann-Whitney test (G)] and CA1 PYR neurons [P = 0.56, Mann-Whitney test (M)]. n = 33 cells in four mice in the saline group and n = 30 cells in three mice in the ketamine group for LHb data; n = 45 cells in five mice in the saline group and n = 36 cells in our mice in the ketamine group for CA1 data in (B) to (M). (N and P) NMDAR-eEPSCs (+40 mV, measured at the peak) in LHb neurons (N) and CA1 PYR neurons (P) in the presence of PTX and NBQX in brain slices prepared 1 hour after intraperitoneal injection of saline or ketamine in CRS mice. (O and Q) Bar graphs of NMDAR-eEPSCs of LHb neurons [P = 0.001, Mann-Whitney test (O)] and CA1 PYR neurons [P = 0.08, Mann-Whitney test (Q)] at 1.5-mA stimulation intensity in brain slices prepared 1 hour after intraperitoneal injection of saline or ketamine in CRS mice. n = 18 cells in two mice in the saline group and n = 21 cells in two mice in the ketamine group for LHb data; n = 25 cells in three mice in saline group and n = 28 cells in three mice in the ketamine group for CA1 data in (N) to (Q). *P < 0.05; **P < 0.01; NS, not significant. Error bars indicate SEM.
Fig. 2.
Fig. 2.. Systemic ketamine injection in depressive-like mice rapidly inhibits the activity of LHb neurons, but not hippocampal CA1 PYR neurons, in vivo.
(A) Experimental paradigm for in vivo recording after intraperitoneal injection of saline or ketamine (10 mg/kg) in CRS mice. (B) Illustration of in vivo tetrode recording. (C) Principal component analysis clustering display of two well-isolated single units in LHb (yellow and green clusters). (D) Example recording sites stained with DAPI. White dotted lines demarcate the medial habenula (MHb) and LHb. White arrows indicate tetrode tracks. Scale bar, 200 µm. DG, dentate gyrus. (E) Raster of sample basal firing of all recorded LHb and CA1 PYR neurons (red indicates bursting firing). Top right: magnified images of the red square area on the left. Scale bar, 20 ms. (F and G) Bar graphs illustrating the basal FR (spike number per second) [P < 0.0001, Mann-Whitney test (F)] and bursting FR (bursting spike number per second) [P < 0.0001, Mann-Whitney test (G)] in LHb neurons and CA1 PYR neurons. n = 239 units in 15 mice in LHb; n = 147 units in 10 mice in CA1. (H and K) Delta firing rate (FRreal time – FRbaseline) in LHb neurons (H) and CA1 PYR neurons (K) after intraperitoneal injection of saline or ketamine (10 mg/kg) in CRS mice. Bin: 100 s. (I and L) Scatter plots of the FR of recorded LHb neurons (I) and CA1 PYR neurons (L) at baseline state plotted against FR at 50 to 60 min after intraperitoneal injection of ketamine. Green, gray, and orange dots indicate neurons showing significant inhibition, no change, and significant increase of FR, respectively. Pie graphs show the percentage of inhibited (green), excited (orange), and unchanged (gray) units. Bar graphs show the FR in LHb neurons [P < 0.0001, Wilcoxon matched-pairs test (I)] and CA1 PYR neurons [P = 0.43, Wilcoxon matched-pairs test (L)] in CRS mice at 50 to 60 min after intraperitoneal injection of ketamine. (J and M) Scatter plots of the bursting FR of recorded LHb neurons (J) and CA1 PYR neurons (M) at baseline state plotted against bursting FR at 50 to 60 min after intraperitoneal injection of ketamine. Pie graphs show the percentage of inhibited (green), excited (orange), and unchanged (gray) units. Bar graphs illustrate the bursting FR in LHb neurons [P < 0.0001, Wilcoxon matched-pairs test (J)] and CA1 PYR neurons [P = 0.47, Wilcoxon matched-pairs test (M)] in CRS mice at 50 to 60 min after intraperitoneal injection of ketamine. (H) to (M), n = 114 cells in 14 mice in saline group and n = 125 cells in 14 mice in the ketamine group in LHb; n = 59 cells in eight mice in the saline group and n = 88 cells in eight mice in the ketamine group in CA1. *P < 0.05; ****P < 0.0001; NS, not significant. Error bars indicate SEM.
Fig. 3.
Fig. 3.. Systemic ketamine injection inhibits NMDAR currents and neuronal activity in LHb of depressive-like, but not naïve mice.
(A) AMPAR-eEPSCs (–70 mV, measured at the peak) and NMDAR-eEPSCs (+40 mV, measured at 35 ms after stimulation, dotted lines) in the presence of PTX in LHb neurons in naïve or CRS mice. (B) Stimulus-response curves of NMDAR-eEPSCs of LHb neurons in naïve or CRS mice. (C) Bar graphs of NMDAR-eEPSCs (P < 0.0001, Mann-Whitney test) of LHb neurons at 1.5-mA stimulation intensity in naïve or CRS mice. (D) Stimulus-response curves of AMPAR-eEPSCs of LHb neurons in naïve or CRS mice. (E) Bar graphs of AMPAR-eEPSCs (P = 0.92, Mann-Whitney test) of LHb neurons at 1.5-mA stimulation intensity in naïve or CRS mice. (F) Bar graphs of ratios of NMDAR-eEPSCs and AMPAR-eEPSCs (P = 0.0006, Mann-Whitney test) of LHb neurons at 1.5-mA stimulation intensity in naïve or CRS mice. (G) Western blot analysis showing up-regulation of NR1 protein in the membrane fraction of the habenula of CRS mice (P = 0.02, n = 6, 6). Tubulin was used as a loading control. (H) Correlation between averaged NMDAR-eEPSCs of recorded LHb neurons and immobile duration in FST (R2 = 0.46, black line; P = 0.004, linear regression test). Green indicates naïve mice (n = 6); black indicates CRS mice (n = 10). NMDAR-eEPSCs are averaged by all recorded LHb neurons in one animal. In (A) to (F) and (H), n = 48 cells in six naïve mice and 93 cells in 10 CRS mice. (I and K) Stimulus-response curves of NMDAR-eEPSCs (I) and AMPAR-eEPSCs (K) of LHb neurons in brain slices prepared 1 hour after intraperitoneal injection of saline or ketamine (10 mg/kg) in naïve mice. (J, L, and M) Bar graphs of NMDAR-eEPSCs [P = 0.28, Mann-Whitney test (J)] and AMPAR-eEPSCs [P = 0.84, Mann-Whitney test (L)], ratios of NMDAR-eEPSCs and AMPAR-eEPSCs [P = 0.31, Mann-Whitney test (M)] of LHb neurons at 1.5-mA stimulation intensity in brain slices prepared 1 hour after intraperitoneal injection of saline or ketamine in naïve mice. In (I) to (M), n = 24 cells in three mice in the saline group and n = 22 cells in two mice in the ketamine group. (N and O) Bar graphs illustrating the FR [P < 0.0001, Mann-Whitney test (N)] and bursting FR [P < 0.0001, Mann-Whitney test (O)] of LHb neurons in naïve or CRS mice. n = 108 cells in six mice in the naïve group and n = 114 cells in 14 mice in the CRS group. (P) Delta firing rate (FRreal time – FRbaseline) in LHb neurons after intraperitoneal injection of saline or ketamine (10 mg/kg) in naïve mice. Bin: 100 s. (Q and R) Scatter plots of the FR (Q) and bursting FR (R) of recorded LHb neurons at the baseline state plotted against FR or bursting FR at 50 to 60 min after intraperitoneal injection of ketamine. Green, gray, and orange dots indicate neurons showing significant inhibition, no change, and significant increase of FR or bursting FR, respectively. Pie graphs show the percentage of inhibited (green), excited (orange), and unchanged (gray) units. Bar graphs show the FR [P = 0.20, Wilcoxon matched-pairs test (Q)] or bursting FR [P = 0.36, Wilcoxon matched-pairs test (R)] of LHb neurons in naïve mice 50 to 60 min after intraperitoneal injection of ketamine. In (P) to (R), n = 108 cells in six mice in the saline group and n = 106 cells in six mice in the ketamine group. *P < 0.05; **P < 0.01; ***P < 0.001; ****P < 0.0001; NS, not significant. Error bars indicate SEM.
Fig. 4.
Fig. 4.. Activation of CA1 and inhibition of LHb swap their sensitivity to ketamine blockade.
(A) Immunostaining showing the expression of hM3D in CA1. White arrow indicates site of AAV-hM3D-mCherry virus injection. White dashed box indicates the infection border for whole-cell patch recording. Scale bar, 200 μm. (B) Current-voltage relationship of an hM3D-viral-infected CA1 PYR neuron recorded before and after 5 mM CNO perfusion. Raw traces show individual voltage responses to a series of 500-ms current pulses from 0 to 140 pA in 20-pA steps. Red traces indicate the minimal current to induce action potentials. (C) Resting membrane potential (RMP) before and after 5 µM CNO perfusion (n = 7 cells; P = 0.001, paired t test). (D) Minimal injected current to induce action potential (AP) before and after 5 µM CNO perfusion (n = 7 cells; P = 0.004, paired t test). (E) Experimental paradigm recording of CA1 PYR neurons in brain slices prepared 1 hour after intraperitoneal injection of saline or ketamine (10 mg/kg) in mice expressing hM3D-mCherry in CA1 PYR neurons, with CNO (1 mg/kg) intraperitoneal injection 30 min before ketamine administration. (F) Schematic of stimulation electrode placement and paired-recording of neighboring hM3D+ (red) and hM3D (black) PYR neurons in CA1. (G) Patchclamp recording of a pair of transfected hM3D+ and neighboring untransfected hM3D CA1 PYR neurons under transmitted and fluorescent light microscopy. Dotted lines indicate the patch pipettes. Scale bar, 10 µm. (H and I) Left: eEPSCs in recorded hM3D+ and hM3D CA1 PYR neuron pairs. Scale bar, 20 ms, 100 pA. Right: scatter plots of NMDAR-eEPSCs [P = 0.003, Wilcoxon matched-pairs test (H); P = 0.20, Wilcoxon matched-pairs test (I)] and AMPAR-eEPSCs [P = 0.17, Wilcoxon matched-pairs test (H); P = 0.94, Wilcoxon matched-pairs test (I)] recorded at 0.75-mA stimulation intensity in recorded hM3D+ and hM3D CA1 PYR neuron pairs after intraperitoneal injection of saline (I) or ketamine (H) (n = 25 cell pairs in three mice in the saline group and 24 cell pairs in four mice in the ketamine group). Red dots indicate the averaged values of all recorded cells, and solid black dots indicate the example cells. (J) White arrow indicates site of AAV-eNpHR3.0-mCherry virus injection. Immunostaining showing expression of eNpHR3.0 in LHb. White dashed lines indicate the LHb. Sm: stria medullaris. Yellow dashed lines indicate the optic fiber. Scale bar, 200 μm. (K) Inhibitory effect of yellow light (589 nm) on eNpHR3.0-expressing LHb neurons. Shown is a sample trace of whole-cell recording in LHb neurons under current-clamp mode with 20-pA current injected. (L) RMP of LHb neurons during lights off and lights on (n = 10; P = 0.0003, paired t test). (M) Experimental paradigm. (N) Schematic of stimulation electrode placement and paired-recording of neighboring eNpHR+ (red) and eNpHR (black) neurons in LHb. (O) Patch-clamp recording of a pair of transfected eNpHR+ and neighboring untransfected eNpHR LHb neurons under transmitted and fluorescent light microscopy. Dotted lines indicate the patch pipettes. Scale bar, 10 µm. (P and Q) Left: example traces of evoked EPSCs in recorded eNpHR+ and eNpHR LHb neuron pairs. Scale bar, 10 ms, 100 pA. Right: scatter plots of NMDAR-eEPSCs [P = 0.004, Wilcoxon matched-pairs test (P); P = 0.63, Wilcoxon matched-pairs test (Q)] and AMPAR-eEPSCs [P = 0.73, Wilcoxon matched-pairs test (P); P = 0.63, Wilcoxon matched-pairs test (Q)] recorded at 1.5-mA stimulation intensity in recorded eNpHR+ and eNpHR LHb neuron pairs after intraperitoneal injection of saline (Q) or ketamine (P). n = 26 cell pairs in seven mice in the saline group and n = 26 cell pairs in seven mice in the ketamine group. Red dots indicate the averaged values of all recorded cells, and solid black dots indicate the example cells. **P < 0.01; ***P < 0.001; NS, not significant. Error bars indicate SEM.
Fig. 5.
Fig. 5.. Reservoir pool size of NMDARs and recovery rate from ketamine blockade also contribute to brain region specificity.
(A) NMDAR-eEPSCs (normalized by baseline) during incubation and washout of 10 µM or 1 mM ketamine in LHb or CA1 PYR neurons. Right: bar graphs showing NMDAR-eEPSCs at the end of the 10-min perfusion period and at 50 to 60 min after perfusion (LHb group: P = 0.25, paired t test; CA1 10 µM group: P = 0.01, paired t test; CA1 10 µM group: P = 0.02, Wilcoxon matched-pairs test). n = 9. (B and D) Schematics illustrating how synaptic blockade [(B) for conditions in (A)] and agonist-induced blockade [(D) for conditions in (C)] of NMDARs by ketamine are affected by lateral movement of NMDARs in and out of synapse. Black circles represent synaptic sites. Blue circles represent the area where NMDARs can be opened by corresponding treatment [synaptic stimulation in (A) or agonist perfusion in (C)]. Red dots represent ketamine. (C) NMDAR-eEPSCs (normalized by baseline) during incubation and washout of ketamine (1 mM) and NMDA (20 µM) in CA1 PYR neurons (n = 5). Right: bar graphs showing NMDAR-eEPSCs at the end of the 5-min perfusion period and at 50 to 60 min after perfusion (P > 0.99, Wilcoxon matched-pairs test). n = 5. (E) Experimental paradigm for slice recording to estimate the proportion of synaptic NMDAR-eEPSCs in total NMDAR currents. (F and G) Bar graphs illustrating the total NMDAR currents [P < 0.0001, Mann-Whitney test (F)] and estimated proportion of synaptic NMDAR [P = 0.001, Mann-Whitney test (G)] of LHb and CA1 PYR neurons. Estimated proportion of synaptic NMDAR is calculated as maximal NMDAR-eEPSCs divided by the total NMDAR currents. n = 20 in the LHb group and n = 14 cells in the CA1 group. (H) Schematic model illustrating why systemic ketamine has a stronger and more sustained blockade of NMDARs in the LHb, but not hippocampal CA1 PYR neurons, under a depressive state. The high basal activity allows LHb neurons for ketamine’s open-channel blockade, and the small reservoir pool and the trapping effect are responsible for a slow recovery of NMDAR transmission. By contrast, in hippocampal CA1 neurons, which are not as active under a depressive-like state, the available pool of open NMDARs for ketamine blockade is small to start with. After this small pool is inhibited, the large, extrasynaptic reservoir pool of NMDARs quickly exchanges with the blocked ones through lateral movement, resulting in a rapid recovery of NMDAR transmission. Circles represent synaptic areas where NMDARs can bind to synaptically released glutamate. *P < 0.05; ***P < 0.001; ****P < 0.0001; NS, not significant. Error bars indicate SEM.
Fig. 6.
Fig. 6.. Local knockout of NR1 in LHb is sufficient to have an antidepressant effect and occludes ketamine’s anti-depressant effects.
(A) Left: schematics of viral constructs and injection of AAV virus expressing eGFP on one side and Cre in the other side of the LHb of NR1 flox/flox (NR1 fl/fl) mice. Middle: viral expression (top) and RNAscope staining of NR1 (bottom) in brain slices expressing AAV-eGFP and AAV-eGFP-Cre in one of the two sides of the LHb. Scale bars, 100 µm. Right: quantification of NR1 signals to estimate knockout efficiency (n = 7 for AAV-eGFP-Cre and AAV-eGFP; P < 0.0001, paired t test). (B) Illustration of bilateral viral injection of AAV-eGFP-Cre in LHb of NR1 fl/fl mice stained with Hoechst. Scale bars, 100 µm (left) and 10 µm (right). (C, E, and G) Experimental paradigm for behavioral testing with virus injected in the LHb before (C) or after [(E) and (G)] induction of CRS. (G) Ketamine (10 mg/kg) was intraperitoneally injected 1 hour before FST or SPT. (D, F, and H) Depressivelike behaviors in FST [P = 0.0002, n = 13, 13 (D); P = 0.004, n = 19, 11 (F); n = 12, 10, 9 (H), eGFP + saline versus Cre + saline P = 0.01, Cre + saline versus Cre + ketamine P = 0.65, eGFP + saline versus Cre + ketamine P = 0.02] and SPT [P = 0.002, n = 13, 15 (D); P = 0.005, n = 18, 10 (F); n = 15, 13, 12 (H), eGFP + saline versus Cre + saline P = 0.007, Cre + saline versus Cre + ketamine P = 0.95, eGFP + saline versus Cre + ketamine P = 0.01]. (I to K) Experimental paradigm (I) and Western blot analysis [(J) and (K)] of dorsal hippocampal BDNF 24 hours after intraperitoneal injection of ketamine (10 mg/kg) in control (J) or LHb-NR1-cKO (K) mice [P = 0.02 (J); P = 0.98 (K)]. GAPDH was used as a loading control. For control, n = 9 mice in the saline group and n = 8 mice in the ketamine group; for cKO, n = 9 mice in the saline group and n = 9 mice in the ketamine group. (L) Schematic model illustrating the primary and secondary brain targets of ketamine in mediating its antidepressant effects. *P < 0.05; **P < 0.01; ***P < 0.001; ****P < 0.0001; NS, not significant. Error bars indicate SEM.

Comment in

  • Locking away depression.
    Silva JCH, Proulx CD. Silva JCH, et al. Science. 2024 Aug 9;385(6709):608-609. doi: 10.1126/science.adq9566. Epub 2024 Aug 8. Science. 2024. PMID: 39116256

References

    1. Berman RM et al. , Antidepressant effects of ketamine in depressed patients. Biol. Psychiatry 47, 351–354 (2000). doi: 10.1016/S0006-3223(99)00230-9; - DOI - PubMed
    1. Zarate CA Jr et al. , A randomized trial of an N-methyl-D-aspartate antagonist in treatment-resistant major depression. Arch. Gen. Psychiatry 63, 856–864 (2006). doi: 10.1001/archpsyc.63.8.856; - DOI - PubMed
    1. Krystal JH, Abdallah CG, Sanacora G, Charney DS, Duman RS, Ketamine: A paradigm shift for depression research and treatment. Neuron 101, 774–778 (2019). doi: 10.1016/j.neuron.2019.02.005; - DOI - PMC - PubMed
    1. Simmler LD et al. , Dual action of ketamine confines addiction liability. Nature 608, 368–373 (2022). doi: 10.1038/s41586-022-04993-7; - DOI - PubMed
    1. Autry AE et al. , NMDA receptor blockade at rest triggers rapid behavioural antidepressant responses. Nature 475, 91–95 (2011). doi: 10.1038/nature10130; - DOI - PMC - PubMed

Publication types

MeSH terms