

Silence of the lungs: comparing measures of slow and noncommunicating lung units from pulmonary function tests with computed tomography
- PMID: 39116346
- PMCID: PMC11486470
- DOI: 10.1152/japplphysiol.00340.2024
Silence of the lungs: comparing measures of slow and noncommunicating lung units from pulmonary function tests with computed tomography
Abstract
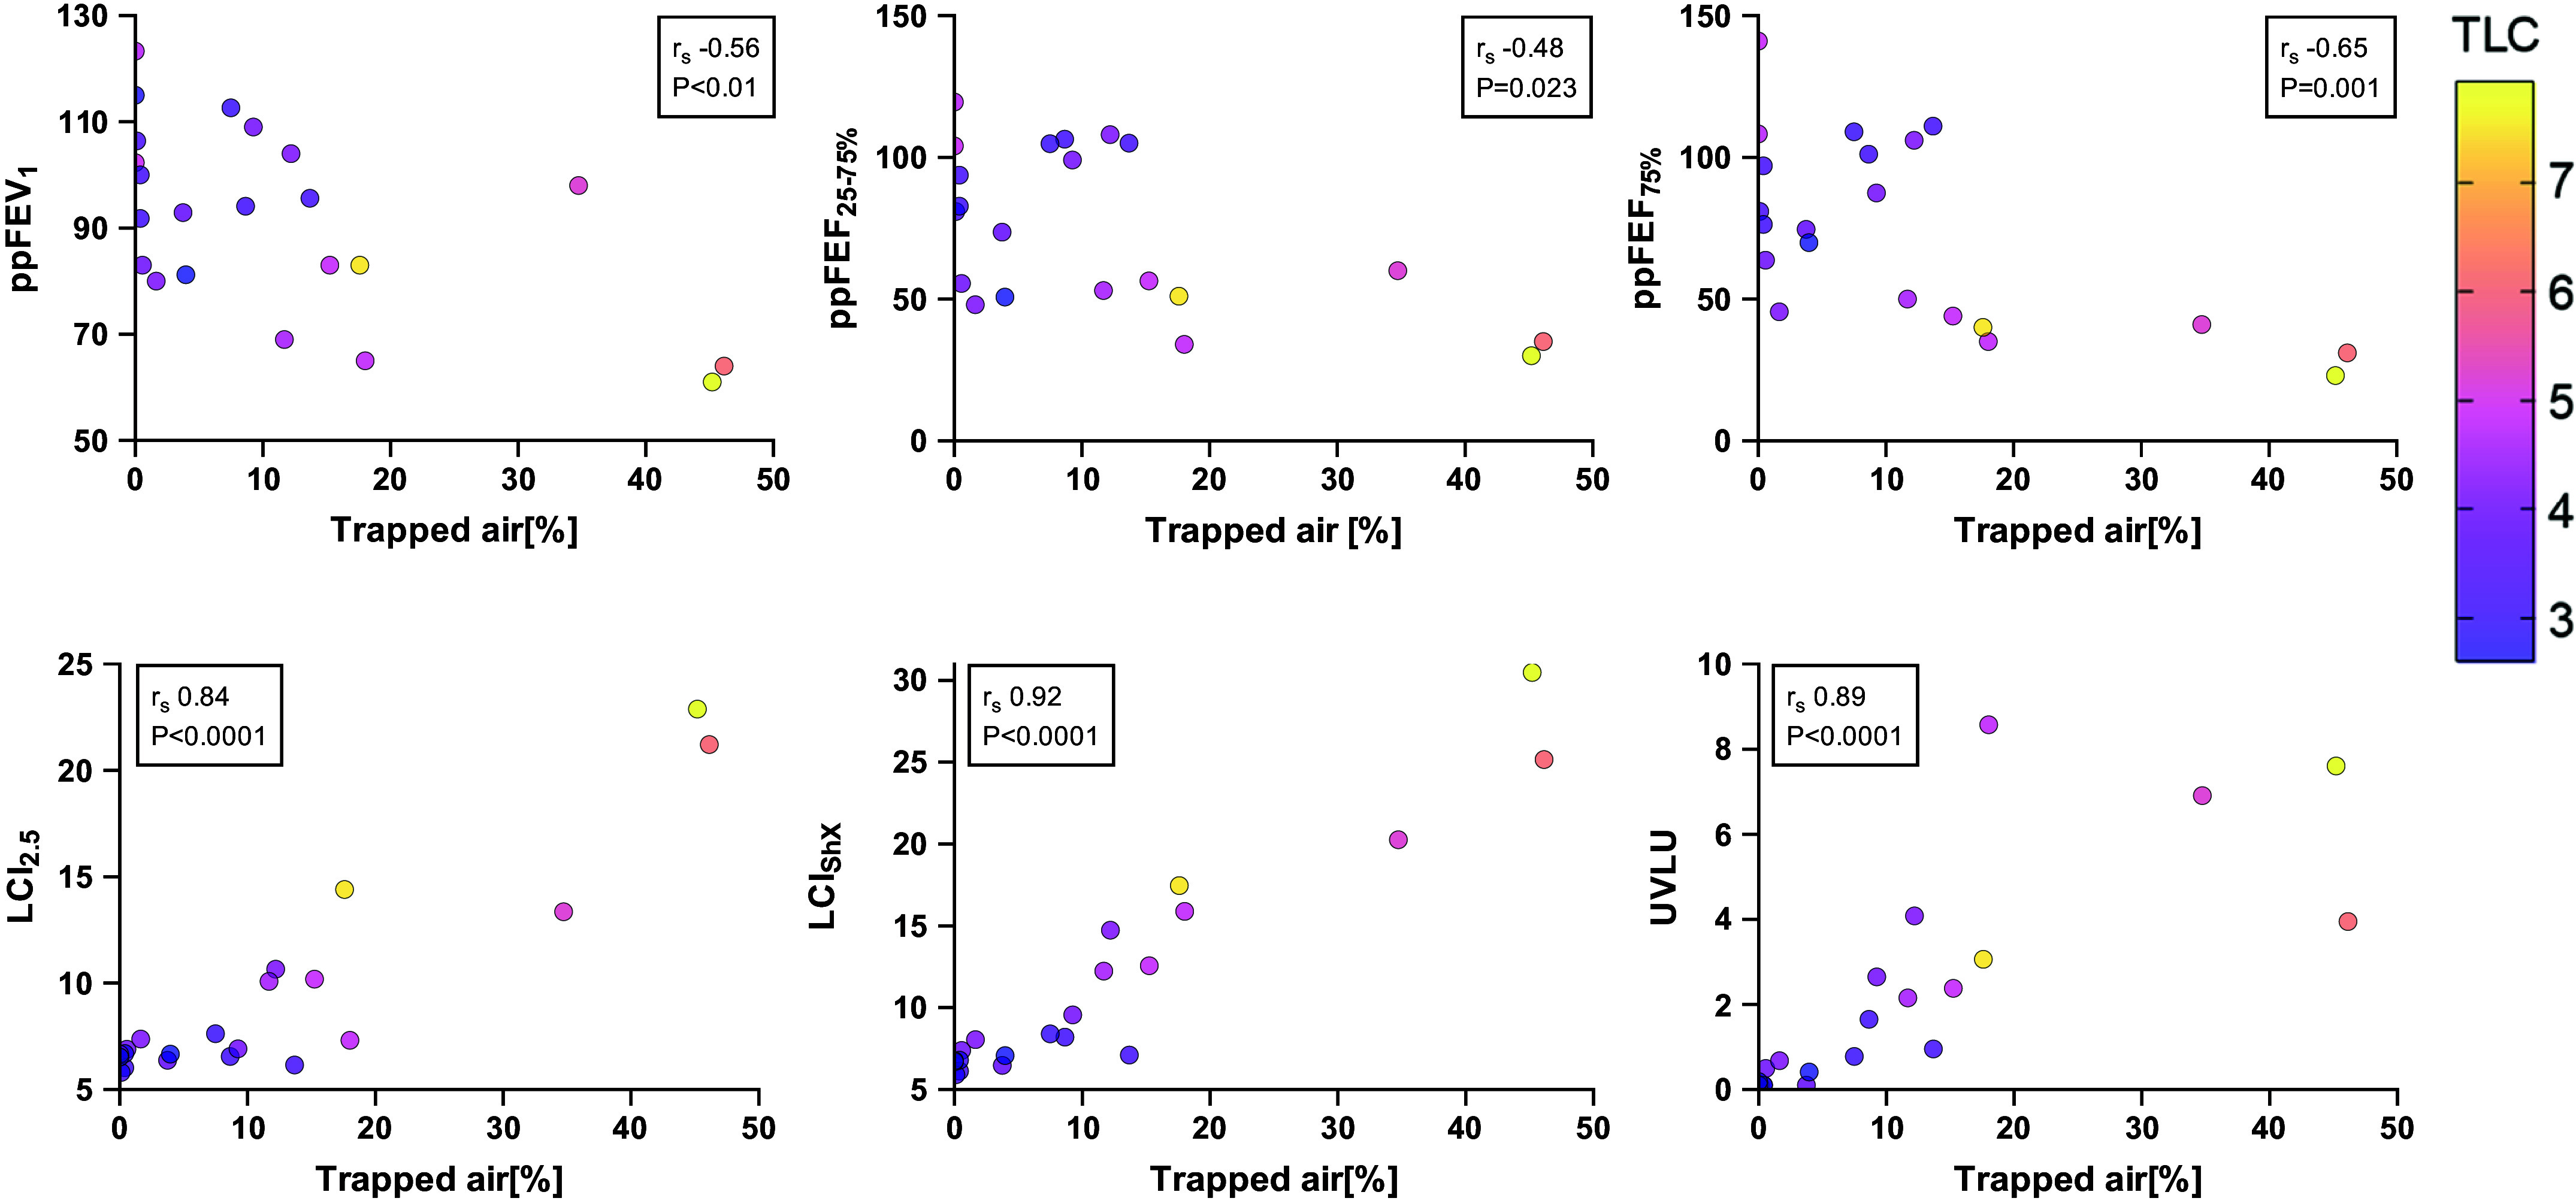
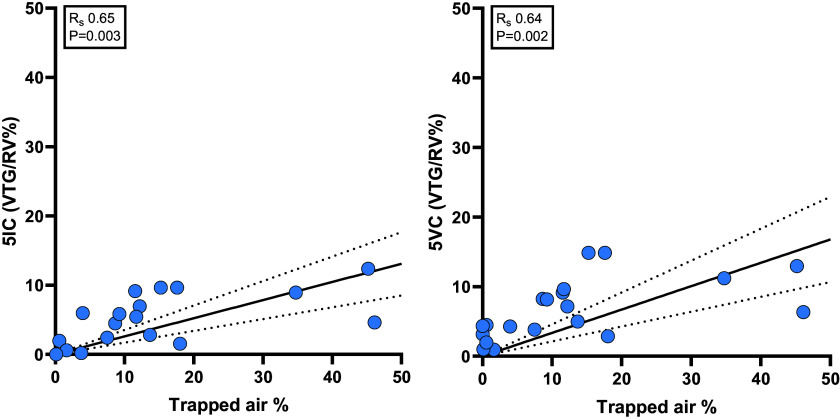
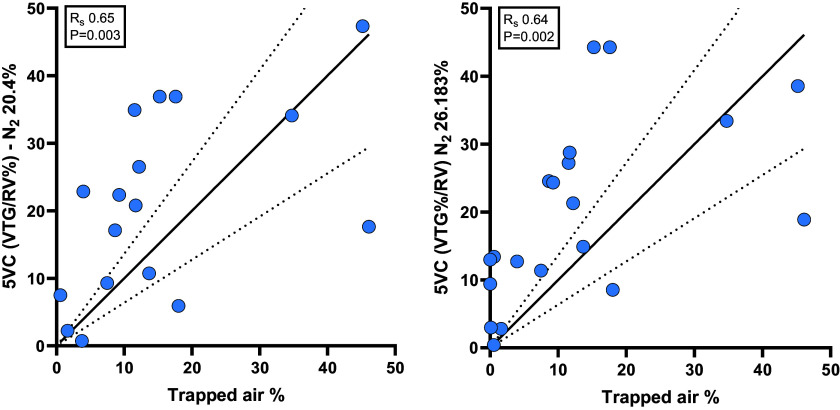
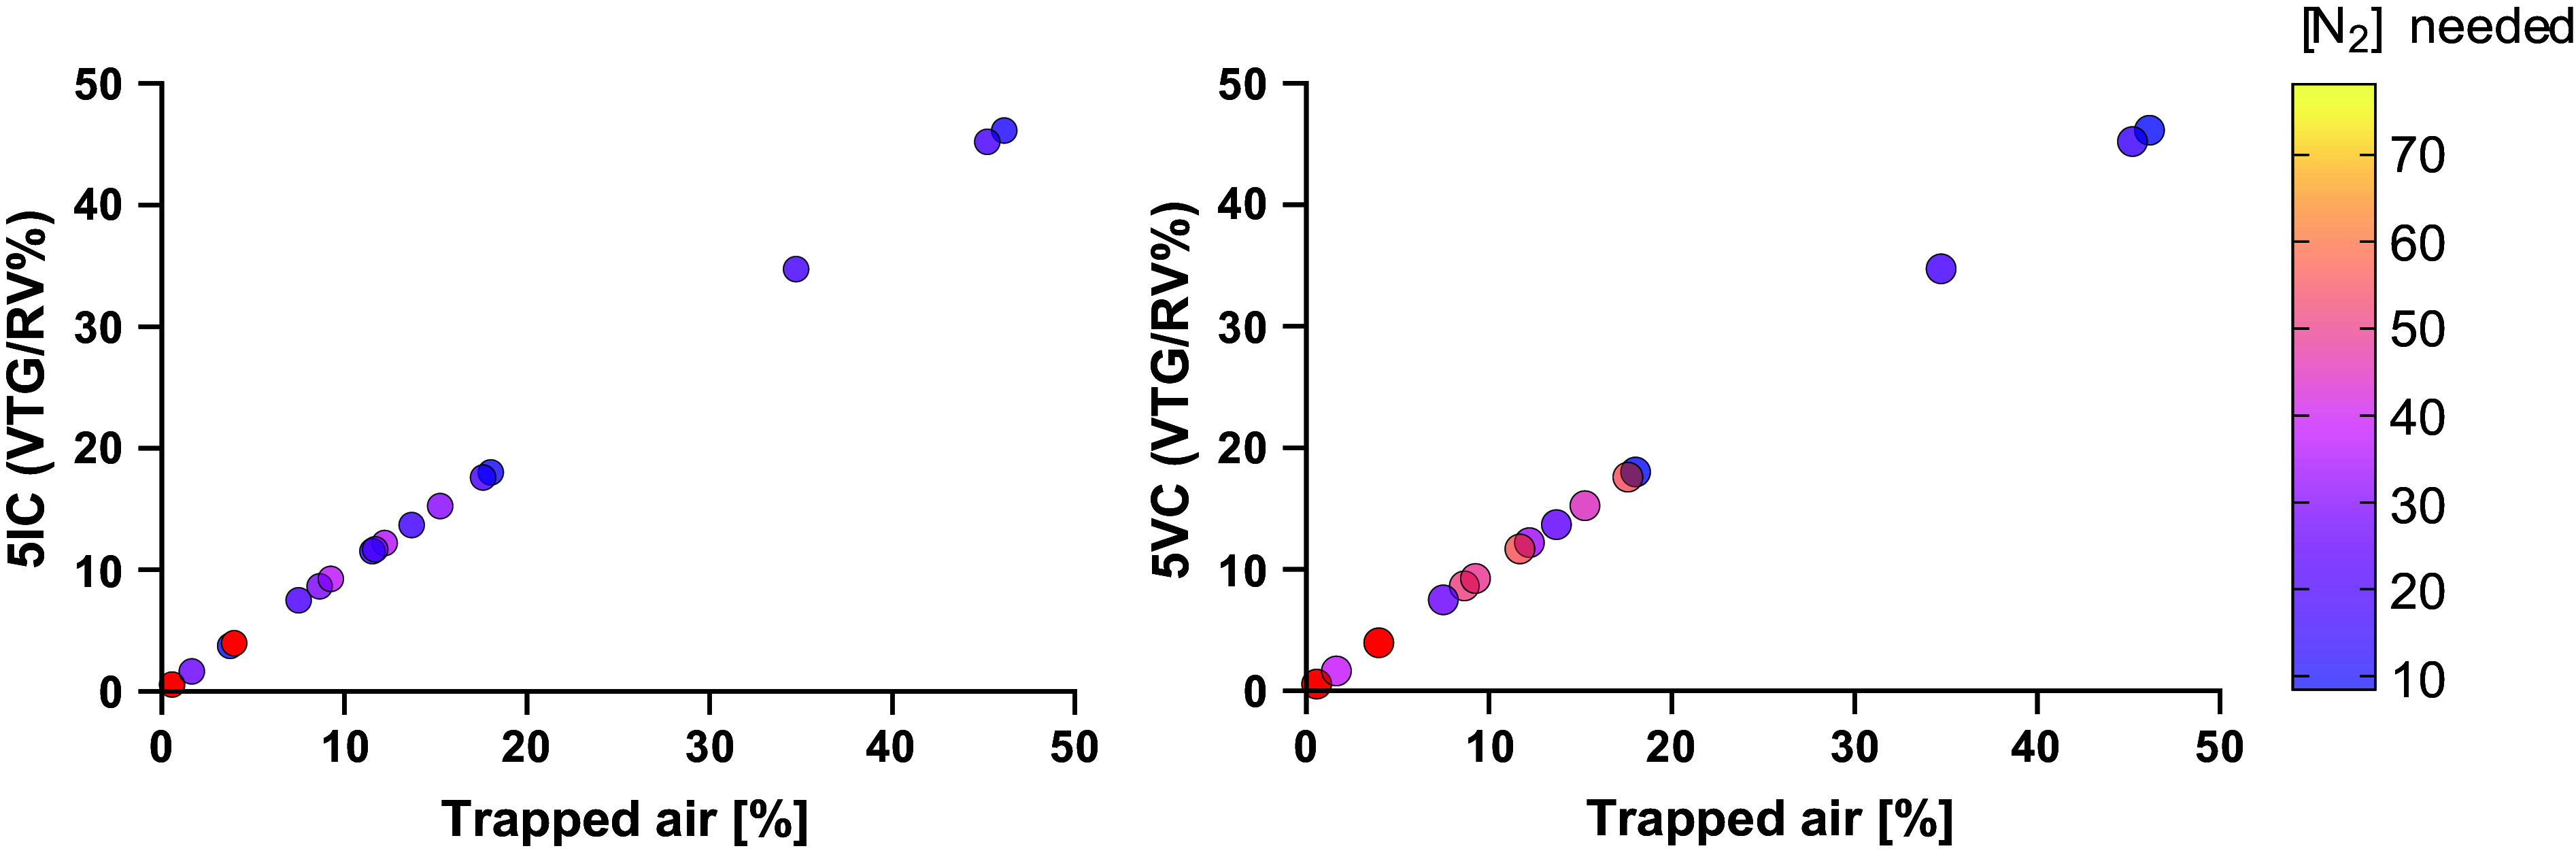
Multiple breath washout (MBW) has successfully assessed the silent lung zone particularly in cystic fibrosis lung disease, however, it is limited to the communicating lung only. There are a number of different pulmonary function methods that can assess what is commonly referred to as trapped air, with varying approaches and sensitivity. Twenty-five people with cystic fibrosis (pwCF) underwent MBW, spirometry, body plethysmography, and spirometry-controlled computed tomography (spiro-CT) on the same day. PwCF also performed extensions to MBW that evaluate air trapping, including our novel extension (MBWShX), which reveals the extent of underventilated lung units (UVLU). In addition, we used two previously established 5-breath methods that provide a volume of trapped gas (VTG). We used trapped air % from spiro-CT as the gold standard for comparison. UVLU derived from MBWShX showed the best agreement with trapped air %, both in terms of correlation (RS 0.89, P < 0.0001) and sensitivity (79%). Bland-Altman analysis demonstrated a significant underestimation of the VTG by both 5-breath methods (-249 mL [95% CI -10,796; 580 mL] and -203 mL [95% CI -997; 591 mL], respectively). Parameters from both spirometry and body plethysmography were suboptimal at assessing this pathophysiology. The parameters from MBWShX demonstrated the best relationship with spiro-CT and had the best sensitivity compared with the other pulmonary function methods assessed in this study. MBWShX shows promise to assess and monitor this critical pathophysiological feature, which has been shown to be a driver of lung disease progression in pwCF.NEW & NOTEWORTHY We consider the term "trapped air" either in the use of imaging or pulmonary function testing, something of a misnomer that can lead to an inaccurate assessment of an important physiological feature. Instead, we propose the term underventilated lung units (UVLU). Of the many pulmonary function methods we used in this study, we found that the use of multiple breath washout with short extension (MBWShX) to be the best nonimaging method.
Keywords: air trapping; collateral ventilation; cystic fibrosis (CF); pulmonary function testing (PFT); pulmonary physiology.
Conflict of interest statement
Harm Tiddens reports grants from Vectura Group Plc., other from Roche and Novartis, grants from CFF, Vertex, Gilead and Chiesi, outside the submitted work. In addition, Harm Tiddens has a patent Vectura licensed, and a patent PRAGMA-CF scoring system issued and is heading the Erasmus MC-Sophia Children’s Hospital Core Laboratory Lung Analysis. Paul McNally reports independent grants and speaker/board honoraria from Vertex outside the submitted work. Jane C Davies and her institution have received fees for Advisory Board participation, clinical trial leadership, and speaking engagements from Vertex Pharmaceuticals in the field of CFTR modulators but not directly related to this study, and from AbbVie, Arcturus, Boehringer Ingelheim, Eloox, Enterprise Thearpeutics and Novartis outside the scope of this work. None of the other authors has any conflicts of interest, financial or otherwise, to disclose.
Figures
References
-
- Davies JC, Sermet-Gaudelus I, Naehrlich L, Harris RS, Campbell D, Ahluwalia N, Short C, Haseltine E, Panorchan P, Saunders C, Owen CA, Wainwright CE;. VX16-661-115 Investigator Group. A phase 3, double-blind, parallel-group study to evaluate the efficacy and safety of tezacaftor in combination with ivacaftor in participants 6 through 11 years of age with cystic fibrosis homozygous for F508del or heterozygous for the F508del-CFTR mutation and a residual function mutation. J Cyst Fibros 20: 68–77, 2021. doi:10.1016/j.jcf.2020.07.023. - DOI - PubMed
-
- Kent L, Reix P, Innes JA, Zielen S, Le Bourgeois M, Braggion C, Lever S, Arets HGM, Brownlee K, Bradley JM, Bayfield K, O'Neill K, Savi D, Bilton D, Lindblad A, Davies JC, Sermet I, De Boeck K;. European Cystic Fibrosis Society Clinical Trial Network (ECFS-CTN) Standardisation Committee. Lung clearance index: evidence for use in clinical trials in cystic fibrosis. J Cyst Fibros 13: 123–138, 2013. doi:10.1016/j.jcf.2013.09.005. - DOI - PubMed
Publication types
MeSH terms
Grants and funding
LinkOut - more resources
Full Text Sources
Medical