

doi: 10.2105/AJPH.2024.307749.
Epub 2024 Aug 8.
Implementation of Neighborhood-Level Wastewater-Based Epidemiology to Measure and Mitigate Inequities in SARS-CoV-2 Infection in Boston, Massachusetts
Affiliations
- PMID: 39116401
- PMCID: PMC11447771
- DOI: 10.2105/AJPH.2024.307749
Item in Clipboard
Implementation of Neighborhood-Level Wastewater-Based Epidemiology to Measure and Mitigate Inequities in SARS-CoV-2 Infection in Boston, Massachusetts
Am J Public Health.
2024 Nov.
Abstract
Starting October 2022, the Boston Public Health Commission implemented a neighborhood-level wastewater-based epidemiology program to inform strategies to reduce COVID-19 inequities. We collected samples twice weekly at 11 neighborhood sites, covering approximately 18% of Boston, Massachusetts's population. Results from the program's first year revealed inequities unobservable in regional wastewater data both between the City of Boston and the greater Boston area and between Boston neighborhoods. We report program results and neighborhood-specific recommendations and resources to help residents interpret and use our findings. (Am J Public Health. 2024;114(11):1217-1221. https://doi.org/10.2105/AJPH.2024.307749).
Figures

Trends, Lead Time, and Correlation in Citywide Population-Weighted Average SARS-CoV-2 Concentration Observed Across BPHC Sampling Sites Compared With (a) MWRA North Location Wastewater Concentration, (b) Reported COVID-19 Case Rates, (c) MWRA South Location Wastewater Concentration, (d) COVID-19 Emergency Department Visits, (e) New COVID-19 Hospital Admissions, and (f) COVID-19 Deaths: Boston, MA, October 2022–September 2023 Note. BPHC = Boston Public Health Commission; MWRA = Massachusetts Water Resources Authority; MWRA North = northern location; MWRA South = southern location. Red lines show SARS-CoV-2 concentration. Blue lines show COVID-19 indicators. COVID-19 clinical indicators included Boston-area regional wastewater concentrations from MWRA. All indicators were scaled and centered, with mean zero and units in SDs from the mean and shown with a LOESS (locally estimated scatterplot smoothing) line with a span of 0.15. Indicators were ordered by shortest lead time (MWRA North, 0 d) to longest lead time (COVID-19 deaths, +21 d). Details for each individual data source can be found in Table D (available as a supplement to the online version of this article at http://www.ajph.org ), and corresponding data for total inpatient hospitalizations and total adult intensive care unit hospitalizations can be found in Figure E (available as a supplement to the online version of this article at http://www.ajph.org ).
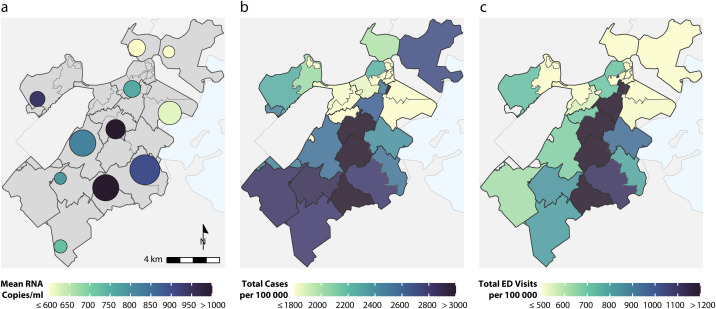
Representation of (a) Wastewater SARS-CoV-2 Concentration at BPHC Wastewater Neighborhood Sampling Sites, (b) Cumulative Reported COVID-19 Case Rates per 100 000 Population Across Boston ZCTAs, and (c) Cumulative COVID-19 Emergency Department (ED) Visits per 100 000 Population Across Boston ZCTAs: Boston, MA, October 2022–September 2023 Note. Sample size was n = 11. BPHC = Boston Public Health Commission; RNA = ribonucleic acid; ZCTA = zip code tabulation area. In panel a, the size of the circle corresponds to the population covered by the neighborhood sampling site. Table D (available as a supplement to the online version of this article at http://www.ajph.org ) provides indicator definitions and sampling site description and details. Figure C (available as a supplement to the online version of this article at http://www.ajph.org ) provides a list of neighborhood sampling sites.
References
-
- Boston Public Health Commission. Health of Boston 2023: the provisional mortality and life expectancy report. 2023. Available at: https://www.boston.gov/sites/default/files/file/2023/05/HOB_Mortality_LE.... Accessed July 8, 2024.
-
- Njoku AU. COVID-19 and environmental racism: challenges and recommendations. Eur J Environ Public Health. 2021;5(2):em0079. 10.21601/ejeph/10999 - DOI
-
- Johns Hopkins Bloomberg School of Public Health. How COVID-19 created a “watershed” moment for wastewater surveillance. May 13, 2022. Available at: https://publichealth.jhu.edu/2022/how-covid-19-created-a-watershed-momen.... Accessed May 3, 2024.
MeSH terms
Substances
LinkOut - more resources
Full Text Sources
Medical
Miscellaneous
