. 2024 Sep:75:103301.
doi: 10.1016/j.redox.2024.103301. Epub 2024 Aug 5.

TDP-43 dysfunction leads to bioenergetic failure and lipid metabolic rewiring in human cells

Affiliations

TDP-43 dysfunction leads to bioenergetic failure and lipid metabolic rewiring in human cells

Miriam Ceron-Codorniu et al. Redox Biol. 2024 Sep.

Abstract

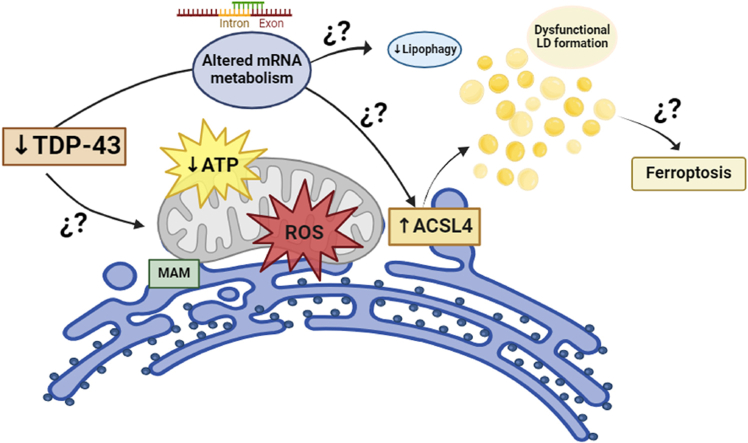
The dysfunction of TAR DNA-binding protein 43 (TDP-43) is implicated in various neurodegenerative diseases, though the specific contributions of its toxic gain-of-function versus loss-of-function effects remain unclear. This study investigates the impact of TARDBP loss on cellular metabolism and viability using human-induced pluripotent stem cell-derived motor neurons and HeLa cells. TARDBP silencing led to reduced metabolic activity and cell growth, accompanied by neurite degeneration and decreased oxygen consumption rates in both cell types. Notably, TARDBP depletion induced a metabolic shift, impairing ATP production, increasing metabolic inflexibility, and elevating free radical production, indicating a critical role for TDP-43 in maintaining cellular bioenergetics. Furthermore, TARDBP loss triggered non-apoptotic cell death, increased ACSL4 expression, and reprogrammed lipid metabolism towards lipid droplet accumulation, while paradoxically enhancing resilience to ferroptosis inducers. Overall, our findings highlight those essential cellular traits such as ATP production, metabolic activity, oxygen consumption, and cell survival are highly dependent on TARDBP function.

Keywords: ACSL4; Amyotrophic lateral sclerosis; Homeostasis; In vitro models; TDP-43.


Conflict of interest statement

Declaration of competing interest To whom it may be of interest. On behalf of all the authors, I hereby confirm that the authors of "Loss of TDP-43 Induces ALS-Related Collapse of Cellular Homeostasis" have not declared or known conflicts of interest. And to confirm that I sign the present in Lleida, at June 4th, 2024.

Figures

Image 1
Graphical abstract
Fig. 1
Fig. 1
TDP-43 loss impairs cellular metabolic activity and VO2. (A) TARDBP and PFKP mRNA, and protein levels of hIPSC-MNs 6 days after transduction with sh-scrambled or sh-TARDBP. For PFKP, the percentage of cryptic exon inclusion is also shown. (B) Morphological changes of hIPSC-MNs 6 days after transduction with sh-scrambled (upper) and sh-TARDBP (lower). (C) Metabolic activity (left); Cell viability (middle); and Neurofilament levels (pg/mL) on supernatants (right) of hIPSC-MNs 6 days after transduction with sh-scrambled or sh-TARDBP. (D) OCR of hIPSC-MNs 15 days after transduction with sh-scrambled or sh-TARDBP. (E) TARDBP mRNA and protein levels of pLKO cells after a time course treatment (doxycycline 200 ng/mL). (F) Morphological changes of pLKO cells untreated (upper) and doxycycline (200 ng/mL) treated (lower). (G) Time course of metabolic activity (left) and cell viability (right) of pLKO cells (doxycycline 200 ng/mL). (H) OCR of pLKO cells un/treated with doxycycline (200 ng/mL) for 240 h. 0: untreated; 200: 200 ng/mL doxycycline. In (A) and (B) differences between sh-Scrambled and sh-TARDBP were analyzed by Student's t-test. In (C) and (G) cells scale bar: 20 μm. In OCR measurements (D) and (H) shadows of profiles indicate a 95 % confidence interval for measured data. In (E) and (F) differences between time points are analyzed by paired one-way ANOVA and Dunnett's-corrected multiple comparisons test. All western-blot analyses were normalized to protein content, measured by densitometric analysis of total protein load by Coomassie Blue staining. *, **, *** and **** indicate, respectively p < 0.05, p < 0.01, p < 0.001, and p < 0.0001. (For interpretation of the references to color in this figure legend, the reader is referred to the Web version of this article.)
Fig. 2
Fig. 2
TARDBP loss causes a shift in mitochondrial metabolism in association with lower proliferative rates. (A) OCR employing the Seahorse™ apparatus, normalized for cell number, of hIPSC-MNs after 6 days transduction with sh-scrambled or sh-TARDBP. Cellular respiration phenotype protocol included three measurements at each stage: 1- Basal respiration; 2-Oligomycin (1.5 μM); 3-FCCP (1.0 μM); 3-Rotenone/Antimycin A (0.5 μM each compound). (B) Energy Map of hIPSC-MNs after 6 days transduction with sh-scrambled or sh-TARDBP. (C) sh-scrambled and sh-TARDBP hIPSC-MNs differences in OCR during basal respiration, ATP-linked respiration, and non-mitochondrial oxygen consumption (D) OCR employing the Seahorse™ apparatus, normalized for cell number, of Wt and pLKO cells treated with doxycycline (200 ng/mL) for 72h. (E) Energy Map of Wt and pLKO cells treated with doxycycline (200 ng/mL) for 72h. (F) Wt and pLKO treated with doxycycline (200 ng/mL) 72h differences in OCR during basal respiration, ATP-linked respiration, and non-mitochondrial oxygen consumption, respectively pLKO values are referred to as incremental or decremental behavior compared with Wt. Differences in the OCR were determined by two-way ANOVA and Sidak's-corrected for multiple comparison tests, with other differences being analyzed by Student's t-test (p < 0.0001). *, **, *** and **** indicate, respectively p < 0.05, p < 0.01, p < 0.001, and p < 0.0001.
Fig. 3
Fig. 3
TARDBP silencing impaired mitochondrial function, with increased ROS production and no major ultrastructural changes. (A) Representative TEM images of mitochondria in pLKO cells un/treated with doxycycline (200 ng/mL) for 72h. Right inset shows amplification of marked square. In TEM micrographs, yellow arrows indicate mitochondria while green arrowheads show images compatible with autophagy vesicles in contact with mitochondria. N: Nuclei, Ld: lipid droplet-compatible structure. (B) Mitochondrial area (per square micrometer) and circularity indexes quantified as indicated in Methods section (n = 30 images per condition quantified). (C) TMRM intensity after flow cytometry analyses. Right panel show percentage of cells and MitotrackerTM fluorescence intensity, showing a cell population with lower mitochondrial potential (marked by an arrow) in pLKO cells after doxycycline (200 ng/mL) exposure for 72h. (D) Representative scatter plot of flow cytometry analysis of pLKO cells un/treated with doxycycline (200 ng/mL) for 72h (left) and MitoSoxTM median intensity (right). (E) Fluorescence microscopy of Wt and pLKO living cells treated with doxycycline (200 ng/mL) for 72h. Nuclei (in blue) were stained with NacBlue™. Superoxide (in red) was estimated with MitoSoxTM. The right panels show the integrated intensity of MitoSoxTM. Scale bar: 20 μm. (F) Representative western-blot (left panels) and densitometry (right panels) of electron transport chain complexes after 72h doxycycline (200 ng/mL) treatment in pLKO cells. In (B), (D) and (E) differences were analyzed by Student's t-test. In (C) and (F) differences were analyzed by two-way ANOVA and Sidak's-corrected multiple comparisons test. All western-blot analyses were normalized to protein content, measured by densitometric analysis of total protein load by Coomassie Blue staining. *, **, *** and **** indicate p<0.05, p<0.01, p<0.001 and 0.0001. (For interpretation of the references to color in this figure legend, the reader is referred to the Web version of this article.)
Fig. 4
Fig. 4
Transfection of TARDBP and Δm1TARDBP rescues mitochondrial phenotypes impinged by TARDBP loss in pLKO cells. (A) TDP-43 protein levels of pLKO cells un/treated with doxycycline (200 ng/mL) 72h and transfected with GFP, wtTARDBP and Δm1TARDBP plasmids.(B) Metabolic activity (left) and cell viability (right) of pLKO cells treated with doxycycline (200 ng/mL) for 72h and transfected with GFP, wtTARDBP and Δm1TARDBP (C) OCR employing the Resipher apparatus of pLKO cells treated with doxycycline (200 ng/mL) 72h and transfected with GFP, wtTARDBP and Δm1 TARDBP plasmids. (D) OCR employing the Seahorse™ apparatus, normalized for cell number, of pLKO cells treated with doxycycline (200 ng/mL) 72h and transfected with GFP, wtTARDBP and Δm1 TARDBP plasmids, as measured in Fig. 2. (E) Energy Map of pLKO cells treated with doxycycline (200 ng/mL) 72h and transfected with GFP, wtTARDBP and Δm1TARDBP plasmids. (F) pLKO treated with doxycycline 200 ng/mL and transfected with GFP, wtTARDBP and Δm1TARDBP plasmids differences in OCR during basal respiration, ATP-linked respiration, and non-mitochondrial oxygen consumption, respectively. In (A) differences are analyzed by two-way ANOVA and Tukey's-corrected multiple comparisons test. In (B) and (C) shadows of profiles indicate a 95 % confidence interval for measured data. In (C), (D), and (F) differences were determined by one-way ANOVA and Sidak's-corrected multiple comparisons tests. Western-blot analyses (A) were normalized to protein content, measured by densitometric analysis of total protein load by Coomassie Blue staining. *, **, *** and **** indicate, respectively p < 0.05, p < 0.01, p < 0.001, and p < 0.0001. (For interpretation of the references to color in this figure legend, the reader is referred to the Web version of this article.)
Fig. 5
Fig. 5
Loss of TARDBP induces an apoptosis-independent cell death in HeLa cells and a build-up of LD. (A) Representative scatter plot of flow cytometry analysis of pLKO cells un/treated with doxycycline (200 ng/mL) 72h (left) and cell death accounting for PI positive cells (right). (B) Representative western-blot (left panels) and densitometry (right panels) of ferroptosis biomarkers after 72h doxycycline (200 ng/mL) treatment in pLKO cells. (C) mRNA levels of selected components of ferroptosis and oxeiptosis after 72h doxycycline (200 ng/mL) treatment in pLKO cells. (D) Metabolic activity (left) and cell viability (right) of pLKO cells after doxycycline (200 ng/mL) addition for 72h and treated with ferroptosis inducers Erastin (50 μM) and RSL-3 (10 μM) or inhibitor Ferrostatin (10 μM) for 24h (E) Fluorescence imaging of pLKO cells un/treated with doxycycline (200 ng/mL) 72h. Nuclei (in blue) were stained with NacBlue™. Neutral lipids (in green) were stained with LipidTOX™. Lipid droplets (in red) were stained with Nile Red. The right panels show the integrated intensity of LipidTOX™ and Nile Red. Scale bar: 20 μm. (F) Total lipids, glycerol and TAG's content analysis in pLKO cells un/treated with doxycycline (200 ng/mL) for 72h. In (A), (B), (E) and (F) differences were analyzed by Student's t-test. In (C) and (D) differences were analyzed by two-way ANOVA and Sidak's-corrected multiple comparisons test. All western-blot analyses were normalized to protein content, measured by densitometric analysis of total protein load by Coomassie Blue staining. *, **, *** and **** indicate p < 0.05, p < 0.01, p < 0.001 and 0.0001. (For interpretation of the references to color in this figure legend, the reader is referred to the Web version of this article.)

References

    1. Robberecht W., Philips T. The changing scene of amyotrophic lateral sclerosis. Nat. Rev. Neurosci. 2013;14(4):248–264. doi: 10.1038/nrn3430. - DOI - PubMed
    1. Mejzini R., Flynn L.L., Pitout I.L., Fletcher S., Wilton S.D., Akkari P.A. ALS Genetics, mechanisms, and therapeutics: where are we now? Front. Neurosci. 2019;13 doi: 10.3389/fnins.2019.01310. Frontiers Media S.A. - DOI - PMC - PubMed
    1. Suk T.R., Rousseaux M.W.C. The role of TDP-43 mislocalization in amyotrophic lateral sclerosis. Mol. Neurodegener. 2020;15(1) doi: 10.1186/s13024-020-00397-1. BioMed Central Ltd. - DOI - PMC - PubMed
    1. Janssens J., Van Broeckhoven C. Pathological mechanisms underlying TDP-43 driven neurodegeneration in FTLD-ALS spectrum disorders. Hum. Mol. Genet. 2013;22(R1) doi: 10.1093/hmg/ddt349. - DOI - PMC - PubMed
    1. Smethurst P., Newcombe J., Troakes C., Simone R., Chen Y.R., Patani R., Sidle K. In vitro prion-like behaviour of TDP-43 in ALS. Neurobiol. Dis. 2016;96:236–247. doi: 10.1016/j.nbd.2016.08.007. - DOI - PMC - PubMed

LinkOut - more resources