. 2024 Sep 5;111(9):1953-1969.
doi: 10.1016/j.ajhg.2024.07.006. Epub 2024 Aug 7.

SMAD4 mutations causing Myhre syndrome are under positive selection in the male germline

Affiliations

SMAD4 mutations causing Myhre syndrome are under positive selection in the male germline

Katherine A Wood et al. Am J Hum Genet. .

Abstract

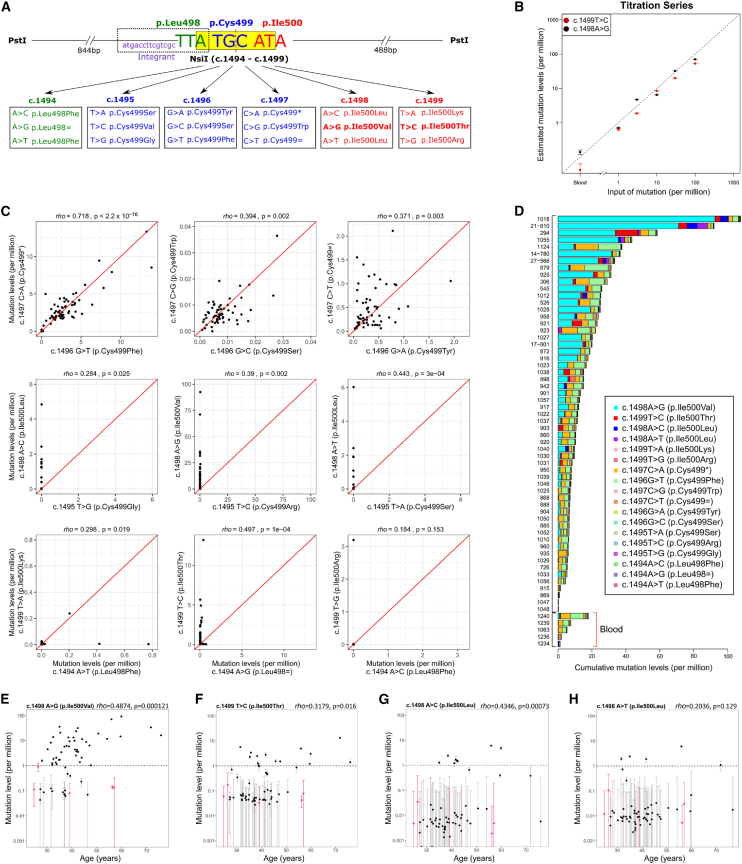
While it is widely thought that de novo mutations (DNMs) occur randomly, we previously showed that some DNMs are enriched because they are positively selected in the testes of aging men. These "selfish" mutations cause disorders with a shared presentation of features, including exclusive paternal origin, significant increase of the father's age, and high apparent germline mutation rate. To date, all known selfish mutations cluster within the components of the RTK-RAS-MAPK signaling pathway, a critical modulator of testicular homeostasis. Here, we demonstrate the selfish nature of the SMAD4 DNMs causing Myhre syndrome (MYHRS). By analyzing 16 informative trios, we show that MYHRS-causing DNMs originated on the paternally derived allele in all cases. We document a statistically significant epidemiological paternal age effect of 6.3 years excess for fathers of MYHRS probands. We developed an ultra-sensitive assay to quantify spontaneous MYHRS-causing SMAD4 variants in sperm and show that pathogenic variants at codon 500 are found at elevated level in sperm of most men and exhibit a strong positive correlation with donor's age, indicative of a high apparent germline mutation rate. Finally, we performed in vitro assays to validate the peculiar functional behavior of the clonally selected DNMs and explored the basis of the pathophysiology of the different SMAD4 sperm-enriched variants. Taken together, these data provide compelling evidence that SMAD4, a gene operating outside the canonical RAS-MAPK signaling pathway, is associated with selfish spermatogonial selection and raises the possibility that other genes/pathways are under positive selection in the aging human testis.

Keywords: TGF-β/BMP/activin pathway; de novo mutation; paternal age effect; rare disorder; selfish selection; spermatogonial stem cell.


Conflict of interest statement

Declaration of interests The authors declare no competing interests.

Figures

Figure 1
Figure 1
Paternal age effect for de novo MYHRS-causing SMAD4 mutations Distribution of the observed difference between the ages of fathers (n = 35) of MYHRS-affected individuals and year-matched USA population average (pooled in 3-year bins). The shift to the right side of the figure illustrates the paternal age excess. The specific SMAD4 mutation identified in the proband is denoted according to the color chart indicating the MYHRS variant and predicted amino acid change. The maternal age effect for these families is shown in Figure S5A.
Figure 2
Figure 2
NsiI restriction enzyme digestion (RED)-PCR assay for enrichment of spontaneous MYHRS-associated SMAD4 mutations (A) SMAD4 sequence context around codon 500 (red), which encompasses an NsiI restriction site (yellow box—note the palindromic nature of the site, indicated by the dotted red line). PstI digestion releases a 1,332 bp gDNAfragment and wild-type sequences are also digested with NsiI to generate two smaller fragments (844 and 488 bp) (Figure S1). All nucleotide substitutions (and corresponding amino acid changes) resistant to NsiI digestion are indicated and are color coded according to the amino acid involved. The two known MYHRS-causing mutations that can be enriched by this strategy are indicated in bold. The CRISPR-edited Integrant clone, a 17 bp (c.1478_1494del) heterozygous deletion (in purple within the dotted rectangle), is also resistant to NsiI digestion. (B) Mutation levels estimated in a titration-reconstruction assay with serial dilutions of two gDNA from MYHRS-affected individuals with the p.Ile500Thr (red) or p.Ile500Val (black) variant (as indicated on the figure) mixed with blood carrier gDNA and the Integrant DNA. Values plotted are means of two technical replicates and error bars represent 95% binomial confidence intervals (CIs) (see Table S3). (C) Comparison of the mutation levels (per million) in sperm samples for the equivalent (i.e., reciprocal) substitutions within the palindromic NsiI site (ATG|CAT)—note that for the top row (and in particular the top left panel), the c.1497C substitution levels within individual samples correlate significantly with the levels of their cognate c.1496G change. This pattern is best explained by the DNA substitutions occurring through a passive process, such as oxidative damage. By contrast for the other substitutions (middle and bottom rows), the relationships between equivalent substitutions are different, with mutation levels of reciprocal/cognate substitutions not correlating with one another. Note the variable range of the axes that have been adjusted to reflect the levels of the highest measurements. (D) Cumulative mutation levels for the 18 different substitutions enriched by the NsiI RED-PCR assay (see color chart) observed in sperm (top) and blood (bottom) samples. Mutations encoding the p.Ile500Val, p.Ileu500Thr, and p.Ileu500Leu changes dominate the landscape, while the c.1496C>A and its cognate c.1497G>T variant are found in similar proportions. Individual plots are presented in Figure S7. (E–H) Mutation levels of four apparently selected variants at Ile500 (c.1498A>G [p.Ile500Val], c.1499T>C [p.Ile500Thr], and c.1498A>C and A>T which both encode p.Ile500Leu) plotted against the age of the donors on a log10 scale. The dotted line represents the 10−6 limit of detection of the RED-PCR assay. Blood (red) and sperm (black) samples are plotted as the mean of three independent technical replicates and their 95% binomial CI.
Figure 3
Figure 3
Functional characterization of the sperm-enriched SMAD4 variants (A) Transcriptional activity (assessed by luciferase assay using SBE3 binding site in HEK293T cells) of wild-type (WT) and enriched SMAD4 protein mutants, as indicated on the figure. The graph bars represent mean ± SEM and values of 3 individual replicates are indicated as white circles. (B) Protein levels and stability of SMAD4 mutants. Immunoblot analysis shows WT and variant HA-tagged SMAD4 protein levels in transfected HEK293T cells, basally and after cycloheximide (CHX) treatment. GAPDH was used as loading control. Representative blots (below) and mean ± SEM densitometry values (above) of three independent experiments are shown. Asterisks indicate statistically significant differences compared to the WT SMAD4 (∗∗∗p ≤ 0.001; ∗∗p ≤ 0.05; two-way ANOVA followed by Dunnett’s multiple comparison test). (C and D) Serum-stimulated phospho-ERK (pERK) assay. Representative blots (below) and graphs reporting mean ± SEM densitometry values (above) of at least three independent experiments are shown. HEK293T cells were transiently transfected with the indicated HA-tagged SMAD4 or V5-tagged LZTR1 construct, serum starved (16 h), and stimulated with FBS (C) or TGF-β1 (D), in time-course experiments or left untreated. Equal amounts of total proteins from each cell lysate were resolved on 10% polyacrylamide gels. Asterisks indicate statistically significant differences in the phosphorylation levels compared to cells transfected with empty vector at the corresponding experimental points (∗∗p < 0.01; p < 0.05; two-way ANOVA followed by Dunnett’s multiple comparison test).

References

    1. Kong A., Frigge M.L., Masson G., Besenbacher S., Sulem P., Magnusson G., Gudjonsson S.A., Sigurdsson A., Jonasdottir A., Jonasdottir A., et al. Rate of de novo mutations and the importance of father’s age to disease risk. Nature. 2012;488:471–475. doi: 10.1038/nature11396. - DOI - PMC - PubMed
    1. Rahbari R., Wuster A., Lindsay S.J., Hardwick R.J., Alexandrov L.B., Al Turki S., Dominiczak A., Morris A., Porteous D., Smith B., et al. Timing, rates and spectra of human germline mutation. Nat. Genet. 2016;48:126–133. doi: 10.1038/ng.3469. - DOI - PMC - PubMed
    1. Goldmann J.M., Wong W.S., Pinelli M., Farrah T., Bodian D., Stittrich A.B., Glusman G., Vissers L.E., Hoischen A., Roach J.C., et al. Parent-of-origin-specific signatures of de novo mutations. Nat. Genet. 2016;48:935–939. doi: 10.1038/ng.3597. - DOI - PubMed
    1. Wood K.A., Goriely A. The impact of paternal age on new mutations and disease in the next generation. Fertil. Steril. 2022;118:1001–1012. doi: 10.1016/j.fertnstert.2022.10.017. - DOI - PMC - PubMed
    1. Sasani T.A., Pedersen B.S., Gao Z., Baird L., Przeworski M., Jorde L.B., Quinlan A.R. Large, three-generation human families reveal post-zygotic mosaicism and variability in germline mutation accumulation. Elife. 2019;8 doi: 10.7554/eLife.46922. - DOI - PMC - PubMed

Supplementary concepts

LinkOut - more resources