. 2024 Aug 21;15(8):753-769.e5.
doi: 10.1016/j.cels.2024.07.001. Epub 2024 Aug 7.

PanIN and CAF transitions in pancreatic carcinogenesis revealed with spatial data integration

Affiliations

PanIN and CAF transitions in pancreatic carcinogenesis revealed with spatial data integration

Alexander T F Bell et al. Cell Syst. .

Abstract

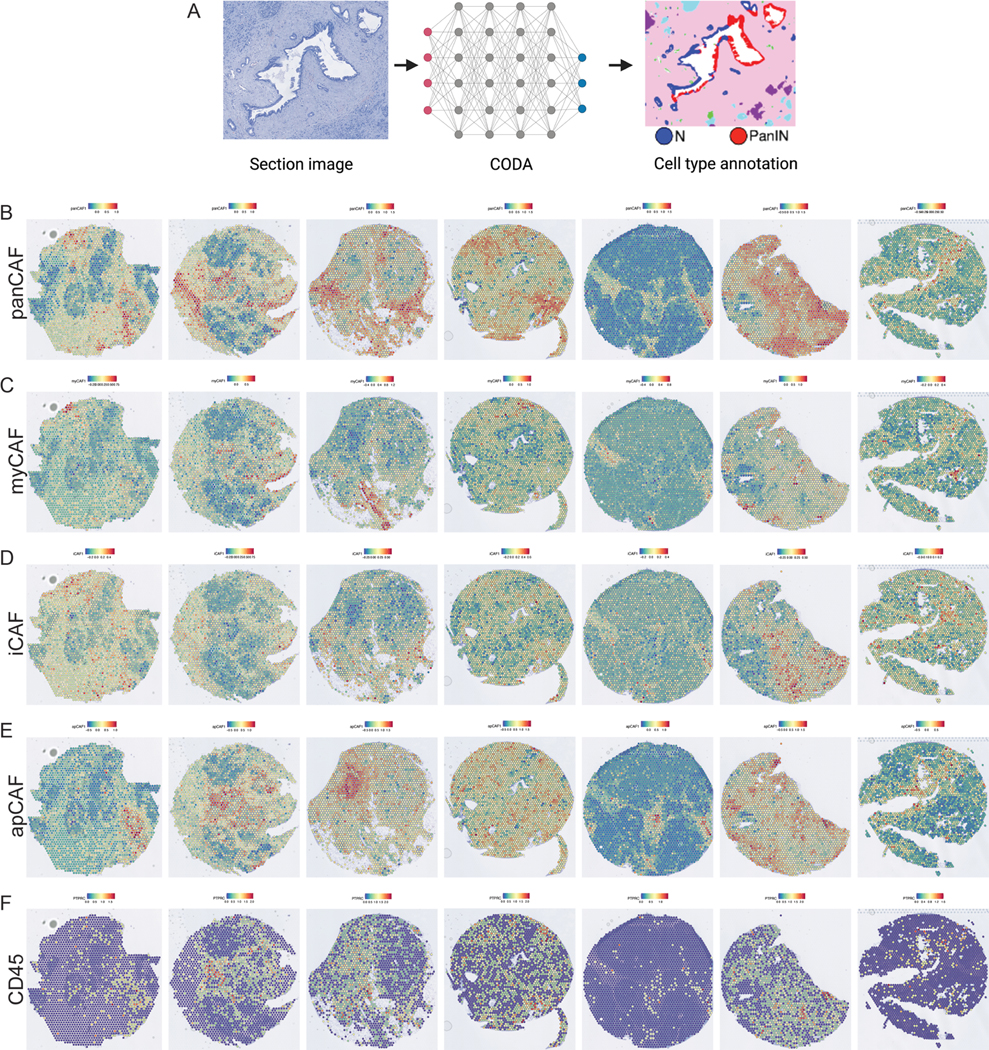
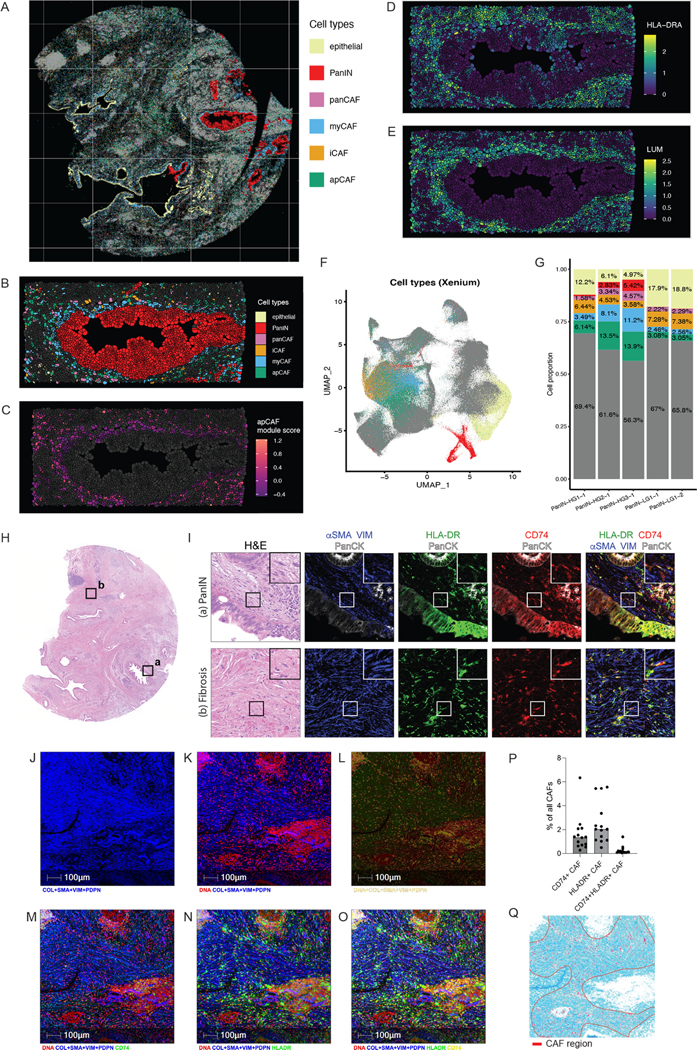
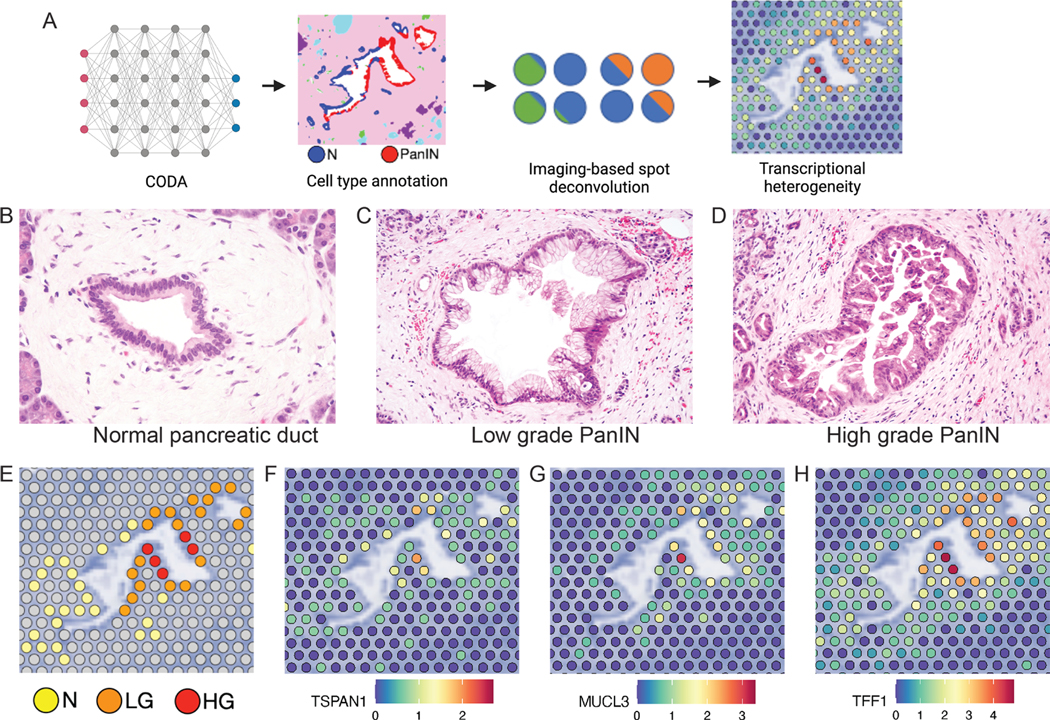
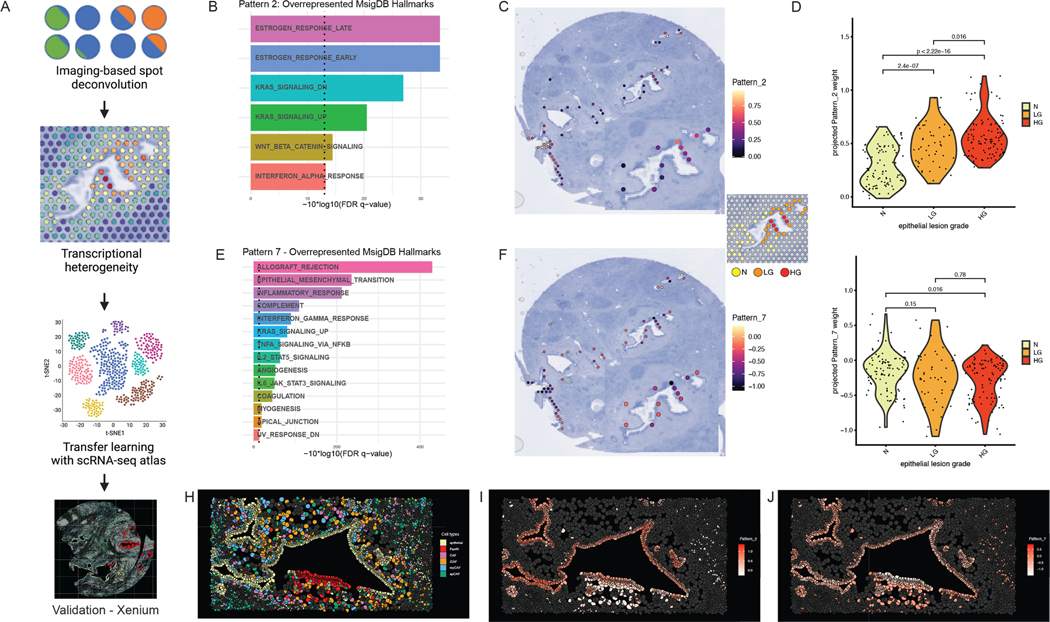
This study introduces a new imaging, spatial transcriptomics (ST), and single-cell RNA-sequencing integration pipeline to characterize neoplastic cell state transitions during tumorigenesis. We applied a semi-supervised analysis pipeline to examine premalignant pancreatic intraepithelial neoplasias (PanINs) that can develop into pancreatic ductal adenocarcinoma (PDAC). Their strict diagnosis on formalin-fixed and paraffin-embedded (FFPE) samples limited the single-cell characterization of human PanINs within their microenvironment. We leverage whole transcriptome FFPE ST to enable the study of a rare cohort of matched low-grade (LG) and high-grade (HG) PanIN lesions to track progression and map cellular phenotypes relative to single-cell PDAC datasets. We demonstrate that cancer-associated fibroblasts (CAFs), including antigen-presenting CAFs, are located close to PanINs. We further observed a transition from CAF-related inflammatory signaling to cellular proliferation during PanIN progression. We validate these findings with single-cell high-dimensional imaging proteomics and transcriptomics technologies. Altogether, our semi-supervised learning framework for spatial multi-omics has broad applicability across cancer types to decipher the spatiotemporal dynamics of carcinogenesis.

Keywords: Visium; Xenium; imaging mass cytometry; machine learning; multi-omics; pancreatic adenocarcinoma; pancreatic intraepithelial neoplasia; spatial transcriptomics; transfer learning.


Conflict of interest statement

Declaration of interests E.M.J. reports other support from Abmeta; personal fees from Genocea; personal fees from Achilles; personal fees from DragonFly; personal fees from Candel Therapeutics; other support from the Parker Institute; grants and other support from Lustgarten; personal fees from Carta; grants and other support from Genentech; grants and other support from AstraZeneca; personal fees from NextCure; and grants and other support from Break Through Cancer outside of the submitted work. E.J.F. is on the Scientific Advisory Board of Viosera Therapeutics/Resistance Bio and is a consultant to Mestag Therapeutics. W.J.H. reports patent royalties from Rodeo/Amgen and speaking/travel honoraria from Exelixis and Standard BioTools.

Figures

FIGURE 1 –
FIGURE 1 –
Spatial transcriptomics (ST) analysis of FFPE pancreatic intraepithelial neoplasia (PanIN). (A) Pancreatic cancer surgical specimens in FFPE were examined and the regions containing PanIN lesions were identified for scoring using a 5mm skin biopsy punch and sectioning onto the spatial transcriptomics slide. The stained images were used for machine learning analysis for cell type identification and spatial spots deconvolution. The ST analysis was integrated with an invasive cancer single-cell dataset. The findings were validated with single-cell resolved transcriptomics and proteomics. (B) Discovery cohort stained sections were used for pathology examination and identification of PanINs and other pancreatic histological regions. (C) The unsupervised clustering of the spatial transcriptomics data identified gene expression clusters which location resembles the distribution observed in the stained sections. (D) Cell types indicated in the legend were defined automatically from cellular morphologies of the stained sections using the machine learning approach CODA, thereby refining cellular annotations obtained from clustering alone.
FIGURE 2 –
FIGURE 2 –
Spatial distribution of PDAC cancer associated fibroblasts (CAF) subtypes in the discovery cohort. (A) CAFs localization was mapped using pan-CAF markers, (B) myofibroblastic-CAF markers, (C) inflammatory-CAF markers and (D) antigen presenting-CAF markers. (E) CD45 expression was examined to identify regions where CAFs and immune cells were co-localized.
FIGURE 3 –
FIGURE 3 –
Confirmation of apCAF population using single-cell transcriptomics and proteomics. (A) Xenium clusters spatial distribution from a panel to detect 380 genes recapitulate the sample (PanIN-HG3) architecture. Cells identified as epithelial cells (yellow), PanIN (red), and CAF subtypes apCAF (green), iCAF (orange), and myCAF (blue) are highlighted. (B) The HG PanIN is surrounded by a heterogeneous population of cells, including apCAFs. The apCAFs were identified based a pan-CAF module score, absence of CD45 (PTPRC) expression and elevated module scores for marker genes of apCAFs. (C) The apCAFs were annotated as cells with high apCAF signature module score. (D) and (E) Expression of the CAF markers LUM (F) and the MHC II gene HLA-DRA co-localize with regions of apCAF high module scores. (F) UMAP representing epithelial, PanIN, panCAF, myCAF, iCAF and apCAF across the three samples analyzed with Xenium. (G) Percent composition of cell types in each sample that was profiled with Xenium. (H) Representative image of the pancreas with pancreatic intraepithelial neoplasia (PanIN) and fibrosis. Regions with PanIN (a) and fibrosis (b) are highlighted. (I) Representative images of the pancreas with PanIN (top row) and fibrosis (bottom row). H&E and image mass cytometry images of SMA and vimentin (VIM, blue), HLA-DR (green), CD74 (red), and pancytokeratin (PanCK, white) are shown. (J) CAF detection in the IMC regions of interest was quantified by the expression of panCAF markers (COL, SMA, VIM, PDPN). (K) and (L) DNA presence was used to exclude areas of collagen only from CAFs. (M) CD74 expression, (N) HLADR expression and (O) CD74 and HLADR concomitant expression identified the apCAFs. (P) Proportion of apCAFs among the CAFs detected within the multiple regions of interested profiled. (Q) Area enriched for CAFs (marked in red) used to measure the frequency of apCAFs, excluding immune rich regions.
FIGURE 4 –
FIGURE 4 –
Pancreatic intraepithelial neoplasia (PanINs) transcriptional features. (A) Six out of seven PanINs (black circles), expressed markers that characterize the classical subtype of pancreatic cancer, while (B) the basal-like signature was not expressed by any of the premalignant lesions. (C) The only sample that is neither classical nor basal-like expresses cancer stem cell (CSC) markers. (D) Differential expression analysis identified genes which up-regulation (blue dots) or down-regulation (red dots) in PanINs, relative to normal ducts, discriminate preneoplastic from normal cells (E).
FIGURE 5 –
FIGURE 5 –
Identification of transcriptional changes associated with pancreatic intraepithelial neoplasia (PanIN) differentiation grade. (A) Workflow of CODA annotations to facilitate heterogeneity detection. (B) Normal ducts, (C) low grade (LG) and (D) high grade (HG) PanINs are morphologically distinct and can be classified by pathology examination. (E) As a model for PanIN progression, a mixed pancreatic duct containing normal, LG and HG cells was used to better visualize changes in expression. Top genes from the differential expression analysis, (F) MUCL3, (G) TSPAN1 and (H) TFF1, show gradual increase from normal through LG until HG progression.
FIGURE 6 –
FIGURE 6 –
Integration of pancreatic intraepithelial neoplasia (PanIN) spatial transcriptomics (ST) data with invasive pancreatic cancer single-cell RNA-sequencing (scRNA-seq) using transfer learning. (A) The deconvolved ST data, after CODA annotation and quantification of cell types per spot, was used to integrate PanIN analysis with that of scRNA-seq from human PDAC and subsequent validation with Xenium. (B) and (C) The PDAC Patterns 2 (proliferation) and 7 (inflammatory) identified as highly expressed in PDAC cells from the atlas. (D) and (E) The PDAC Pattern 2 shows gradual increase from normal ductal cells, through LG to HG PanINs. (F) and (G) The opposite is observed with Pattern 7 (inflammatory), that decreases in PanINs relative to normal cells. (H) In the Xenium data, the visualization of a mixed duct (normal + PanIN) highlights the trend between the PDAC patterns. (I) The projection of PDAC Pattern 2 in the mixed duct and of the (J) PDAC Pattern 7, confirmed the expression of both patterns using single-cell transcriptomics with RNA in situ hybridization and the switch of cells that express one pattern or the other.

References

    1. Lim B, Lin Y, and Navin N. (2020). Advancing Cancer Research and Medicine with Single-Cell Genomics. Cancer Cell 37, 456–470. 10.1016/j.ccell.2020.03.008. - DOI - PMC - PubMed
    1. Davis-Marcisak EF, Deshpande A, Stein-O’Brien GL, Ho WJ, Laheru D, Jaffee EM, Fertig EJ, and Kagohara LT (2021). From bench to bedside: Single-cell analysis for cancer immunotherapy. Cancer Cell 39, 1062–1080. 10.1016/j.ccell.2021.07.004. - DOI - PMC - PubMed
    1. Peng J, Sun B-F, Chen C-Y, Zhou J-Y, Chen Y-S, Chen H, Liu L, Huang D, Jiang J, Cui G-S, et al. (2019). Single-cell RNA-seq highlights intra-tumoral heterogeneity and malignant progression in pancreatic ductal adenocarcinoma. Cell Res. 29, 725–738. 10.1038/s41422-019-0195-y. - DOI - PMC - PubMed
    1. Steele NG, Carpenter ES, Kemp SB, Sirihorachai VR, The S, Delrosario L, Lazarus J, Amir E-AD, Gunchick V, Espinoza C, et al. (2020). Multimodal mapping of the tumor and peripheral blood immune landscape in human pancreatic cancer. Nat. Cancer 1, 1097–1112. 10.1038/s43018-020-00121-4. - DOI - PMC - PubMed
    1. Lin W, Noel P, Borazanci EH, Lee J, Amini A, Han IW, Heo JS, Jameson GS, Fraser C, Steinbach M, et al. (2020). Single-cell transcriptome analysis of tumor and stromal compartments of pancreatic ductal adenocarcinoma primary tumors and metastatic lesions. Genome Med. 12, 80. 10.1186/s13073-020-00776-9. - DOI - PMC - PubMed

MeSH terms

LinkOut - more resources