. 2024 Oct 9;44(41):e0602242024.
doi: 10.1523/JNEUROSCI.0602-24.2024.

Striatal Serotonin Release Signals Reward Value

Affiliations

Striatal Serotonin Release Signals Reward Value

Mitchell G Spring et al. J Neurosci. .

Abstract

Serotonin modulates diverse phenotypes and functions including depressive, aggressive, impulsive, and feeding behaviors, all of which have reward-related components. To date, research has focused on understanding these effects by measuring and manipulating dorsal raphe serotonin neurons and using single-receptor approaches. These studies have led to a better understanding of the heterogeneity of serotonin actions on behavior; however, they leave open many questions about the timing and location of serotonin's actions modulating the neural circuits that drive these behaviors. Recent advances in genetically encoded fluorescent biosensors, including the GPCR activation-based sensor for serotonin (GRAB-5-HT), enable the measurement of serotonin release in mice on a timescale compatible with a single rewarding event without corelease confounds. Given substantial evidence from slice electrophysiology experiments showing that serotonin influences neural activity of the striatal circuitry, and the known role of the dorsal medial striatal (DMS) in reward-directed behavior, we focused on understanding the parameters and timing that govern serotonin release in the DMS in the context of reward consumption, external reward value, internal state, and cued reward. Overall, we found that serotonin release is associated with each of these and encodes reward anticipation, value, approach, and consumption in the DMS.

Keywords: GRAB-5-HT; dorsal striatum; pavlovian conditioned approach; reward; serotonin; value.


Conflict of interest statement

The authors declare no competing financial interests.

Figures

Figure 1.
Figure 1.
Serotonin release in the DMS precedes reward consumption. A, Fiber placements from mice from GRAB-5-HT recordings are shown by an x for each animal included in the analysis. All markers are displayed on one hemisphere on the coronal brain plates for illustrative purposes, but fiber placements were counterbalanced across hemispheres. B, A representative image shows the fiber track and GRAB-5-HT expression. C, The z-scored GRAB-5-HT fluorescence signal is shown for 10 mice with each row representing a single trial aligned to the shutter opening (triangle) and sorted by latency to first lick. The onset of licking in each trial is indicated by a black dot overlaying the signal. D, The trial-averaged z-scored GRAB-5-HT fluorescence signal is shown averaged over all trials across all mice, aligned to the first lick of each trial. The 5 s period of reward availability is shown in gray. Inset shows individual mice (lines) and group averages for the AUCs for baseline and reward period epochs. E, The trial-averaged z-scored GRAB 5-HT fluorescence signal is shown averaged over trials separated by latencies to lick of shorter or longer than 5 s, and aligned to shutter opening. Gray shading indicates where licking may be occurring depending on the given latency greater than 5 s for each trial. Inset shows individual mice and group averages for AUCs of baseline and postshutter periods for the short and long latency trials. F, For every trial, the latency to begin licking is plotted against the timing of the signal peak following shutter open. G, For each trial for all animals, the latency to begin licking is plotted against the rise time-to-postlick peak of the signal during that trial, showing signal rise times tend to be shorter than behavioral latency. Sex differences in licking (H) and GRAB-5-HT signal (I) are shown between males and females with insets displaying the area under the curve during the licking epoch (gray shading).
Figure 2.
Figure 2.
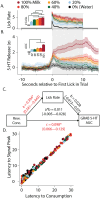
Serotonin levels in the DMS encode reward value. A, Behaviorally, lick rate increases with increasing reward concentration. The bar graph inset shows the group average of number of licks directed toward each concentration over all trials in all animals. B, The lick aligned GRAB-5-HT signal is shown for each reward concentration with the bar graph inset showing the group averages of the area under the curve during the 10 s consumption period for each concentration, C, A mediation analysis found independent, significant influences of reward concentration on both lick rate and GRAB-5-HT signal (significance indicated in red) and no evidence that lick rate could explain the correlation between reward concentration and serotonin release. D, The latency to consume reward (in seconds) is plotted against the latency to the peak signal (in seconds) across all concentrations of reward from all trials.
Figure 3.
Figure 3.
Transient-based analysis of DMS serotonin signal identifies serotonin signals are preferentially related to reward. A, Example traces demonstrating transient identification and categorization. Algorithmically identified transients were categorized as lick-overlapping (red) or not (gray). Histograms display the distribution of transient durations (B) and magnitude (C) for lick-overlapping (red) and nonoverlapping (gray) transients. D, The proportion of transients that overlap licking is shown for observed (top) and shuffled (bottom) data, showing a significantly higher than chance overlap of 5-HT transients with licking. The distribution of the duration (E) and magnitude (F) of 5-HT transients that occurred during consumption of each concentration of reward (red, orange, yellow, green, blue) are shown in comparison with the transients that occurred during water consumption (black) or in the absence of any consumption (gray) while both metrics are positively skewed for transients that overlap multiple concentrations of milk.
Figure 4.
Figure 4.
Internal state influences reward-related serotonin release in the DMS. A, Consumption of water and 100% milk under water-restricted and food-restricted conditions. B, The area under the curve of the GRAB-5-HT signal is shown during consumption of water or evaporated milk for mice under water-restricted or food-restricted conditions. C, The amount of water consumed is plotted against the area under the curve of GRAB-5-HT signal during consumption in both food (black dots) and water (white dots) restriction conditions. Dashed line indicates line of best fit for data points in the water restriction condition. D, Preference index of the prefed flavor from both baseline and devaluation days are shown. E, Difference score for the GRAB-5-HT signal during consumption of the pre-fed flavor relative to the control flavor is shown for both baseline and devaluation conditions. F, GRAB-5-HT difference score is plotted against the change in preference from baseline to devaluation day.
Figure 5.
Figure 5.
DMS serotonin increases during conditioned approach. A, Animals were trained for 10 d in a pavlovian conditioning paradigm beginning 4 weeks after surgery with GRAB-5-HT signal recorded on Day 1 (early training) and Day 10 (late training). B, The trial structure of the auditory pavlovian conditioned approach paradigm is shown. White noise and pure tones were presented as 8 s auditory cues before delivery of evaporated milk reward (CS+; green lines in all subsequent panels) or no reward (CS−; gray lines in all subsequent panels) and counterbalanced across animals. C, Behavioral approach is shown as the time spent at the reward port during CS+ versus CS− presentations after training during early (top panels) and late (bottom panels) training. D, Averages across cue and reward periods in early and late training are shown for individual animals (dots) and group averages (bars). E, GRAB-5-HT signal is shown for CS+ (green) and CS− (gray) trials during early (top panels) and late (bottom panels) training. F, AUCs for the GRAB-5-HT signal are shown for individual mice (dots) and as group averages (bars) during cue and reward periods in early and late training. G, The association between behavioral approach is plotted against GRAB-5-HT signal during the cue period for each mouse's average across CS+ (green) and CS− (gray) trials during early and late training.

References

    1. Agnati LF, Zoli M, Strömberg I, Fuxe K (1995) Intercellular communication in the brain: wiring versus volume transmission. Neuroscience 69:711–726. 10.1016/0306-4522(95)00308-6 - DOI - PubMed
    1. Blomeley CP, Bracci E (2009) Serotonin excites fast-spiking interneurons in the striatum. Eur J Neurosci 29:1604–1614. 10.1111/j.1460-9568.2009.06725.x - DOI - PMC - PubMed
    1. Bromberg-Martin ES, Hikosaka O, Nakamura K (2010) Coding of task reward value in the dorsal raphe nucleus. J Neurosci 30:6262–6272. 10.1523/JNEUROSCI.0015-10.2010 - DOI - PMC - PubMed
    1. Brown HD, Mccutcheon JE, Cone JJ, Ragozzino ME, Roitman MF (2011) Primary food reward and reward-predictive stimuli evoke different patterns of phasic dopamine signaling throughout the striatum. Eur J Neurosci 34:1997–2006. 10.1111/j.1460-9568.2011.07914.x - DOI - PMC - PubMed
    1. Burke DA, Alvarez VA (2022) Serotonin receptors contribute to dopamine depression of lateral inhibition in the nucleus accumbens. Cell Rep 39:110795. 10.1016/j.celrep.2022.110795 - DOI - PMC - PubMed

LinkOut - more resources