Characteristic of Paraspinal Muscle Change in Coronal Sub-type of Degenerative Lumbar Scoliosis and its Potential Clinical Significance
- PMID: 39117580
- PMCID: PMC11541118
- DOI: 10.1111/os.14185
Characteristic of Paraspinal Muscle Change in Coronal Sub-type of Degenerative Lumbar Scoliosis and its Potential Clinical Significance
Abstract
Objective: Clarifying paraspinal muscle (PM) change in degenerative lumbar scoliosis (DLS) is positive to evaluate the progression of scoliosis. This research compares the characteristic of PM change among different coronal sub-types of DLS and explores its potential clinical significance.
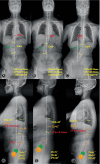
Methods: A total of 84 DLS patients between June 2019 to December 2021 were retrospectively analyzed. Patients were classified into three types based on the coronal balance distance (CBD): Type A, CBD <3 cm; Type B: C7 Plumb Line (C7PL) shifted to the concave side of the curve, and CBD >3 cm; Type C: C7PL shifted to the convex side of the curve, and CBD >3 cm. Fat infiltration rates in the multifidus (MS) and erector spinae (ES) at the apex of the main and fractional curves, and spinopelvic parameters were analyzed statistically. Pearson's or Spearman's correlation was applied to analyze the correlation between asymmetric degree of PM change and these parameters in three types.
Results: There were 62 cases with coronal sub-Type A, 6 cases with Type B, and 16 cases with Type C. Patients in Type B and C demonstrated higher fat infiltration in MS on the concave side of both the main and fractional curves when compared to those in Type A. The asymmetric degree of ES change was positively correlated with CBD at the apex of the main curve in Type B and at the apex of the fractional curve in Type C respectively, and that of MS was positively correlated with apical vertebral rotation, while negatively strong-correlated with pelvic incidence and sacral slope in Type C.
Conclusion: PM fatty infiltration presented difference among varied coronal sub-types of DLS patients. The CBD in Type B and C patients was correlated with the asymmetric degree of ES change.
Keywords: Asymmetric degree; Bony structural parameters; Degenerative Lumbar scoliosis; Fat infiltration; Paraspinal muscle.
© 2024 The Author(s). Orthopaedic Surgery published by Tianjin Hospital and John Wiley & Sons Australia, Ltd.
Conflict of interest statement
The authors declare no competing interests.
Figures


Similar articles
-
Correlation between multifidus muscle atrophy, spinopelvic parameters, and severity of deformity in patients with adult degenerative scoliosis: the parallelogram effect of LMA on the diagonal through the apical vertebra.J Orthop Surg Res. 2019 Aug 28;14(1):276. doi: 10.1186/s13018-019-1323-6. J Orthop Surg Res. 2019. PMID: 31455401 Free PMC article.
-
The Effect of Paraspinal Muscle Degeneration on Distal Pedicle Screw Loosening Following Corrective Surgery for Degenerative Lumbar Scoliosis.Spine (Phila Pa 1976). 2020 May 1;45(9):590-598. doi: 10.1097/BRS.0000000000003336. Spine (Phila Pa 1976). 2020. PMID: 31770334
-
[Clinical application of a classification based on crucial curvature of coronal imbalance in degenerative lumbar scoliosis].Zhonghua Yi Xue Za Zhi. 2023 Apr 18;103(15):1119-1126. doi: 10.3760/cma.j.cn112137-20220911-01920. Zhonghua Yi Xue Za Zhi. 2023. PMID: 37055229 Chinese.
-
Abnormal change of paravertebral muscle in adult degenerative scoliosis and its association with bony structural parameters.Eur Spine J. 2019 Jul;28(7):1626-1637. doi: 10.1007/s00586-019-05958-7. Epub 2019 Mar 21. Eur Spine J. 2019. PMID: 30900094
-
Paravertebral Muscle Degeneration Affects Coronal Balance in Patients with Degenerative Lumbar Scoliosis.World Neurosurg. 2025 Mar;195:123644. doi: 10.1016/j.wneu.2024.123644. Epub 2025 Feb 1. World Neurosurg. 2025. PMID: 39756542
Cited by
-
Extent of fatty infiltration in lumbar paraspinal muscles in adults with degenerative scoliosis: segmental differences in muscle involvement.Eur Spine J. 2025 Jul 21. doi: 10.1007/s00586-025-09165-5. Online ahead of print. Eur Spine J. 2025. PMID: 40689985
References
-
- Kelly A, Younus A, Lekgwara P. Adult degenerative scoliosis‐a literature review. Interdiscip Neurosurg. 2020;20:100661. 10.1016/j.inat.2019.100661 - DOI
MeSH terms
Grants and funding
LinkOut - more resources
Full Text Sources
Medical
Miscellaneous

