. 2024 Aug 8;15(1):6748.
doi: 10.1038/s41467-024-50848-2.

Seed longevity is controlled by metacaspases

Affiliations

Seed longevity is controlled by metacaspases

Chen Liu et al. Nat Commun. .

Abstract

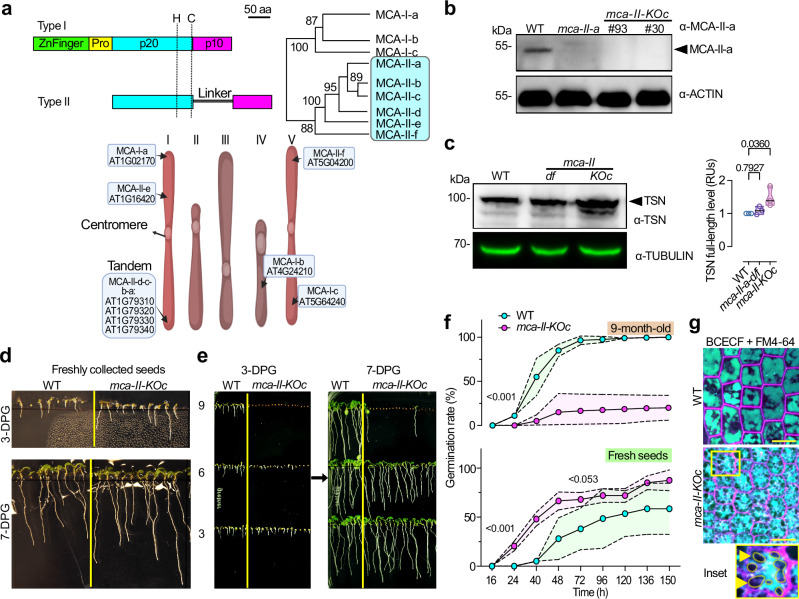
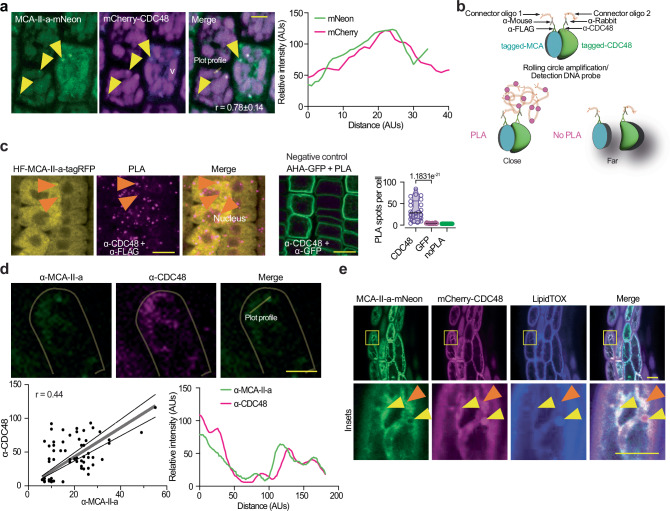
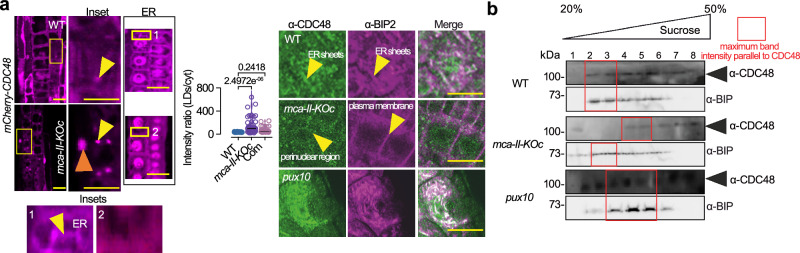
To survive extreme desiccation, seeds enter a period of quiescence that can last millennia. Seed quiescence involves the accumulation of protective storage proteins and lipids through unknown adjustments in protein homeostasis (proteostasis). Here, we show that mutation of all six type-II metacaspase (MCA-II) proteases in Arabidopsis thaliana disturbs proteostasis in seeds. MCA-II mutant seeds fail to restrict the AAA ATPase CELL DIVISION CYCLE 48 (CDC48) at the endoplasmic reticulum to discard misfolded proteins, compromising seed storability. Endoplasmic reticulum (ER) localization of CDC48 relies on the MCA-IIs-dependent cleavage of PUX10 (ubiquitination regulatory X domain-containing 10), the adaptor protein responsible for titrating CDC48 to lipid droplets. PUX10 cleavage enables the shuttling of CDC48 between lipid droplets and the ER, providing an important regulatory mechanism sustaining spatiotemporal proteolysis, lipid droplet dynamics, and protein homeostasis. In turn, the removal of the PUX10 adaptor in MCA-II mutant seeds partially restores proteostasis, CDC48 localization, and lipid droplet dynamics prolonging seed lifespan. Taken together, we uncover a proteolytic module conferring seed longevity.


Conflict of interest statement

The authors declare no competing interests.

Figures

Fig. 1
Fig. 1. A type II MCA depletion model affects seed physiology and vacuolar morphology.
a Schematic diagram of MCAs (top left) and phylogeny of type I and II MCAs (top right) in Arabidopsis and the nomenclature used. Bottom cartoon, chromosomal locations MCAs in the 5 chromosomes. Pro, prodomain; p20 and p10, large and small subunits; H, C, catalytic histidine-cysteine dyad. b Representative immunoblot probed with α-MCA-II-a from seedlings of the mca-II-a mutant and the mca-II-KOc (lines #93 and #30) at 7 days post germination (DPG). α-ACTIN was used as a loading control; the black arrowhead indicates MCA-II-a band (biological replicates N = 3, n = 1 technical replicate with 20 seedlings per lane). c Immunoblot probed with α-TSN from WT, mca-II-df double mutant (background used to generate the CRISPR mutants), and mca-II-KOc mutant seedlings. α-TUBULIN was used as a loading control; the black arrowhead indicates TSN band (N = 3, n = 1 with 20 seedlings 7 DPG per lane). Right: relative quantification of TSN band (black arrowhead, full length). P-values were calculated by one-way ANOVA (N = 3, n = 1 wells). d Representative images showing the growth of seedlings germinated from freshly collected WT and mca-II-KOc seeds at 3 and 7 DPG (N = 3, n = 1 with ≥ 40 seedlings in total). e Growth of seedlings germinated from WT and mca-II-KOc (3, 6, and 9 month-old) seeds at 3 and 7 DPG (N = 3, n = 1 with ≥ 40 seedlings in total). f Germination rate (%) from freshly collected or 9 month-old seeds of WT and mca-II-KOc. P-values were calculated by one-way ANOVA (N = 3, n = 2 replicates with a total of ≥ 278 seedlings). The first P-value corresponds to the 1 to 3rd point interval, while the second P-value corresponds to the 4th point; the magenta and light-green areas around the individual points (means) represent ± s.d. g Visualization of vacuoles in embryonic roots from WT and mca-II-KOc plants after a 2 day stratification (hydration) counter-stained with the pH-sensitive lumen dye BCECF. The styryl dye FM4-64 was used to visualize the plasma membrane (cell contours, magenta). Yellow arrowheads point to vacuole-free regions in the cytoplasm that compress the vacuolar membrane in the mca-II-KOc (corresponding to lipid droplets; Fig. 5b). Scale bars, 10 μm. Source data are provided as a Source Data file.
Fig. 2
Fig. 2. MCA-IIs associate with the ER.
a Gene ontology term (GO) enrichment analysis of biological processes for proteins more abundant in 6 month-old seeds of mca-II-KOc compared with WT (log2FC ≥ 1). The black dotted box highlights relevant overrepresented and overlapping GO terms. The GO term “fatty acid metabolic process” (GO:0006631) was confirmed by the greatly diminished levels of oleosin and enlarged lipid droplets in the mutant (Fig. 5b). Furthermore, the GO terms “protein folding” (GO:0006457) and “ER body organization” (GO:00080119) were enriched and included proteins such as HEAT SHOCK 70 kDa proteins (HSP70s) and protein disulfide-isomerases (PDI5, PDI6: 3,11- and 5.0-fold, respectively), BiP 1 and 2 (3.4- and 2.6-fold, respectively). In the GO term “protein folding”, the FKBP15-2 (FK506- AND RAPAMYCIN-BINDING PROTEIN 15 KD-2, immunophilin protein) was not found in WT, it is involved in ER stress sensing and accelerates protein folding. Furthermore, in the same GO term, the proteasomal subunits (GO, protein folding) such as PAG1 (20 S proteasome alpha subunit G-1: 1.3-fold) and PBA1 (20 S proteasome subunit beta 1: not found in WT) were verified using α-PAG1 and α-PBA1 antibodies in Supplementary Fig. 11g, confirming high increase of PAG1 and a smaller one for PBA1. In the term “ER body organization”, PYK10 (BGLU23), BGLU18, and BGLU25 (highlighted), β-glucosidases are enriched ≥ 100-fold in mca-II-KOc. The GO term “gluconeogenesis” (GO:0006094) confirms the relevance of this analysis, as MCA-IIs were previously linked to this process. FDR, false discovery rate. b Confocal images of root embryonic cells from Arabidopsis seedlings co-expressing MCA-II-apro:MCA-II-a-GFP (upper) or MCA-II-fpro:MCA-II-f-GFP (lower; elongated cells from roots also shown were due to lower levels of GFP signal the ER is better visualized) with 35Spro:HDEL-CFP or from MCA-II-bpro:MCA-II-b without HDEL-CFP (middle). The yellow arrowhead in MCA-II-apro:MCA-II-a-GFP case denotes an ER sheet at which MCA-II-a is not localizing. Scale bars, 5 μm. The intensity plot profile of the GFP/CFP signal corresponds to intensities calculated at an ER sheet for MCa-II-a-GFP/CFP-HDEL (the region used for the plot profiling is shown in the “merged”). AUs, arbitrary units. Source data are provided as a Source Data file.
Fig. 3
Fig. 3. MCA-IIs co-fractionate with the ER and decrease the accumulation of ubiquitinated proteins.
a Immunoblots probed with α-MCA-II-a, α-BiP2, and α-BRI1 from protein extracts fractionated by sucrose gradient ultracentrifugation in the presence (lower blots) or absence (upper blots) of Mg2+. Red arrows indicate the corresponding bands. Note that MCA-II-a is known to get auto-activated by self-processing and these fragments could be detected (CP, cleavage product from autoactivated MCA-II-a; N = 3, n = 1 replicate, 7 DPG). b Representative immunoblot probed with α-UBIQUITIN11 (UBQ11) from seed protein extracts (50 seeds/genotype) antibody. The numbers indicate relative levels of ubiquitinated proteins compared to Ponceau S staining at the bottom (loading control). Left blot: WT (9 month-old seeds) and mca-II-KOc (seeds harvested at different time points; 3, 6, and 9 month-old). Right blot: WT, mca-II-df (the initial background used for CRISPR), and mca-II-KOc with 9 month-old seeds (N = 2, n = 1 replicates).
Fig. 4
Fig. 4. MCA-IIs associate with CDC48.
a Confocal micrographs of embryonic roots after a 2 day stratification, coexpressing RPS5apro:MCA-II-a-mNeon and 35Spro:mCherry-CDC48. Pearson’s correlation coefficients (r) estimate colocalization between MCA-II-a and CDC48 and are shown on the merged micrograph. The yellow arrowheads denote sites of colocalization between CDC48 and MCA-II-a in puncta. The experiment was repeated more than five times (v, vacuole). Scale bars, 5 μm. Lower: pixel intensity plot profile of mScarlet/mNeon signals on puncta (AUs, arbitrary units). The region used for profiling is shown in the inset. b Proximity Ligation Assay (PLA) approach principle (for < 40 nm protein distance, details in the methods). c Confocal micrographs of PLA signal (PLA foci denoted with orange arrowheads; signal in the nucleus was also detected and is denoted in the “merge”) indicating the interaction between HF-MCA-II-a-tagRFP (HF: 6xHis-3xFLAG tag) with CDC48 (α-CDC48) from epidermal cells of meristematic cells from root (5 DPG). PLA of the P-ATPase AHA1-GFP with CDC48 was used as a negative control (α-GFP and α-CDC48). Scale bars, 10 μm (N = 3, n = 10 seedlings, multiple cells). Right: quantification of PLA-positive foci in cells. P-values were calculated by one-way ANOVA (N = 3, n = 8 cells/sample). d Confocal micrographs from embryonic root epidermal cells probed with α-MCA-II-a and α-CDC48 (N = 4, n ≥ 3 roots per replicate 5 DPG). Cell contours are shown (dim yellow). Scale bar, 5 μm. The charts below show intensity correlations of fluorescent signals using the Pearson correlation coefficient (r), and the intensity plot profile of the signal detected by α-MCA-II-a/α-CDC48 (right; the region used for the plot profiling is shown in the “merged”). The dashed lines show 95% confidence intervals. e Confocal micrographs of embryo hypocotyl cells after a 2 day stratification showing CDC48 colocalization with MCA-II-a from lines co-expressing RPS5apro:MCA-II-a-mNeon and 35spro:mCherry-CDC48a (radicles produced similar results) counterstained with LipidTOX (lipid droplet staining; cyan). The yellow arrowheads denote colocalization between fluorescent signals, while the orange arrowhead denotes lack of colocalization. Scale bars, 5 μm (N = 3, n = 1 seedlings per replicate). Source data are provided as a Source Data file.
Fig. 5
Fig. 5. MCA-IIs regulate the dynamics of lipid droplets.
Representative immunoblots probed with an α-OLE1 from seed proteins of WT, mca-II-KOc (KOc), and the Com line (MCA-II-apro:GFP-MCA-II-a; 3 month-old seeds). The numbers indicate relative levels compared to Ponceau S staining at the bottom (loading control; N = 3, n = 1 with 50 seeds/lane). b Representative confocal micrographs from WT, mca-II-KOc, and Com line counterstained with LipidTOX in the embryonic hypocotyl regions after a 2 day stratification. Insets (denoted 1 to 3) show details of lipid droplets; examples of lipid droplets are denoted with yellow arrowheads. Scale bars, 5 μm (1 μm for insets). Right, measurement of lipid droplet size. P-values were calculated by ordinary one-way ANOVA (N = 3, n ≥ 15 embryonic hypocotyls). RU, relative units. Source data are provided as a Source Data file.
Fig. 6
Fig. 6. MCA–IIs regulate the levels of PUX10 in cells.
a Upper: immunoblot of protein extracts probed with α-GFP from seedlings expressing PUX10pro:PUX10-GFP in WT and mca-II-KOc background. Lower: PUX10-GFP decay in WT or mca-II-KOc following CHX treatment (time points after CHX addition are denoted in min; N = 3, n = 2 replicates with ≥ 10 seedlings per lane 5 DPG). FL, full-length PUX10; CP, cleavage product (minus N-terminus of PUX10). b Confocal images from root epidermal cells of PUX10pro:PUX10-GFP seedlings treated with 50 μM of CHX and MG132 for various times (2 DPG; time points after CHX addition are denoted in min). Scale bars, 50 μm (N = 3, n = 1 replicate with 3 seedlings each). c Immunoblot probed with α-GFP from seedlings expressing PUX10pro:PUX10-GFP in WT in the presence or absence of MG132, and representative confocal images of embryonic roots from seedlings expressing PUX10pro:PUX10-mCherry in WT (upper) and mca-II-KOc (lower). Scale bars, 7 μm. d Immunoblot of protein extracts with α-myc from embryonic roots expressing PUX10pro:PUX10-myc in WT and mca-II-KOc background complemented with MCA-II-a-GFP or the corresponding inactive variant (PD; N = 1, n = 1 replicate with ≥ 10 seedlings per lane 5 DPG).
Fig. 7
Fig. 7. MCA–IIs directly interact with PUX10 in cells.
a Confocal micrographs of lipid droplets stained with LipidTOX in the hypocotyl region of embryos after 2 days stratification of a line co-expressing RPS5apro:MCA-II-a-tagRFP and PUX10pro:PUX10-GFP. In the insets denoted with “a”, orange arrowheads show a lack of colocalization between MCA-II-a/PUX10 with LipidTOX; “(b)”, yellow arrowheads show the MCA-II-a/PUX10 colocalization with LipidTOX; “(c)”, same as in “(a)”, showing that lack of colocalization with relatively larger droplets. Scale bars, 10 μm. The micrographs on the bottom show a surface Z-axis of cells, for better visualization of the PUX10 droplets. The yellow arrowheads show colocalized PUX10/MCA-II-a, while the orange arrowhead shows a lack of colocalization (note the increased signal intensity of PUX10 in this instance). The Pearson correlation coefficient (r) represents the colocalization between GFP and tagRFP signals in droplets. Scale bars, 10 μm (N > 5, n = 1 replicate with ≥10 seedlings). b Representative confocal micrographs (lower) of PLA signal (PLA foci denoted with magenta) indicating the interaction between HF-MCA-II-a-tagRFP (HF: 6xHis-3xFLAG tag) with PUX10-GFP (α-FLAG and α-GFP) from epidermal cells of meristematic cells from root. Yellow arrowheads denote detectable PUX10/MCA-II-a signals, while the orange arrowhead denotes submicroscopic PUX10/MCA-II-a signals that produce PLA (i.e., interactions outside droplets). Scale bar (in “PLA” for visibility), 10 μm. Lower chart: corresponding quantification of PLA-positive foci. P-values were calculated by one-way ANOVA (N = 3, n = 1 replicate with multiple cells). c The “sensitized emission” FRET (FRET-SE) approach, where the emission spectrum of the donor (1) overlaps with the excitation spectrum of the acceptor (2), and if the distance between the two molecules is sufficiently short (i.e., connoting association), energy is transferred (3). d Confocal micrograph showing FRET-SE intensity between PUX10-GFP and MCA-II-a-tagRFP from root epidermal cells. Scale bar, 5 μm. Bottom graph: FRET-SE between PUX10-GFP and MCA-II-a-tagRFP in the absence (mock) or presence of 50 μM MG132. GFP represents the negative control (free GFP; lines co-expressing GFP with MCA-II-a-tagRFP). P-values were calculated by ordinary one-way ANOVA (N = 2, n = 2 roots ≥ 7 cells 5 DPG). Source data are provided as a Source Data file.
Fig. 8
Fig. 8. MCA–IIs regulate the localization of CDC48 in cells.
a Confocal micrographs of embryonic root cells after 2 days stratification, from WT and mca-II-KOc harboring 35Spro:mCherry-CDC48a. Scale bars, 10 μm. The yellow arrowheads denote structures reminiscent of lipid droplets, while the red arrowheads denote the nucleus. The two insets show details of CDC48 localization in WT and mca-II-KOc (“1” and “2”, respectively; N = 2). Middle (chart): quantification of the intensity ratio between the mCherry-CDC48 signal at the lipid droplets (LDs) and cytoplasm in WT, mca-II-KOc, and “Com” (complementation, MCA-II-apro:MCa-II-a-GFP mca-II-KOc). P-values were calculated by one-way ANOVA (N = 3, n = 8 cells/sample). Right: confocal micrographs of embryonic root cells probed with α-CDC48 and α-BIP2 (for ER signal), from WT, mca-II-KOc, and pux10. Note the increased puncta signal in mca-II-KOc; the plasma membrane and perinuclear signals observed in this mutant are also denoted (yellow arrowheads). Scale bars, 10 μm (N = 2, n = 2 replicates with 3 roots in each, after 2 days stratification). b Immunoblots probed with α-CDC48/α-BIP2 from WT, mca-II-KOc, and pux10 protein extracts from seedlings fractionated by sucrose gradient ultracentrifugation in the absence of Mg2+. The red rectangular denotes maximum band intensity; note the slight band signal offset for mca-II-KOc compared to α-BIP2 signal (N = 2, n = 1 replicate 5 DPG). Source data are provided as Source Data file.
Fig. 9
Fig. 9. MCA–IIs regulate the ERAD pathway.
a Images of the indicated genotypes, which were mock-treated (DMSO), treated with a CDC48 inhibitor (CB-5083, 2 μM), and following a 2 day recovery (9 day-old seedlings) from CB-5083 treatment on DMSO-containing plates. Note the swelling root tip phenotype and the shorter root (after 2 d recovery) observed in mca-II-KOc (two lines), which is indicative of hypersensitivity to CB-5083 (insets). Scale bar, 20 mm (N = 3, n = 8–10 seedlings/genotype 7 DPG). b Representative confocal micrographs from WT or mca-II-KOc RPS5apro:Bri1-9-GFP embryonic roots. The plot at the bottom shows the quantification of the ratio of Bri1-9-GFP signal intensity on the plasma membrane compared to the cytoplasmic signal (“cyt”). P-value, two-tailed Mann Whitney test (N = 3, n = 8-10 seedlings/genotype 2 days after stratification). c Representative immunoblot probed with α-BRI1 from WT, bri1-9 and the septuple mca-II-KOc bri1-9 mutant (N = 2, n = 1 replicate with 1 seedling root per lane 2 days after stratification). d Representative phenotypes of WT, bri1-9, and the septuple mca-II-KOc bri1-9 mutant from a double-blind experiment where the genotype-phenotype link was established independently. Scale bar, 10 mm. Source data are provided as a Source Data file.
Fig. 10
Fig. 10. MCA–IIs regulate CDC48 localization and ERAD.
Micrographs from seed viability tests with tetrazolium red staining in WT and mca-II-KOc. Seeds treated at 100 °C represent a positive control for dead seeds. Viable seeds (stained red) are highlighted in the insets (yellow arrowheads). Right: quantification of viable seeds. P-values were calculated by one-way ANOVA (N = 3, n ≥ 176 seeds in total). b A model for the role of MCA-IIs in regulating CDC48 localization to the ER and lipid droplets. In the absence of MCA-IIs, PUX10 is not cleaved and CDC48 is retained on lipid droplets; when MCA-IIs are present, PUX10 is cleaved, releasing CDC48 to localize at the ER. This release is an important step in the spatiotemporal regulation of CDC48 activity and confers seed longevity by modulating ERAD and LDAD. Source data are provided as a Source Data file. Figure 10/panel b Created with BioRender.com released under a Creative Commons Attribution-NonCommercial-NoDerivs 4.0 International license (https://creativecommons.org/licenses/by-nc-nd/4.0/deed.en).

References

    1. de Vries, J. & Ischebeck, T. Ties between stress and lipid dDroplets pre-date seeds. Trends Plant Sci.25, 1203–1214 (2020). 10.1016/j.tplants.2020.07.017 - DOI - PubMed
    1. Lee, J. E., Cathey, P. I., Wu, H., Parker, R. & Voeltz, G. K. Endoplasmic reticulum contact sites regulate the dynamics of membraneless organelles. Science367, eaay7108 (2020). 10.1126/science.aay7108 - DOI - PMC - PubMed
    1. Srivastava, R. et al. Response to persistent ER stress in plants: a multiphasic process that transitions cells from prosurvival activities to cell death. Plant Cell30, 1220–1242 (2018). 10.1105/tpc.18.00153 - DOI - PMC - PubMed
    1. Minina, E. A. et al. Classification and nomenclature of metacaspases and paracaspases: no more confusion with caspases. Mol. Cell77, 927–929 (2020). 10.1016/j.molcel.2019.12.020 - DOI - PMC - PubMed
    1. Coll, N. S. et al. Arabidopsis type I metacaspases control cell death. Science330, 1393–1397 (2010). 10.1126/science.1194980 - DOI - PubMed

Substances

LinkOut - more resources