. 2024 Aug 8;15(1):6756.
doi: 10.1038/s41467-024-50415-9.

AI hybrid survival assessment for advanced heart failure patients with renal dysfunction

Affiliations

AI hybrid survival assessment for advanced heart failure patients with renal dysfunction

Ge Zhang et al. Nat Commun. .

Abstract

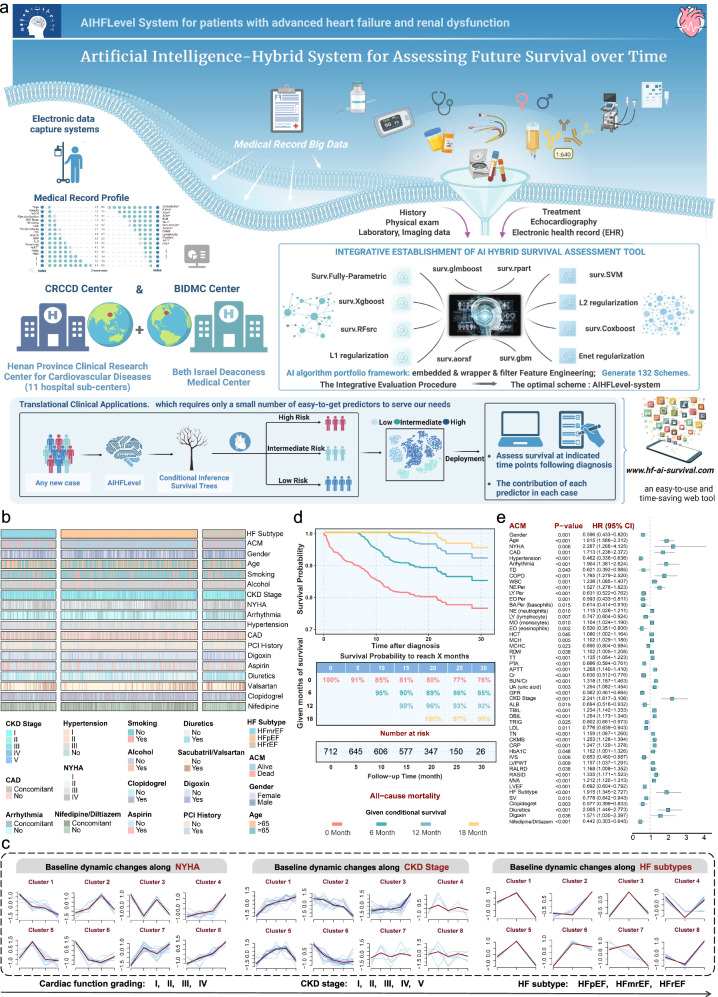
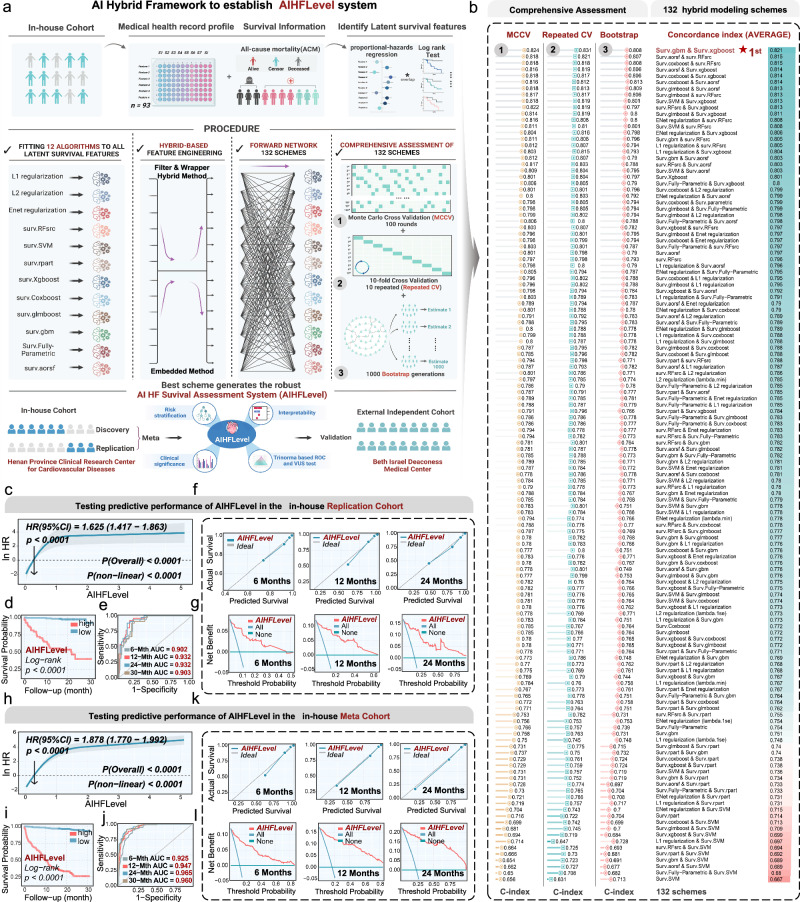
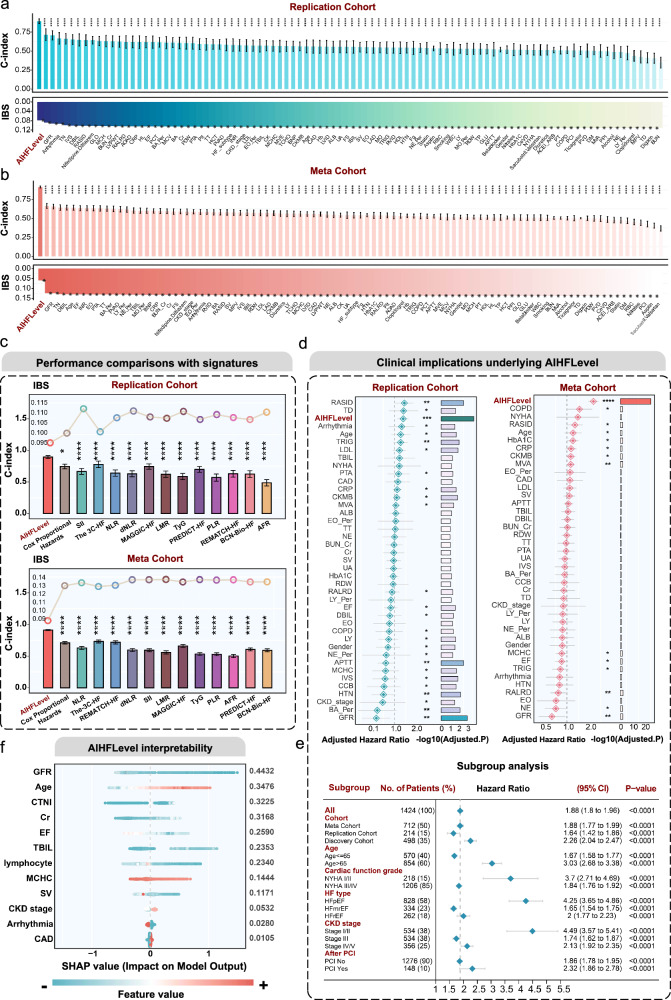
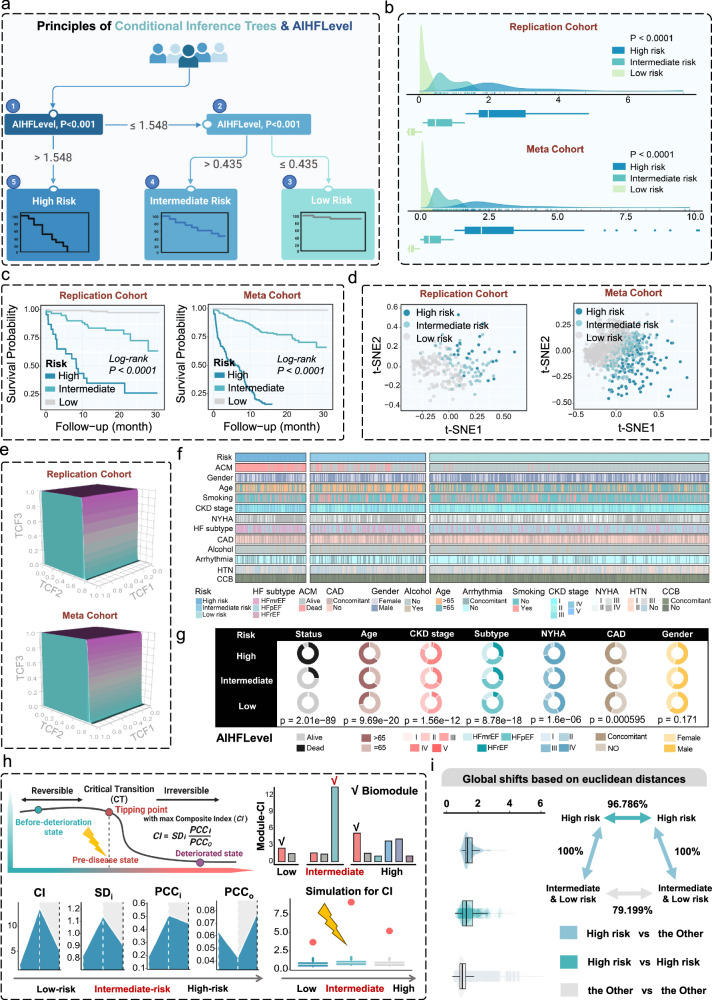
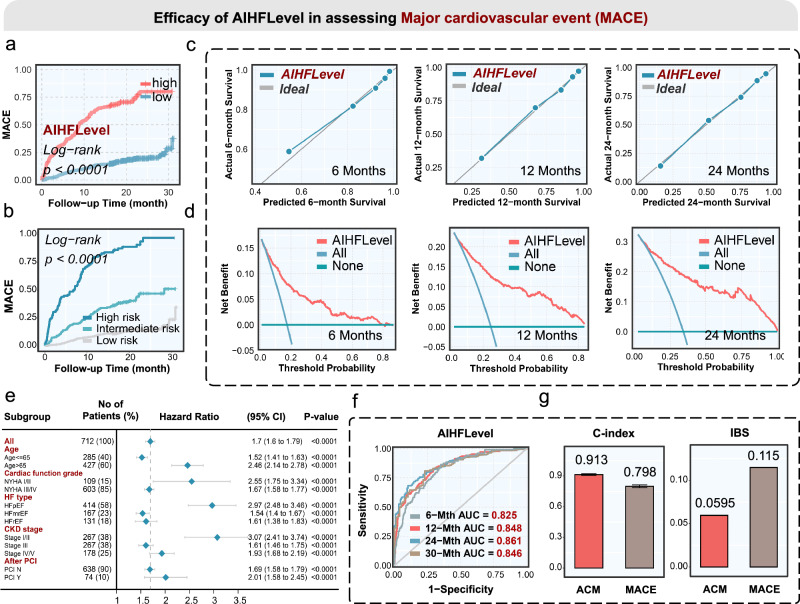
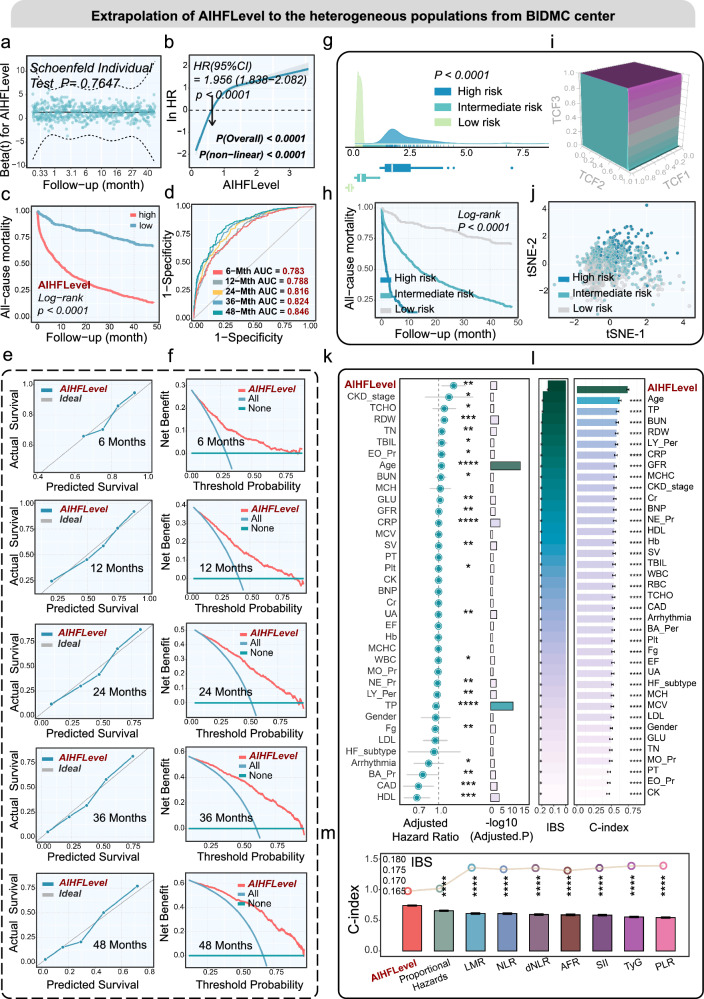
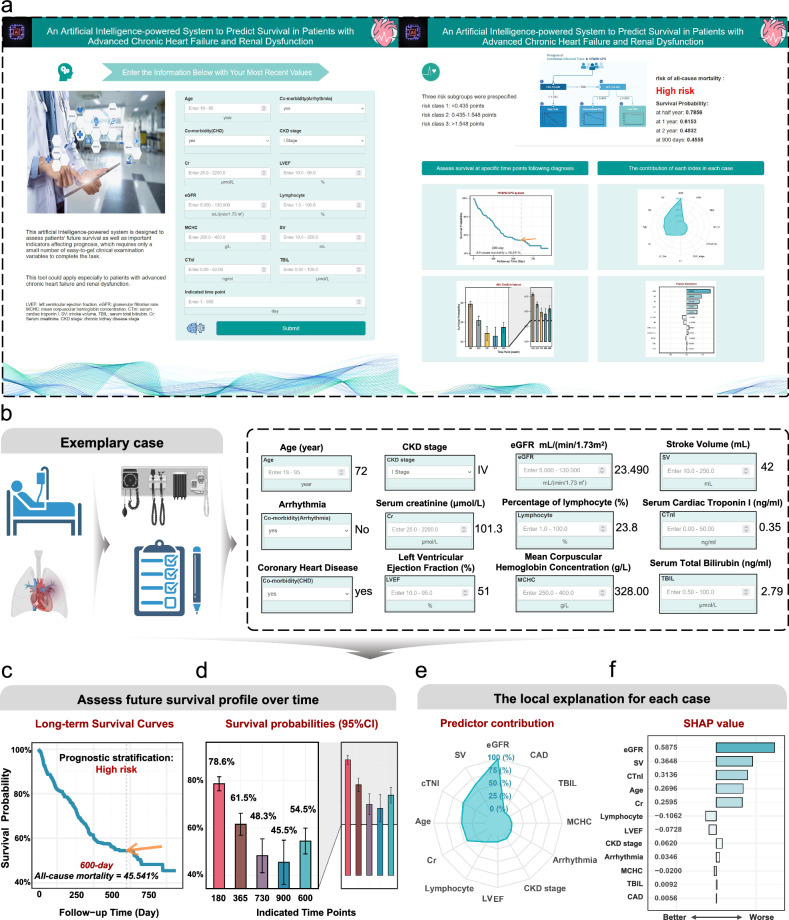
Renal dysfunction (RD) often characterizes the worse course of patients with advanced heart failure (AHF). Many prognosis assessments are hindered by researcher biases, redundant predictors, and lack of clinical applicability. In this study, we enroll 1736 AHF/RD patients, including data from Henan Province Clinical Research Center for Cardiovascular Diseases (which encompasses 11 hospital subcenters), and Beth Israel Deaconess Medical Center. We developed an AI hybrid modeling framework, assembling 12 learners with different feature selection paradigms to expand modeling schemes. The optimized strategy is identified from 132 potential schemes to establish an explainable survival assessment system: AIHFLevel. The conditional inference survival tree determines a probability threshold for prognostic stratification. The evaluation confirmed the system's robustness in discrimination, calibration, generalization, and clinical implications. AIHFLevel outperforms existing models, clinical features, and biomarkers. We also launch an open and user-friendly website www.hf-ai-survival.com , empowering healthcare professionals with enhanced tools for continuous risk monitoring and precise risk profiling.


Conflict of interest statement

The authors declare no competing interests.

Figures

Fig. 1
Fig. 1. Baseline characteristics overview.
a Overview of the study methodology. Image was created with a licensed version of bioRender.com. b Heatmap providing a snapshot of the general baseline demographic and clinical profile in the Henan Province Clinical Research Center for Cardiovascular Diseases (CRCCD) in-house cohort. This visual representation includes data on all-cause mortality (ACM), gender distribution, age, smoking habits (current smokers and previous smokers), drinking status (any consumption of alcohol in the previous six months), chronic kidney disease (CKD) staging, NYHA classification for cardiac function, comorbidities such as arrhythmia and coronary artery disease (CAD), history of percutaneous coronary intervention (PCI), and medication usage (including digoxin, aspirin, diuretics, valsartan, clopidogrel, and nifedipine). c Kinetics plots revealed evolving baseline profiles among AHF and RD patients, tracing the intricate paths of disease progression. This analysis, covering NYHA cardiac function grades I to IV, CKD stages I to V, and HF subtypes (HFpEF, HFmrEF, HFrEF), distinguished eight unique patterns of progression for each path. The clustering visualized these patterns through a gradient of membership values, represented in a spectrum from warm colors (dark red for high membership) to cool colors (sky blue for low membership). d Kaplan–Meier estimates provide a nuanced view of conditional survival up to 30 months post-diagnosis for patients with AHF and RD, stratified by initial survival increments of 0–18 months. The matrix format, where each column signifies the elapsed months since the initial diagnosis and each row delineates the cumulative survival probability from that juncture, offers an insightful prognosis tool. For instance, a patient who has already achieved a 6-month survival post-diagnosis has an 89% chance of reaching the 20-month mark and an 85% likelihood of attaining a 30-month survival threshold. e Univariate Cox proportional hazards analysis, leveraging 93 variables derived from medical health record data from the CRCCD cohort (n = 712), discerned 50 variables significantly associated with ACM survival. Statistic test: two-sided Wald test. Data were presented as hazard ratio (HR) with 95% confidence interval (CI).
Fig. 2
Fig. 2. Consistent predictive performance and prognostic value of AIHFLevel.
a AI modeling hybrid framework overview. The image was created with a licensed version of bioRender.com. b Schematic illustration of optimal scheme identification. The diagram delineates the comprehensive evaluation process of 132 distinct modeling schemes through an array of lollipop plots, including 10 repeated 10-fold cross-validation, 100 iterations of Monte-Carlo cross-validation (MCCV) with a 70% sampling ratio, and a thorough bootstrap analysis comprising 1000 iterations. c Analysis of non-linear relationship between AIHFLevel and ACM risk using restricted cubic spline regression based on Replication cohort (Poverall <0.0001, and Pnon-linear < 0.0001). Non-linear patterns indicating a ‘fast-to-low’ increase in ACM risk associated with rising AIHFLevel. Univariate Cox regression analysis highlighted the AIHFLevel as a significant clinical predictor for ACM, with a hazard ratio (HR) of 1.615 (95% CI = 1.417–1.863). Statistic test: two-sided Wald test: P < 0.0001. Line chart displaying the estimated logarithm HRs represented by blue lines, along with 95% CIs indicated by shading. d Cumulative Kaplan-Meier estimates the delineating time to the survival difference for ACM stratified by AIHFLevel within the Replication cohort. e Time-dependent ROC analysis for predicting ACM within the Replication cohort. AUCs at 6-, 12-, 24-, and 30-months demonstrating strong predictive accuracy: 0.902, 0.932, 0.932, 0.903. f Calibration curves depicting the predicted versus observed probabilities of ACM as evaluated by AIHFLevel within the Replication cohort. g Decision Curve Analysis (DCA) illustrating net benefit curves of AIHFLevel for predicting ACM within the Replication cohort. h Analysis of non-linear relationship between AIHFLevel and ACM risk using restricted cubic spline regression within Meta cohort (Poverall <0.0001, and Pnon-linear < 0.0001). Univariate Cox regression analysis highlighted the AIHFLevel as a significant clinical predictor for ACM, with an HR of 1.878 (95% CI = 1.770–1.992). Statistic test: two-sided Wald test: P < 0.0001. Line chart displaying the estimated logarithm HRs represented by blue lines, along with 95% CIs indicated by shading. i Cumulative Kaplan-Meier estimates delineating time to the first adjudicated occurrence of ACM stratified by AIHFLevel within Meta cohort. j Time-dependent ROC analysis for predicting ACM within Meta cohort. AUCs at 6-, 12-, 24-, and 30-months confirming predictive excellence: 0.925, 0.947, 0.965, and 0.960. k Calibration curves depicting the predicted versus observed probabilities of ACM within the Meta cohort. l DCA illustrating net benefit curves of AIHFLevel for predicting ACM within Meta cohort.
Fig. 3
Fig. 3. Robustness and superior performance of AIHFLevel.
a Comparative predictive efficacy of AIHFLevel against collected 93 readily accessible clinical traits in the Replication cohort (n = 214). AIHFLevel exhibits notably higher predictive accuracy, demonstrated by superior C-index values and IBS. The statistical significance of differences was determined using the compareC R package, employing a one-shot, nonparametric approach. C-index was presented with 95% confidence interval (CI). Statistic tests: two-sided z-score test. b Comparative predictive efficacy of AIHFLevel against collected 93 readily accessible clinical traits in the Meta cohort (n = 712). C-index was presented with 95% CI. Statistic tests: two-sided z-score test. c Comparative predictive efficacy of AIHFLevel against established risk and prognostic models within the Replication cohort (top, n = 214) and Meta cohort (bottom, n = 712). The risk scores for each model were computed based on their predefined features and coefficients as outlined in their original publications. The analysis, visualized through bar graphs for the C-index and line graphs for the IBS. C-index was presented with 95% CI. We employed a one-shot, nonparametric statistical comparison, using two-sided z-tests to ascertain significance. d Multivariate Cox regression analysis of AIHFLevel for ACM within Replication cohort (left, n = 214) and Meta cohort (right, n = 712). Upon adjusting for significant clinical traits, AIHFLevel consistently demonstrated independent prognostic value. Statistic test: two-sided Wald test. Dot plots illustrated the adjusted hazard ratios with the horizontal line indicating the 95% CI for each variable. Bar graphs highlighted the -log10(adjusted P-values) to denote statistical significance levels. e Subgroup analysis estimating the clinical prognostic value of AIHFLevel across different pre-specified subgroups. The length of the horizontal line represented the 95% confidence interval for each subgroup, with a vertical dotted line indicating the hazard ratio of all patients. Statistic test: two-sided Wald test. The vertical solid line denoted HR = 1. f SHAP summary dot plot, stacked vertically to show density. On the X-axis, the contribution of each predictor to the system’s output was quantified by the SHAP value. The probability of survival decreased with increasing the SHAP value of a predictor. A positive SHAP value indicated an increased risk of ACM, while a negative value suggests a protective effect. Each dot represents an individual patient’s SHAP value for a specific predictor. The color coding of dots reflected the actual predictor values for patients, with red indicating higher values and blue indicating lower values. This color gradient demonstrates the relationship between predictor values and their effect on ACM risk. *P < 0.05, **P < 0.01, ***P < 0.001, ****P < 0.0001.
Fig. 4
Fig. 4. Prognostic stratification underlying AIHFLevel.
a Conditional Inference Survival Tree Analysis: Identifies prognostic heterogeneity within AHF&RD patients, categorizing them into three prognostic states based on AIHFLevel values: Low-Risk (AIHFLevel ≤ 0.435), Intermediate-Risk (AIHFLevel between 0.435 and 1.548), and High-Risk (AIHFLevel > 1.548). Image was created with licensed version of bioRender.com.b Distribution of AIHFLevel values among low-risk, intermediate-risk, and high-risk groups in the Replication cohort (Top, P < 0.0001, n = 214) and Meta cohort (Bottom, P < 0.0001, n = 712). Statistic tests: two-sided wilcoxon test. c Kaplan-Meier curves showing the survival difference for ACM across three prognostic states, with log-rank test results indicating statistical significance. d Unsupervised t-SNE analysis spatially segregates samples by prognostic states into two dimensions, showcasing effective discrimination. e Trinormal snapshot of ROC surface showing AIHFLevel’s discriminatory efficacy among the three prognostic states. f Heatmap depicting the baseline characteristics distribution within Meta cohort, including gender, alcohol status, smoking status, age, occurrence of ACM, coronary artery disease (CAD), hypertension (HTN), arrhythmia comorbidities, NYHA cardiac function, chronic kidney disease (CKD) stage, HF subtype, nifedipine/diltiazem (CCB) medication history. g Pie chart showing the two-sided Chi-squared test of general baseline factors for prognostic stratification within Meta cohort. h Critical transition signal analysis in the CRCCD cohort (n = 712). Top left: Schematic diagram illustrating a phase transition during disease progression. Top right: Bar plot showing DNB-Composite Index (CI) per module across three prognostic states. The Biomodule (module with the highest CI) of each state indicated the CT levels per state. Intermediate-risk exhibited the most significant CT signal. Bottom left: Distribution of DNB-scores in each state. SDi, the average standard deviation of all variables inside the biomodule; PCCi, the average Pearson’s correlation coefficient (PCC) of absolute value for variable-pairs inside the biomodule; PCCo, the average PCC absolute value for feature-pairs between the biomodule and others (absolute value). The CI is expected to increase abruptly and significantly before the CT to the deteriorated phase and can serve as an early warning signal. Bottom right: Comparison between observed (red dot) and simulated (box plot) CI validated the robustness of CT and tipping-point captured by DNB model. i Global shift of our prognostic stratification based on the CRCCD cohort (n = 712; low-risk: n = 427, intermediate-risk: n = 177, high-risk: n = 427). Euclidean expression distances were calculated between high-risk samples and remaining samples (blue), within samples of high-risk (green), and within remaining samples (grey). Inset summarized the average distances between pairs of samples as a percentage of the average distance between high-risk and remaining samples. In the boxplots, centre line indicates median, bounds of box indicate 25th and 75th percentiles, and whiskers indicate minimum and maximum.
Fig. 5
Fig. 5. Sensitivity analysis for AIHFLevel.
a Cumulative Kaplan–Meier estimates of the time to the first adjudicated occurrence of MACE within the Meta cohort, with log-rank test results indicating statistical significance. b Kaplan-Meier curve showing the incidence difference for MACE across three prognostic states, with log-rank test results indicating statistical significance. c Calibration curve depicting the predicted versus observed probabilities of MACE at 6, 12, and 24 months, as evaluated by AIHFLevel within Meta cohort (n = 712). d DCA illustrating net benefit curves of AIHFLevel for predicting MACE at 6, 12, and 24 months within Meta cohort (n = 712). The X-axis represented the threshold probability for critical care outcomes, while the Y-axis quantified the net benefit. e Subgroup analysis estimating AIHFLevel’s prognostic value for MACE across different subgroups. Statistic test: two-sided Wald test. The length of the horizontal line represented the 95% confidence interval for each subgroup, with a vertical dotted line indicating the hazard ratio of all patients. The vertical solid line denoted HR = 1. HR > 1 indicated AIHFLevel as a risk prognostic factor. f Time-dependent ROC analysis for predicting MACE within Meta cohort (n = 712). AUCs at 6-, 12-, 24-, and 30-months demonstrating strong predictive accuracy: 0.825, 0.848, 0.861, 0.846. g Comparative AIHFLevel’s efficacy in assessing ACM and MACE within the Meta cohort (n = 712) using C-index and IBS. C-index was presented with 95% confidence interval (CI).
Fig. 6
Fig. 6. Extrapolation of AIHFLevel to the heterogeneous populations from BIDM center.
a Proportional hazard assumption of Cox regression for AIHFLevel demonstrated no significant correlation between Schoenfeld residuals and time. Statistical tests: two-sided Schoenfeld residuals test. b Analysis of the non-linear relationship between AIHFLevel and ACM risk using restricted cubic spline regression within the external BIDMC cohort (Poverall <0.0001, and Pnon-linear < 0.0001). Non-linear patterns indicating a ‘fast-to-low’ increase in ACM risk associated with rising AIHFLevel. Univariate Cox regression analysis highlighted the AIHFLevel as a significant clinical predictor for ACM, with a HR of 1.956 (95% CI = 1.838-2.082). Statistic test: two-sided Wald test. Line chart displaying the estimated logarithm HRs represented by blue lines, along with 95% CIs indicated by shading. c Cumulative Kaplan-Meier estimates delineating time to the survival difference for ACM stratified by AIHFLevel. d Time-dependent ROC analysis for predicting ACM. AUCs at 1-, 2-, 3-, 4-year demonstrating strong predictive accuracy: 0.788, 0.816, 0.824, 0.846. e Calibration curves depicting the predicted versus observed probabilities of ACM as evaluated by AIHFLevel. f DCA illustrating net benefit curves of AIHFLevel for predicting ACM. g Distribution of AIHFLevel across three prognostic states in the BIDMC cohort (P < 0.0001, n = 1024). Statistic tests: two-sided wilcoxon test, as determined by established stratification criteria. Centre line indicates median, bounds of box indicate 25th and 75th percentiles, and whiskers indicate minimum and maximum. h Kaplan-Meier curves showing the survival difference for ACM across three prognostic states. i Trinormal snapshot of ROC surface demonstrating the discriminatory power of AIHFLevel on three prognostic states. j t-SNE dimension reduction analysis spatially segregated samples by prognostic states into two dimensions, showcasing effective and stable discrimination. k Multivariate Cox regression of AIHFLevel for ACM risk in the BIDMC (n = 1024). Upon adjusting for potential confounders, AIHFLevel demonstrated independent prognostic value. Dot plots illustrated the adjusted hazard ratios with the horizontal line indicating the 95% confidence interval for each variable. Bar graphs highlighted the -log10(adjusted P-values) to denote statistical significance levels. Statistic test: two-sided Wald test. l Comparative predictive efficacy of AIHFLevel against clinical traits in the BIDMC (n = 1024). C-index was presented with 95% CI. Statistic tests: two-sided z-score test. m Comparative predictive efficacy of AIHFLevel against established risk and prognostic models in the BIDMC (n = 1024). The analysis, visualized through bar graphs for the C-index and line graphs for the IBS, using two-sided z-score test to ascertain significance: *P < 0.05, **P < 0.01, ***P < 0.001, ****P < 0.0001.
Fig. 7
Fig. 7. Convenient web application for clinical utility.
a The user interface of the application website showcases a comprehensive suite of functionalities, including prognostic stratification, calculation of long-term survival probabilities, all-cause mortality predictions at indicated time points, local interpretation, and predictor contribution. The left panel displayed the initial screen where users input the actual values for the 12 predictors and the desired time point for any new individual patient. The right panel presented the interface for displaying the results of the survival assessment, providing a clear and concise overview of the prognostic outcomes. b Illustration of the practical application through an exemplary case. Users input data through 13 queries: age (72 years), arrhythmia comorbidity (No), CAD comorbidity (Yes), CKD stage (IV), Cr (101.3 μmol/L), LVEF (51%), eGFR (23.490 ml/(min/1.73 m3)), Lymphocyte (23.8%), MCHC (328.00 g/L), SV (42%), CTnI (0.35 ng/ml), TBIL (2.79 ng/ml), and the time point of interest (600-day). The image was created with a licensed version of bioRender.com. c Long-term survival curve. The y-axis represents the percentage value of survival probability, while the x-axis represents any future time point. The arrow and dotted line indicate the calculation of all-cause mortality at the specified time point of interest. d Histogram depicting the predicted survival probability values for this patient at several important future time points (180, 365, 730, 900 days, and the specified time point) from the current moment. Data were presented with 95% CI. e Radar graph indicating contributions of each predictor to the survival assessment. f The X-axis quantifies each predictor’s contribution to the system’s output using SHAP values, with the probability of survival decreasing as the SHAP value increases. A positive SHAP value indicates an increased risk of ACM, while a negative value suggests a protective effect. For this case, the values of eGFR, SV, CTnI, age, and Cr were pushing the decision towards a worse prognosis, while Cr, LVEF, and MCHC were influencing the decision toward a favorable prognosis.

Similar articles

Cited by

References

    1. Crespo-Leiro, M. G. et al. Advanced heart failure: a position statement of the Heart Failure Association of the European Society of Cardiology. Eur. J. Heart Fail20, 1505–1535 (2018). 10.1002/ejhf.1236 - DOI - PubMed
    1. Fang, J. C. et al. Advanced (stage D) heart failure: a statement from the Heart Failure Society of America Guidelines Committee. J. Card. Fail21, 519–534 (2015). 10.1016/j.cardfail.2015.04.013 - DOI - PubMed
    1. Truby, L. K. & Rogers, J. G. Advanced heart failure: epidemiology, diagnosis, and therapeutic approaches. JACC Heart Fail8, 523–536 (2020). 10.1016/j.jchf.2020.01.014 - DOI - PubMed
    1. Xanthakis, V. et al. Prevalence, neurohormonal correlates, and prognosis of heart failure stages in the community. JACC Heart Fail4, 808–815 (2016). 10.1016/j.jchf.2016.05.001 - DOI - PMC - PubMed
    1. McDonagh, T. A. et al. Focused Update of the 2021 ESC Guidelines for the diagnosis and treatment of acute and chronic heart failure. Eur. Heart J.44, 3627–3639 (2023). 2023. 10.1093/eurheartj/ehad195 - DOI - PubMed