. 2024 Aug 9;9(1):199.
doi: 10.1038/s41392-024-01915-z.

LIM-domain-only 4 (LMO4) enhances CD8+ T-cell stemness and tumor rejection by boosting IL-21-STAT3 signaling

Affiliations

LIM-domain-only 4 (LMO4) enhances CD8+ T-cell stemness and tumor rejection by boosting IL-21-STAT3 signaling

Roland C Schelker et al. Signal Transduct Target Ther. .

Abstract

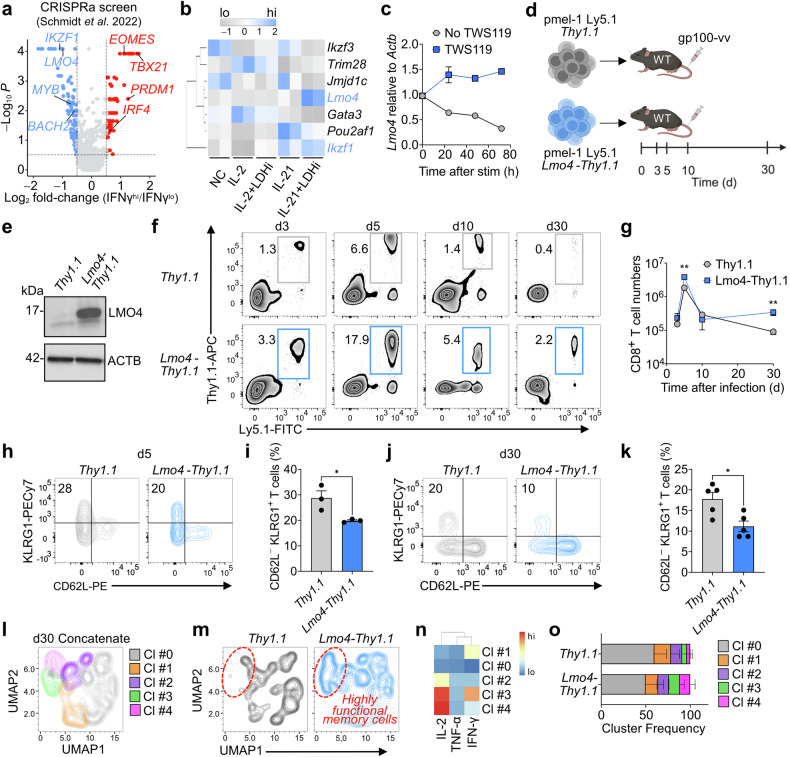
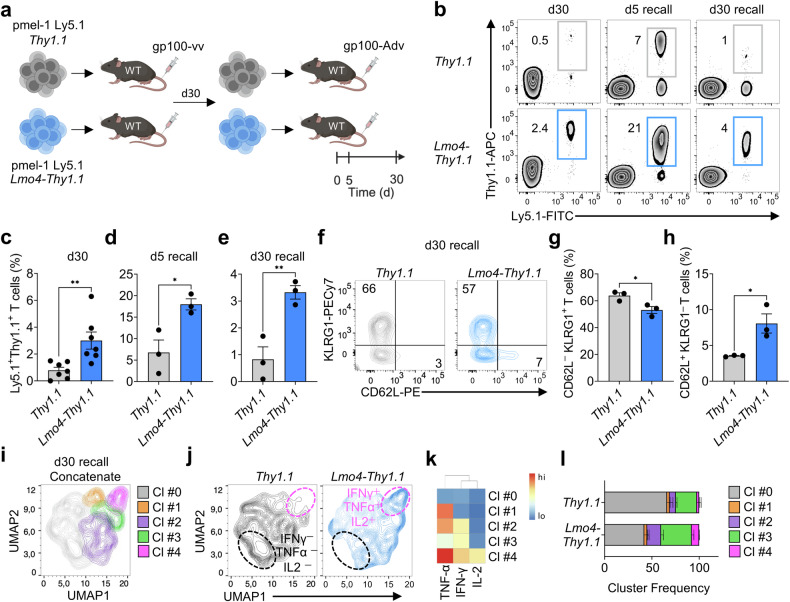
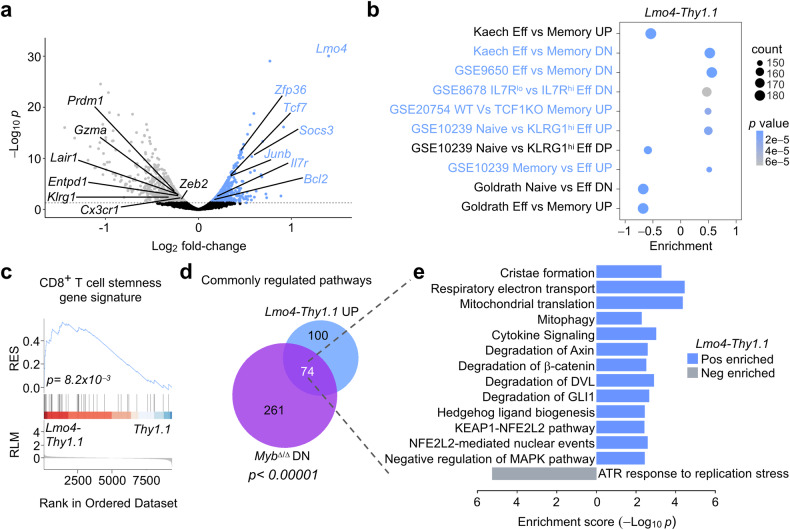
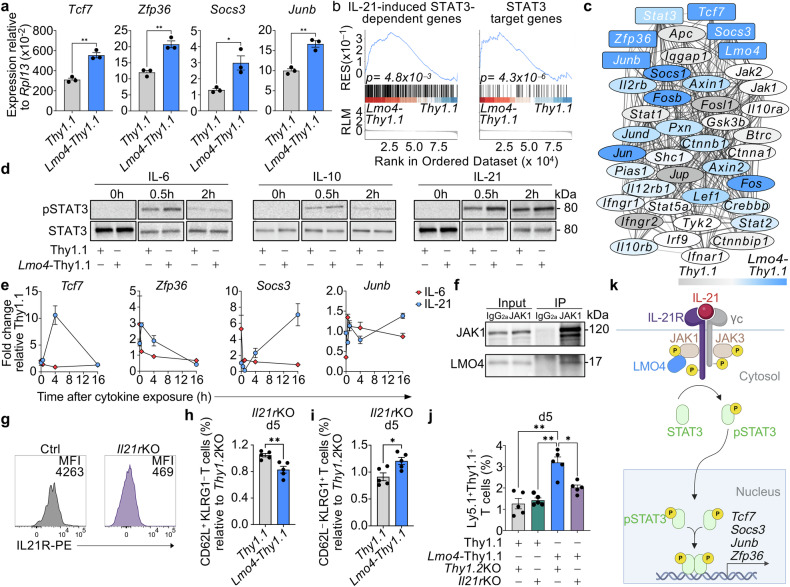
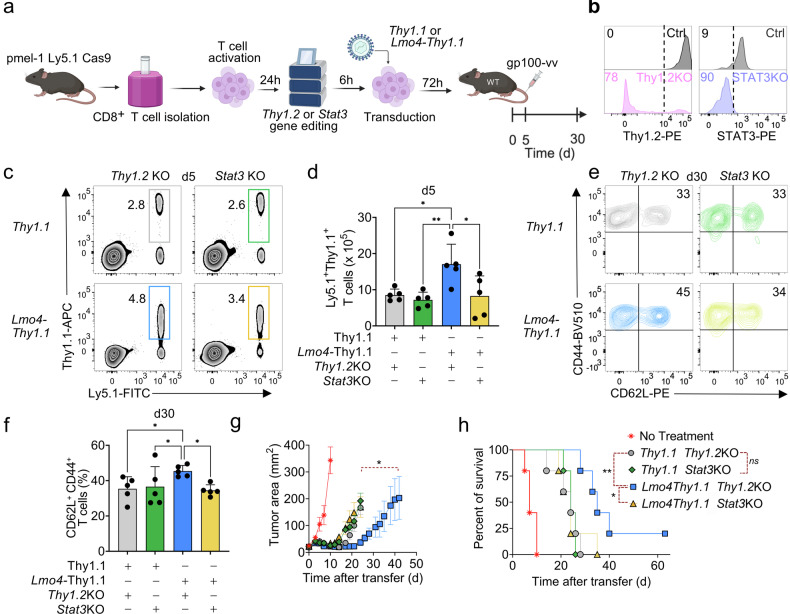
High frequencies of stem-like memory T cells in infusion products correlate with superior patient outcomes across multiple T cell therapy trials. Herein, we analyzed a published CRISPR activation screening to identify transcriptional regulators that could be harnessed to augment stem-like behavior in CD8+ T cells. Using IFN-γ production as a proxy for CD8+ T cell terminal differentiation, LMO4 emerged among the top hits inhibiting the development of effectors cells. Consistently, we found that Lmo4 was downregulated upon CD8+ T cell activation but maintained under culture conditions facilitating the formation of stem-like T cells. By employing a synthetic biology approach to ectopically express LMO4 in antitumor CD8+ T cells, we enabled selective expansion and enhanced persistence of transduced cells, while limiting their terminal differentiation and senescence. LMO4 overexpression promoted transcriptional programs regulating stemness, increasing the numbers of stem-like CD8+ memory T cells and enhancing their polyfunctionality and recall capacity. When tested in syngeneic and xenograft tumor models, LMO4 overexpression boosted CD8+ T cell antitumor immunity, resulting in enhanced tumor regression. Rather than directly modulating gene transcription, LMO4 bound to JAK1 and potentiated STAT3 signaling in response to IL-21, inducing the expression of target genes (Tcf7, Socs3, Junb, and Zfp36) crucial for memory responses. CRISPR/Cas9-deletion of Stat3 nullified the enhanced memory signature conferred by LMO4, thereby abrogating the therapeutic benefit of LMO4 overexpression. These results establish LMO4 overexpression as an effective strategy to boost CD8+ T cell stemness, providing a new synthetic biology tool to bolster the efficacy of T cell-based immunotherapies.


Conflict of interest statement

L.G. has consulting agreements with Lyell Immunopharma Inc. L.G. is on the scientific advisory board of Poseida Therapeutics and Kiromic, and a stockholder of Poseida Therapeutics. J.F. is an employee and owns stock in Lyell Immunopharma, Inc. All other authors declare no competing interests.

Figures

Fig. 1
Fig. 1
Lmo4 overexpression enhances CD8+ T cell stemness and polyfunctionality. a Volcano plot displaying median sgRNA log2-fold change (IFN-γhi/lo sorting bin counts) for each gene tested in the genome-wide CRISPRa screen. Genes included in the analysis were exclusively transcription factors or transcription regulators. b Heatmap depicting the expression levels (assessed by RNA-seq) of the top negative hits identified in the CRISPRa screen in CD8+ T cells cultured for 4 d under different conditions: No Cytokine (NC), IL-2, IL-2 + LDHi, IL-21, IL-21 + LDHi. c q-PCR of Lmo4 mRNA in CD8+ T cells cultured for 72 h with or without TWS119. d Experimental design to assess the impact of Lmo4 overexpression on stem-like CD8+ T cell formation. e Immunoblot of LMO4 in Thy1.1 and Lmo4-Thy1.1 overexpressing T cells. ACTB served as control. f, g Flow cytometry analysis (f) and quantification (g) of splenic pmel-1 CD8+ T cells following transfer of either 105 pmel-1 Ly5.1+ Thy1.1+ or Lmo4-Thy1.1+ CD8+ T cells into wild-type mice infected with gp100-vv. Assessment was conducted at various time points from 3 to 30 days post-transfer, with three mice per group for each time point. Data are from one representative of 3 experiments. h, i Flow cytometry analysis (h) and percentages (i) of CD62LKLRG1+ splenic pmel-1 T cells 5 d after transfer as in (f, g). j, k Flow cytometry analysis (j) and percentages (k) of CD62LKLRG1+ splenic pmel-1 T cells 30 d after transfer as in (f, g). l UMAP plot of concatenated Thy1.1+ and Lmo4-Thy1.1+ pmel-1 CD8+ T cells isolated from spleens 5 d after treatment as in (f, g) showing the distribution of clusters (Cl) identified by FlowSOM. m UMAP plot of concatenated Thy1.1+ and Lmo4-Thy1.1+ pmel-1 CD8+ T cells showing differences in cluster distributions. n Heatmap showing the relative expression levels of indicated cytokines in the FlowSOM clusters. o Bar plot of Thy1.1+ and Lmo4-Thy1.1+ pmel-1 CD8+ T cells isolated from spleens 5 d after treatment as in (f, g) quantifying the distribution of clusters assessed by FlowSOM. *P < 0.05, **P < 0.01 (unpaired two-tailed Student’s t-test). (d) was created with BioRender.com
Fig. 2
Fig. 2
Increased expression of Lmo4 augments CD8+ T cell recall responses. a Experimental design investigating the impact of Lmo4 overexpression on CD8+ T cell secondary responses. be Flow cytometry analysis (b) and percentages (ce) of splenic pmel-1 CD8+ T cells following transfer of either 105 pmel-1 Ly5.1+ Thy1.1+ or Lmo4-Thy1.1+ CD8+ T cells into wild-type mice infected with gp100-vv (primary infection) or gp100-Adv (secondary infection). Assessment was conducted at various time points: d30 after primary infection and d5 or d30 after secondary infection (recall); with seven mice per group for d30 and three mice per group for d5 recall and d30 recall. fh Flow cytometry analysis (f) and percentages of CD62LKLRG1+ (g) and CD62L+KLRG1 (h) splenic pmel-1 T cells 5 d after transfer as in (be). i UMAP plot of concatenated Thy1.1+ and Lmo4-Thy1.1+ pmel-1 CD8+ T cells isolated from spleens 30 d after secondary transfer as in (be) showing the distribution of clusters (Cl) identified by FlowSOM. j UMAP plot of Thy1.1+ and Lmo4-Thy1.1+ pmel-1 CD8+ T cells showing differences in cluster distributions. k Heatmap showing the relative expression levels of indicated cytokines in the FlowSOM clusters. l Bar plot of Thy1.1+ and Lmo4-Thy1.1+ pmel-1 CD8+ T cells isolated from spleens 5 d after treatment as in (be) quantifying the distribution of clusters assessed by FlowSOM. *P < 0.05, **P < 0.01 (unpaired two-tailed Student’s t-test). (a) was created with BioRender.com
Fig. 3
Fig. 3
Enforced expression of Lmo4 enhances CD8+ T cell antitumor immunity. a Experimental design investigating the effect of Lmo4 overexpression on the antitumor immune response of CD8+ T cells. b, c Tumor size (b) and survival curve (c) of B16KVP tumor-bearing wild-type mice after transfer of either 3.5 × 10⁵ pmel-1 Thy1.1+ or Lmo4-Thy1.1+ CD8+ T cells into wild-type mice treated with gp100-vv and IL-2. d Representative flow cytometry plot depicting the gating strategy to assess the frequency of human TSCM cells, defined as CD45RA+CD45R0-CD62L+CCR7+CD95+TCF1+ cells. e Percentage of TSCM cells in LMO4-Thy1.1 and Thy1.1 transduced CD8+ T cells after activation by TransAct and subsequent culture in IL-7 and IL-21 for 7 days (n = 5). f Experimental design investigating the effect of LMO4 overexpression on the antitumor immune response of human CD19-CAR-modified CD8+ T cells (n = 5 to 7 mice/group). g Percentage of human CD8+ T cells in the peripheral blood of NXG mice bearing NALM6-GL leukemia 7 days after adoptive transfer of LMO4-Thy1.1 or Thy1.1 CD19-CAR CD8+ T cells in conjunction with recombinant human IL-15. h In vivo bioluminescent imaging and i survival of NALM6-GL-bearing NXG mice treated as in (g). (*P < 0.05. g, unpaired one-tailed Student’s t-test, i, P = 0.0597 log-rank (Mantel–Cox) test). (a, f) was created with BioRender.com
Fig. 4
Fig. 4
Ectopic expression of LMO4 enhances transcriptional programs that regulate stemness. a Volcano plot displaying changes in gene expression between pmel-1 Thy1.1+ and Lmo4-Thy1.1+ CD8+ T cells. Gene expression was evaluated by RNA-seq of pmel-1 CD62L-KLRG1- T cells collected 5 d after transfer of 105 pmel-1 Thy1.1+ and Lmo4-Thy1.1+ CD8+ T cells into wild-type mice infected with gp100-vv (n = 5 mice/group). b Bubble plot illustrating significantly enriched pathways related to CD8+ T cell memory and effector differentiation. c GSEA revealing positive enrichment of genes universally characteristic of stem-like T cells, in pmel-1 Lmo4-Thy1.1+ CD8+ T cells. d Venn diagram illustrating the overlap between pathways significantly upregulated in Lmo4-Thy1.1+ and downregulated in MybΔ/Δ pmel-1 CD8+ T cells, generated under identical experimental conditions, described in (a). e Bidirectional bar plot displaying the enrichment scores of selected enriched pathways in Lmo4-Thy1.1 and MybΔ/Δ pmel-1 CD8+ T cells. P-value was calculated with c Kolmogorov–Smirnov test, d Fisher’s Exact Test
Fig. 5
Fig. 5
Lmo4 overexpression enhances STAT3 phosphorylation and STAT3 target gene expression. a qPCR of Tcf7, Zfp36, Socs3, and Junb mRNA in pmel-1 Thy1.1+ and Lmo4-Thy1.1+ CD8+ T cells 5 d after transfer of 105 pmel-1 CD8+ T cells transduced with either Thy1.1+ or Lmo4-Thy1.1+ into wild-type mice infected with gp100-vv. b GSEA showing positive enrichment of genes upregulated in response to IL-21 in CD4+ T cells (left panel) and genes displaying one or more STAT3 binding motifs (GSEA C3:STAT3_02) (right panel) in pmel-1 Lmo4-Thy1.1+ CD8+ T cells harvested as in (a). c Gene regulatory network that interfaces with Stat3 in pmel-1 Thy1.1+ vs. Lmo4-Thy1.1+ CD8+ T cells. Genes upregulated in Thy1.1 cells are shown in gray color gradient, whereas those overexpressed in Lmo4-Thy1.1 cells are marked in blue gradient. Network was created using Cytoscape software and STRING database. Line thickness of network edges indicates the strength of data support for each interaction based on the information available in the STRING database. d Immunoblot of pSTAT3 and STAT3 (control) in Thy1.1 and Lmo4-Thy1.1 overexpressing T cells at 0, 0.5, and 2 h after adding IL-6 (left panel), IL-10 (middle panel) or IL-21 (right panel) to the cell culture. e q-PCR of Tcf7 (left panel), Zfp36 (middle left panel), Socs3 (middle right panel), and Junb (right panel) mRNA in Lmo4-Thy1.1 relative to Thy1.1 overexpressing T cells after culture with IL-6 or IL-21 for the indicated time. f Immunoblot of Lmo4-Thy1.1 CD8+ T cell lysates and anti-JAK1 immunoprecipitates blotted with JAK1 and LMO4 specific antibodies. Anti-IgG2a immunoprecipitates were used as controls. g Flow cytometry histograms showing IL21R expression in pmel-1 CD8+ T cells to assess the knockout efficiency compared to controls. h, i Percentages of CD62L+KLRG1- (h) and CD62L-KLRG1+ (i) splenic pmel-1 CD8+ T cells 5 d after transfer of either 105 Thy1.1+Il21rKO or Lmo4-Thy1.1+Il21rKO pmel-1 Ly5.1+ CD8+ T cells into wild-type mice infected with gp100-vv (n = 5 mice/group). Results are relative to Thy1.1+Thy1.2KO and Lmo4-Thy1.1+Thy1.2KO control cells, respectively. j Percentages of pmel-1 CD8+ T cells in the lymph nodes 5 d after transfer as in (h, i). k Cartoon depicting the potential interaction of LMO4 with the IL-21-STAT3 signaling pathway. LMO4 binds to JAK1, promoting STAT3 phosphorylation and the expression of target genes such as Tcf7, Socs3, Junb, and Zfp36 to boost memory responses (*P < 0.05; ** P < 0.001, h, i, unpaired two-tailed Student’s t-test; j, ANOVA test, b Kolmogorov–Smirnov test). (k) was created with BioRender.com
Fig. 6
Fig. 6
STAT3 is essential for LMO4-induced CD8+ T cell stemness and enhanced antitumor responses. a Experimental design to assess the impact of Stat3 versus Thy1.2 (control) deletion on Lmo4-induced stem-like T cell formation. b Flow cytometry histograms showing Thy1.2 (left panel) and STAT3 (right panel) to assess knockout efficiency compared to controls in pmel-1 CD8+ T cells. c, d Flow cytometry analysis (c) and percentages (d) of splenic pmel-1 CD8+ T cells 5 d after transfer of either 105 pmel-1 Ly5.1+ Thy1.1+Thy1.2KO, Thy1.1+Stat3KO, Lmo4-Thy1.1+Thy1.2KO or Lmo4-Thy1.1+Stat3KO CD8+ T cells into wild-type mice infected with gp100-vv (five mice per group). e, f Flow cytometry analysis (e) and percentages (f) of CD62L+CD44+ splenic pmel-1 T cells 30 d after transfer as in (c, d). g, h Tumor size (g) and survival curve (h) of B16KVP tumor-bearing wild-type mice after transfer of either 3.5 × 10⁵ pmel-1 Thy1.1+Thy1.2KO, Thy1.1+Stat3KO, Lmo4-Thy1.1+Thy1.2KO or Lmo4-Thy1.1+Stat3KO CD8+ T cells into wild-type mice treated with gp100-vv and IL-2. *P < 0.05, **P < 0.01 (d, f, unpaired two-tailed Student’s t-test, g, Wilcoxon rank-sum test; h, log-rank (Mantel–Cox) test). (a) was created with BioRender.com

References

    1. Finck, A. V., Blanchard, T., Roselle, C. P., Golinelli, G. & June, C. H. Engineered cellular immunotherapies in cancer and beyond. Nat. Med.28, 678–689 (2022). 10.1038/s41591-022-01765-8 - DOI - PMC - PubMed
    1. Gattinoni, L. et al. A human memory T cell subset with stem cell-like properties. Nat. Med.17, 1290–1297 (2011). 10.1038/nm.2446 - DOI - PMC - PubMed
    1. Gattinoni, L., Speiser, D. E., Lichterfeld, M. & Bonini, C. T memory stem cells in health and disease. Nat. Med.23, 18–27 (2017). 10.1038/nm.4241 - DOI - PMC - PubMed
    1. Gattinoni, L. et al. Wnt signaling arrests effector T cell differentiation and generates CD8+ memory stem cells. Nat. Med.15, 808–813 (2009). 10.1038/nm.1982 - DOI - PMC - PubMed
    1. Sabatino, M. et al. Generation of clinical-grade CD19-specific CAR-modified CD8+ memory stem cells for the treatment of human B-cell malignancies. Blood128, 519–528 (2016). 10.1182/blood-2015-11-683847 - DOI - PMC - PubMed

Publication types

MeSH terms