. 2024 Aug 8;15(8):574.
doi: 10.1038/s41419-024-06964-4.

Regulation of Zfp36 by ISGF3 and MK2 restricts the expression of inflammatory cytokines during necroptosis stimulation

Affiliations

Regulation of Zfp36 by ISGF3 and MK2 restricts the expression of inflammatory cytokines during necroptosis stimulation

Sahil Yadav et al. Cell Death Dis. .

Abstract

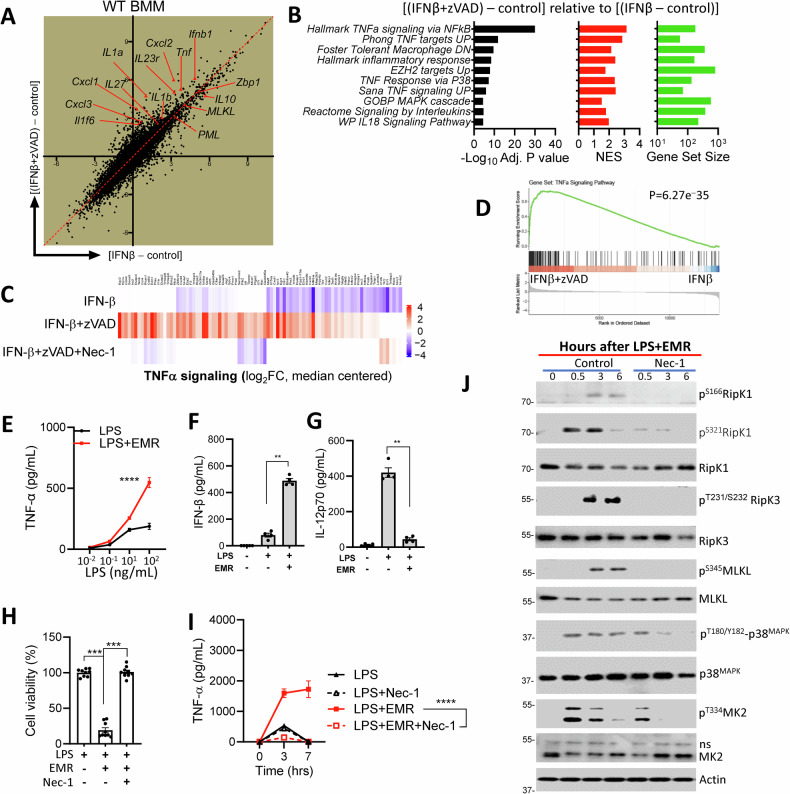
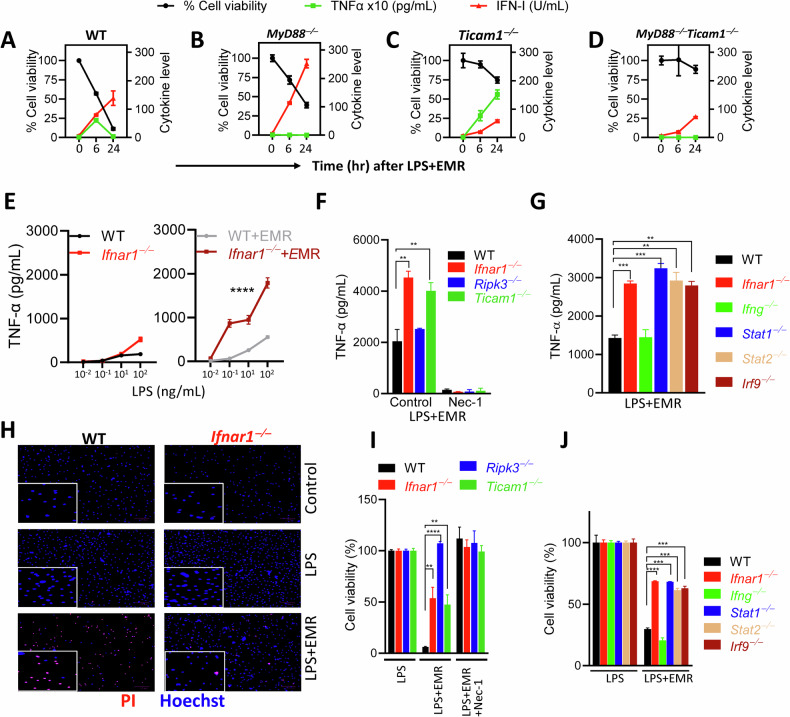
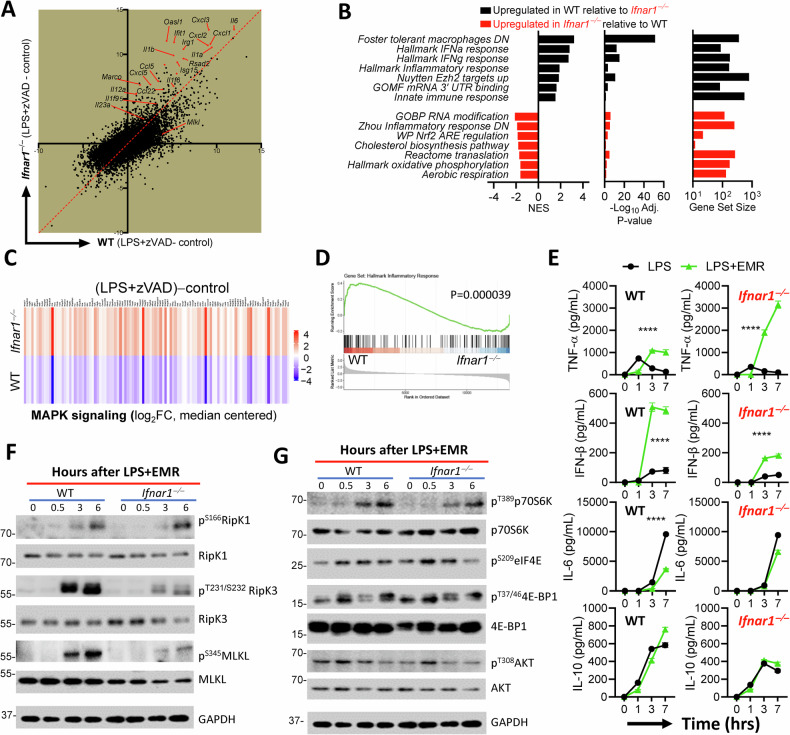
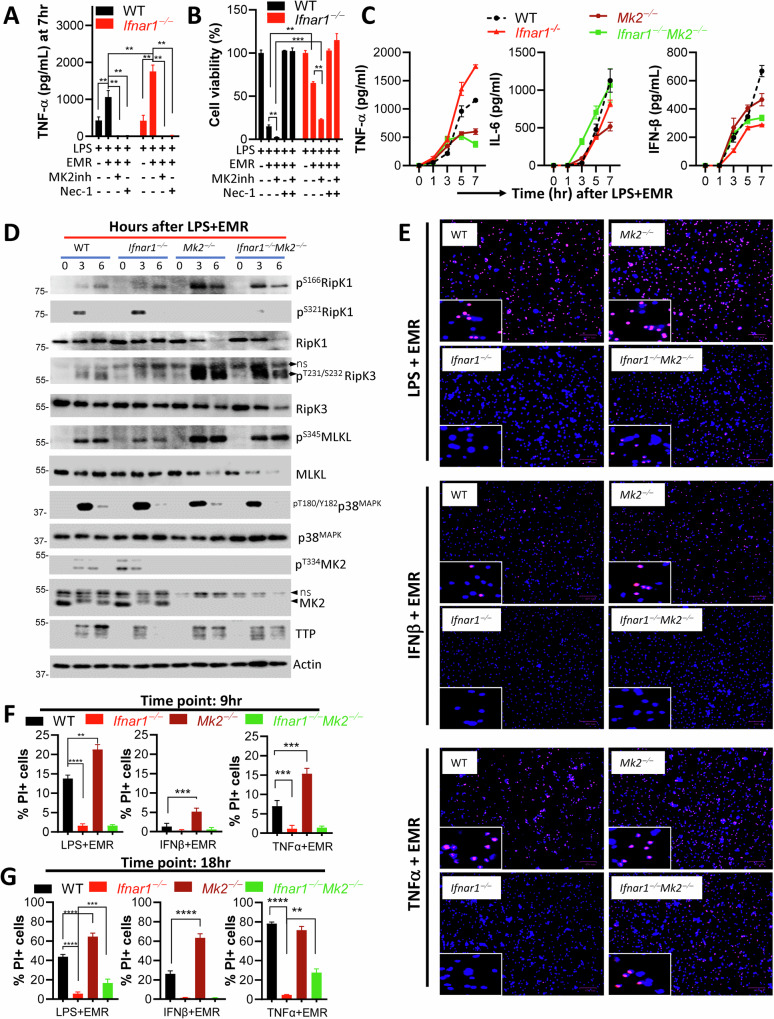
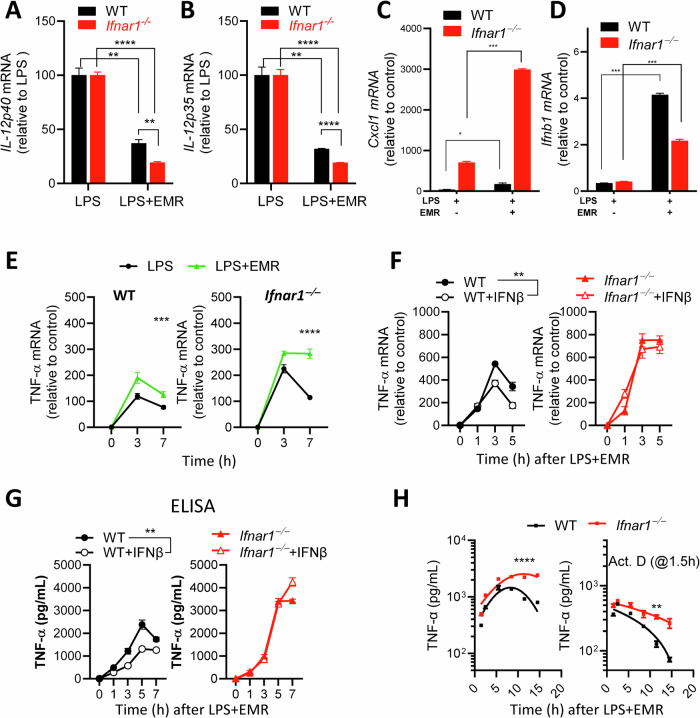
Necrosome activation following TLR- or cytokine receptor-signaling results in cell death by necroptosis which is characterized by the rupture of cell membranes and the consequent release of intracellular contents to the extracellular milieu. While necroptosis exacerbates various inflammatory diseases, the mechanisms through which the inflammatory responses are regulated are not clear. We show that the necrosome activation of macrophages results in an upregulation of various pathways, including the mitogen-activated protein kinase (MAPK) cascade, which results in an elevation of the inflammatory response and consequent expression of several cytokines and chemokines. Programming for this upregulation of inflammatory response occurs during the early phase of necrosome activation and proceeds independently of cell death but depends on the activation of the receptor-interacting protein kinase-1 (RipK1). Interestingly, necrosome activation also results in an upregulation of IFNβ, which in turn exerts an inhibitory effect on the maintenance of inflammatory response through the repression of MAPK-signaling and an upregulation of Zfp36. Activation of the interferon-induced gene factor-3 (ISGF3) results in the expression of ZFP36 (TTP), which induces the post-transcriptional degradation of mRNAs of various inflammatory cytokines and chemokines through the recognition of AU-rich elements in their 3'UTR. Furthermore, ZFP-36 inhibits IFNβ-, but not TNFα- induced necroptosis. Overall, these results reveal the molecular mechanism through which IFNβ, a pro-inflammatory cytokine, induces the expression of ZFP-36, which in turn inhibits necroptosis and halts the maintenance of the inflammatory response.


Conflict of interest statement

The authors declare no competing interests.

Figures

Fig. 1
Fig. 1. Necroptosis stimulation induces an inflammatory storm.
WT BMDMs were treated with IFNβ (100 U/mL), zVAD-fmk (50 µM), and Nec-1 (10 µM). At 6 h, differential gene expression and GSEA were performed on microarray data comparing WT BMDMs treated with IFNβ, IFNβ + zVAD, and IFNβ + zVAD+Nec1 (AD). Expression of TNFα was measured in the supernatants collected at 7 h after treating the WT BMDMs with EMR (10 µM) and different LPS concentrations (E). Expression of IFNβ, and IL-12p70 was measured in the supernatants collected at 7 h after treating the WT BMDMs with LPS (1 ng/mL) and EMR (10 µM) at 7 h (F, G). H, I WT BMDMs were stimulated with LPS (1 ng/mL), EMR (10 µM), Nec1-s (10 µM) and the impact on cell death was evaluated at 24 h by MTT (H). Secretion of TNFα was measured in supernatants collected at 7 h (I), and the activation of various proteins was evaluated by performing western blotting of cell extracts collected at various time intervals (J). Each experiment was repeated at least three times. (**P < 0.01, ***P < 0.001, ****P < 0.0001).
Fig. 2
Fig. 2. ISGF3 restricts TNFα expression during necroptosis stimulation.
AD WT, MyD88−/−, Ticam1−/−, and Myd88−/−Ticam1−/− BMDMs were treated with LPS (1 ng/mL) and EMR (10 µM). At various time intervals cell death was measured by MTT, and expression of TNFα and IFN-1 was measured in the supernatants by ELISA and bioassay respectively. E TNFα levels were measured in the supernatants of WT and Ifnar1−/− BMDMs at 7 h following treatment with different concentrations of LPS and EMR (10 µM). F, G TNFα levels were measured in the supernatants of BMDMs of various genotypes at 7 h following treatment with LPS (1 ng/mL), EMR (10 µM) and Nec-1 (10 µM). HJ Cell death was evaluated at 24 h by staining cells with PI and Hoechst (H) or by the MTT assay (I, J). Each experiment was repeated at least three times. (**P < 0.01, ***P < 0.001, ****P < 0.0001).
Fig. 3
Fig. 3. Modulation of the inflammatory response by Ifnar1 signaling during necroptosis stimulation.
WT and Ifnar1−/− BMDMs were treated with LPS (1 ng/mL) in the presence of zVAD-fmk (50 µM) for 6 h and differential gene expression and GSEA was performed on microarray data comparing WT BMDMs treated with LPS+zVAD with Ifnar1−/− BMDMs treated with LPS+zVAD (AD). E Expression levels of TNFα, IFNβ, IL-6, and IL-10 were measured in the supernatants collected after treating WT and Ifnar1−/− BMDMs for 7 h with LPS (1 ng/mL) and EMR (10 µM). F, G Western blot analysis was performed in cell extracts collected from WT and Ifnar1−/− BMDMs at different time intervals following treatment with LPS (1 ng/mL) and EMR (10 µM). Each experiment was repeated at least three times. (****P < 0.0001).
Fig. 4
Fig. 4. Induction of Zfp36 (TTP) by Ifnar1-signaling regulates TNFα expression and necroptosis.
A Expression of TTP was analyzed by western blotting of cell extracts collected from WT and Ifnar1−/− BMDMs at various time intervals following treatment with LPS (1 ng/mL) and/or EMR (10 µM). BE Expression of TNFα, IFNβ, and IL-6 was measured in the supernatants collected at different time intervals after the treatment of WT and Zfp36−/− BMDMs with LPS (1 ng/mL) (B), LPS (1 ng/mL)+EMR (10 µM) (C), IFNβ (10 ng/mL) (D), or IFNβ (10 ng/mL)+EMR (10 µM) (E). F, G Cell death was evaluated by staining of cells with Hoechst and PI at 24 h post treatment with LPS + /−EMR (F, G), IFNβ + /−EMR (F, H), TNFα ± EMR (F, I). Each experiment was repeated at least three times. (***P < 0.001, ****P < 0.0001).
Fig. 5
Fig. 5. Modulation of MK2 and TTP by Ifnar1-signaling during necroptosis stimulation.
WT and Ifnar1−/− BMDMs (AC) were stimulated with LPS (1 ng/mL) (A) or LPS (1 ng/mL)+EMR (10 µM) (B, C). Cell extracts were collected at various time intervals and the activation of signaling proteins was evaluated by western blot analysis. D WT and Mk2−/− BMDMs were stimulated with LPS (1 ng/mL)+EMR (10 µM). Cell extracts were collected at various time intervals and the expression of TTP was evaluated by western blot analysis. Each experiment was repeated at least three times.
Fig. 6
Fig. 6. Abrogation of MK2 restricts TNFα expression and augments necroptosis in Ifnar1−/− macrophages.
A, B WT and Ifnar1−/− BMDMs were stimulated with LPS (1 ng/mL), EMR (10 µM) and MK2 inhibitor (III, 5 µM), and the impact on TNFα secretion (A) and cell viability (B) was evaluated at 7 h and 24 h respectively. CG WT, Ifnar1−/−, Mk2−/−, and Ifnar1−/−Mk2−/− BMDMs were stimulated with LPS (1 ng/mL)+EMR (10 µM). Cytokine expression was evaluated at various time intervals by ELISA (C). Activation of signaling proteins was evaluated by western blot analysis of cell extracts collected at various time intervals (D). Cell death was evaluated by staining cells with Hoechst and PI following stimulation of WT, Ifnar1−/−, Mk2−/−, and Ifnar1−/−Mk2−/− BMDMs with LPS (1 ng/mL)+EMR (10 µM), IFNβ (10 ng/mL)+EMR (10 µM), and TNFα (50 ng/mL)+EMR (10 µM) at 9 h (F) or 18 h (E, G). Each experiment was repeated at least three times. (*P < 0.05, **P < 0.01, ***P < 0.001, ****P < 0.0001).
Fig. 7
Fig. 7. Ifnar1-signaling promotes the degradation of TNFα mRNA.
AD Expression of Il-12, Cxcl11, and Ifnb1 mRNA were measured by qRT-PCR analysis at 3 h following treatment of WT and Ifnar1−/− BMDMs with LPS (1 ng/mL) and EMR (10 µM). E, F Expression of Tnfa mRNA was measured by qRT-PCR analysis at various time intervals post treatment of WT and Ifnar1−/− BMDMs with LPS (1 ng/mL), EMR (10 µM), and IFNβ (10 ng/mL). G, H Expression of TNFα was measured by ELISA in the supernatants collected at different time intervals following treatment of WT and Ifnar1−/− BMDMs with LPS (1 ng/mL), EMR (10 µM), and IFNβ (10 ng/mL), or Actinomycin D (2 µM). Each experiment was at least repeated three times. (*P < 0.05, **P < 0.01, ***P < 0.001, ****P < 0.0001).
Fig. 8
Fig. 8. Ifnar1 signaling modulates inflammation during necrosome activation.
Necrosome signaling results in the phosphorylation of RipK1 which promotes the activation of the MAPK pathway independently of cell death leading to increased inflammatory response. Expression of type I interferon through TRIF-signaling results in the activation of the ISGF3 transcriptional complex which induces the expression of TTP which causes the degradation of mRNA of various inflammatory cytokines and chemokines. Thus, IFNAR1-signaling promotes cell death by necroptosis but limits the expression of excessive inflammation.

References

    1. Ginhoux F, Jung S. Monocytes and macrophages: developmental pathways and tissue homeostasis. Nat Rev Immunol. 2014;14:392–404. 10.1038/nri3671 - DOI - PubMed
    1. Rhoads JP, Major AS. How oxidized low-density lipoprotein activates inflammatory responses. Crit Rev Immunol. 2018;38:333–42. 10.1615/CritRevImmunol.2018026483 - DOI - PMC - PubMed
    1. Furman D, Campisi J, Verdin E, Carrera-Bastos P, Targ S, Franceschi C, et al. Chronic inflammation in the etiology of disease across the life span. Nat Med. 2019;25:1822–32. 10.1038/s41591-019-0675-0 - DOI - PMC - PubMed
    1. Green DR, Scott DW. Activation-induced apoptosis in lymphocytes. Curr Opin Immunol. 1994;6:476–87. 10.1016/0952-7915(94)90130-9 - DOI - PubMed
    1. Wilson NS, Dixit V, Ashkenazi A. Death receptor signal transducers: nodes of coordination in immune signaling networks. Nat Immunol. 2009;10:348–55. 10.1038/ni.1714 - DOI - PubMed

MeSH terms

Substances