. 2024 Aug 9;15(1):6792.
doi: 10.1038/s41467-024-50853-5.

Single cell dual-omic atlas of the human developing retina

Affiliations

Single cell dual-omic atlas of the human developing retina

Zhen Zuo et al. Nat Commun. .

Abstract

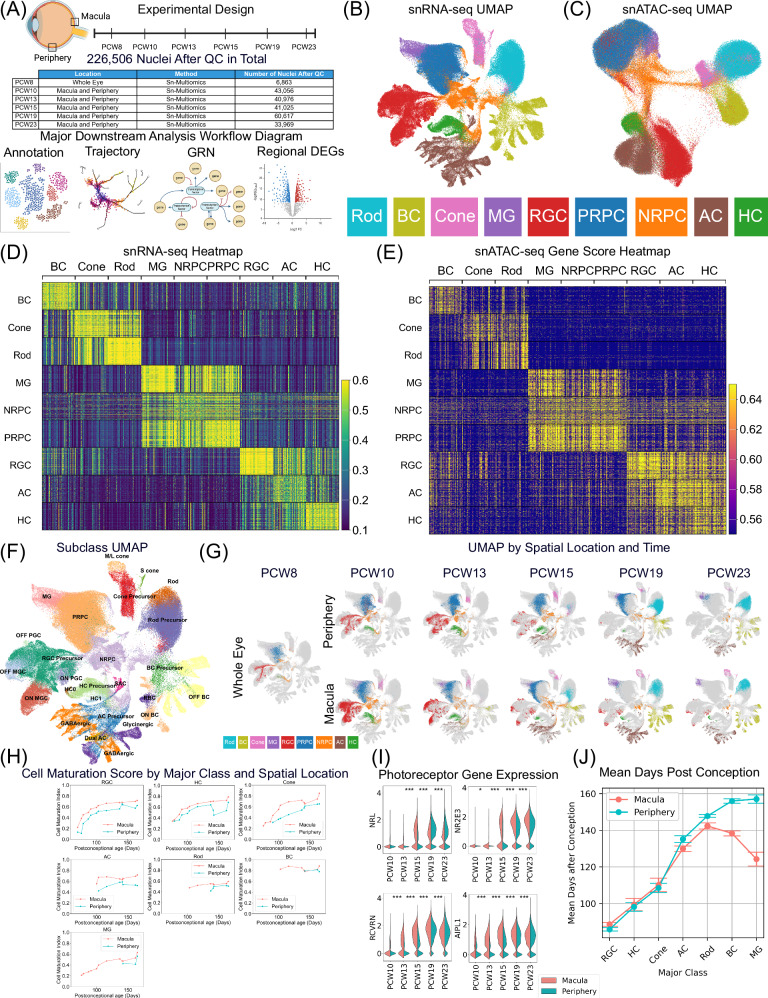
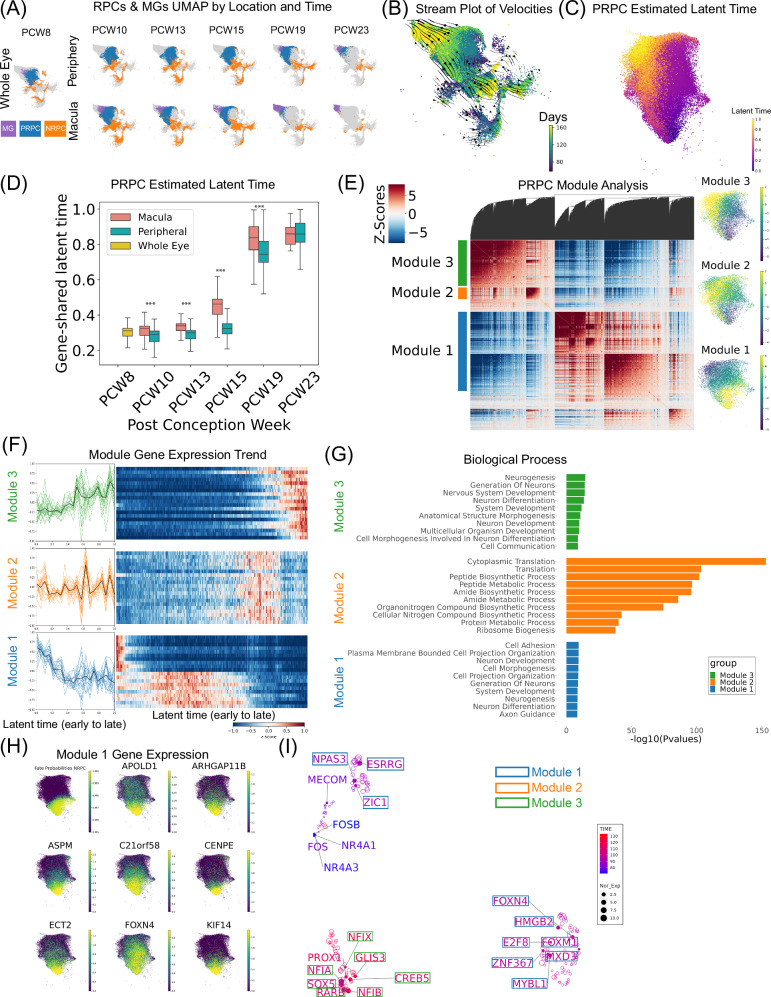
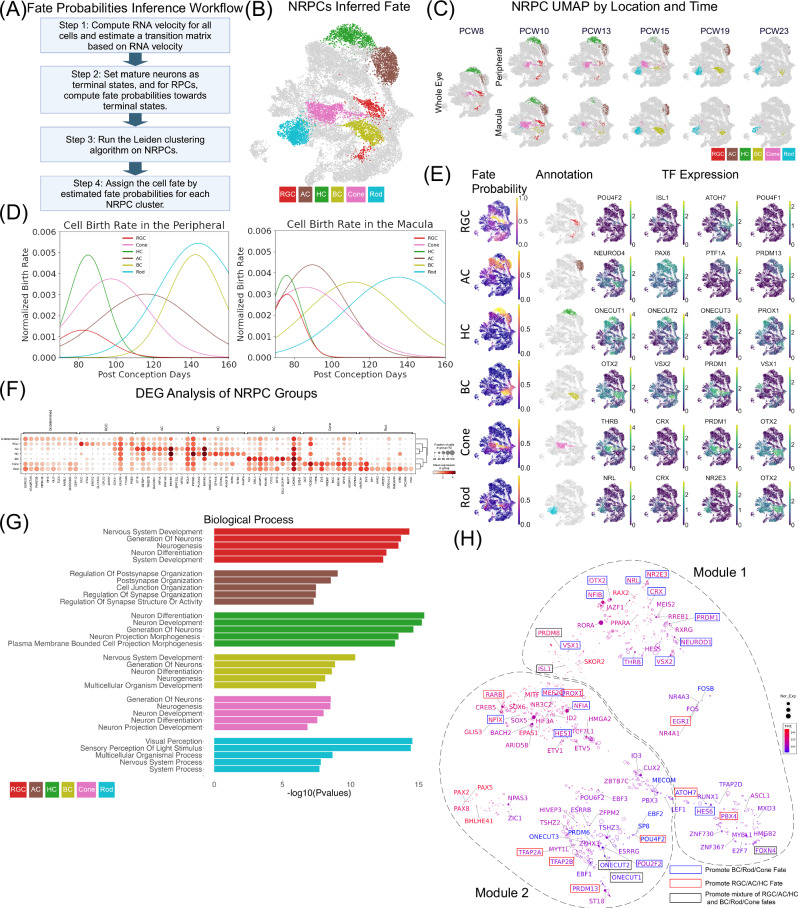
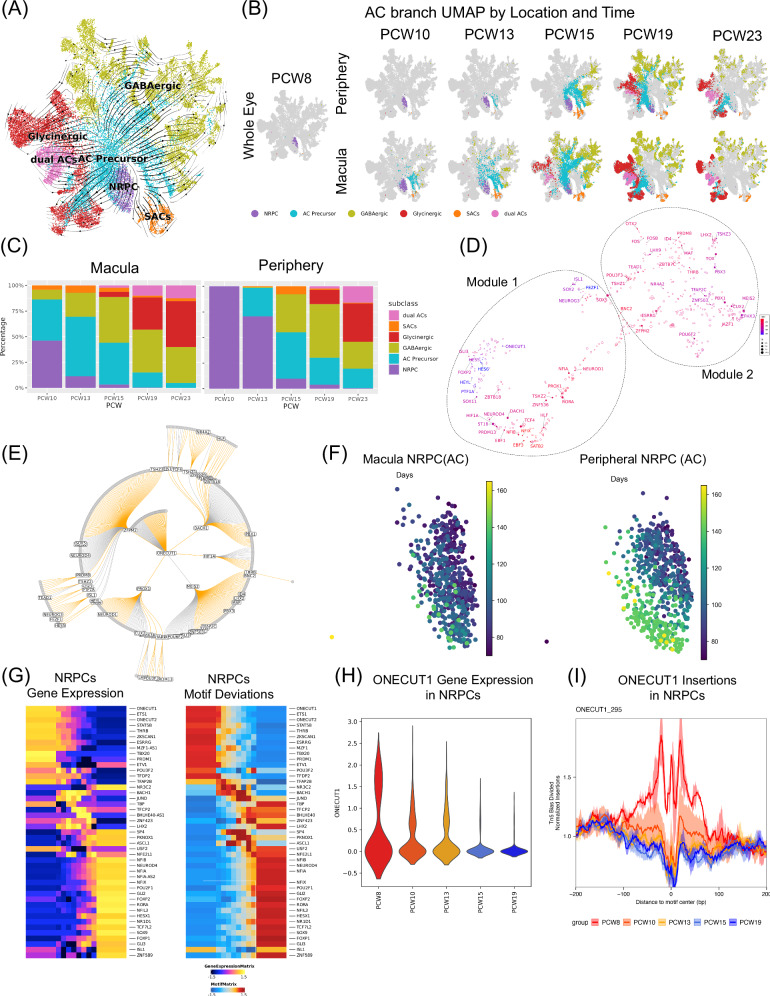
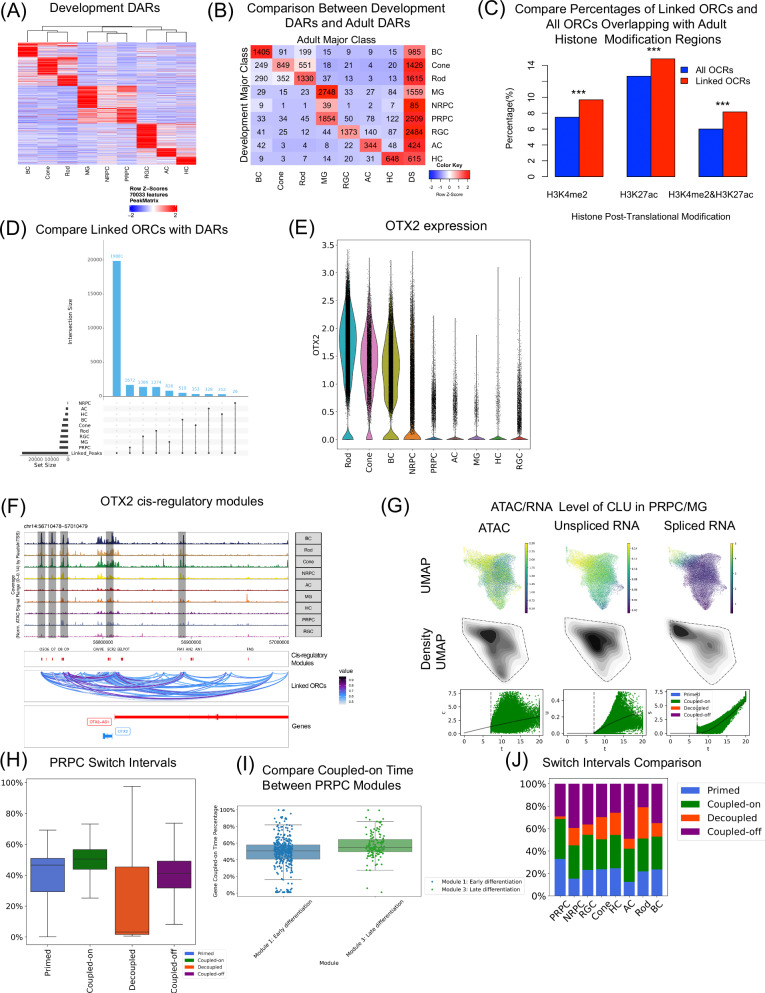
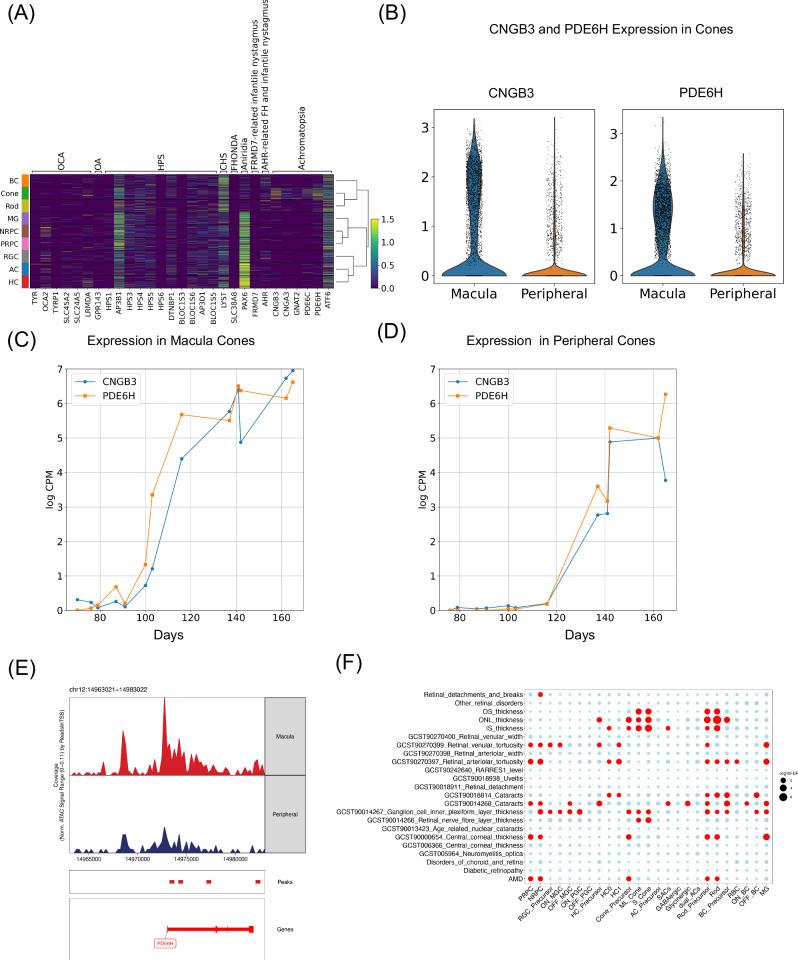
The development of the retina is under tight temporal and spatial control. To gain insights into the molecular basis of this process, we generate a single-nuclei dual-omic atlas of the human developing retina with approximately 220,000 nuclei from 14 human embryos and fetuses aged between 8 and 23-weeks post-conception with matched macular and peripheral tissues. This atlas captures all major cell classes in the retina, along with a large proportion of progenitors and cell-type-specific precursors. Cell trajectory analysis reveals a transition from continuous progression in early progenitors to a hierarchical development during the later stages of cell type specification. Both known and unrecorded candidate transcription factors, along with gene regulatory networks that drive the transitions of various cell fates, are identified. Comparisons between the macular and peripheral retinae indicate a largely consistent yet distinct developmental pattern. This atlas offers unparalleled resolution into the transcriptional and chromatin accessibility landscapes during development, providing an invaluable resource for deeper insights into retinal development and associated diseases.


Conflict of interest statement

The authors declare no competing interests.

Figures

Fig. 1
Fig. 1. Overview of the single-nuclei dual-omic atlas of the human developing retina.
A The study design of this work. Samples were collected from either (1) whole retina at PCW 8, or (2) macula and periphery of the same retina from PCW 10 to PCW 23. Subsequently, with a total of 28 samples from 14 human embryos and fetuses, gene expression and open chromatin profiling from the same nuclei was performed using the 10X Chromium sn-dual-omic ATAC + Gene Expression technology (Supplementary Data 1). The bottom panel shows analysis workflow diagrams. B UMAP of RNA-Seq data colored by annotated major classes. C UMAP of ATAC-Seq data colored by annotated major classes. D Heatmap of the top 50 differentially expressed genes across each annotated major class (Supplementary Data 3). Each row is a nucleus and each column is a marker gene. E Heatmap of ATAC gene scores for the differentially expressed genes (same genes and nuclei with the same order as Fig. 1D) grouped by annotated major class. F UMAP of RNA-Seq data colored by annotated subclasses. G UMAP is separated by location and clock time. Dots were colored by annotated major class, and gray dots are background nuclei that are not from the corresponding time and location pair. H Line graphs of cell maturation scores against sample age (PCW) for each major class, colored by the macula and periphery. The cell maturation score represents the degree of a cell’s similarity to cells in the corresponding adult data. I Violin plots of previously published photoreceptor-maturation gene expression between macula and periphery. To compare gene expression values temporally, two-sided overestimates variance t-test was applied to different PCW groups among 47,446 photoreceptors. The Benjamini-Hochberg procedure was applied. J Line graphs of average cell age for each major class, colored by macula and periphery. Cells were down-sampling equally by PCW groups, and cell age was defined as sample’s age. To calculate means and error bars, 41,984 RGCs, 9532 HCs, 9324 cones, 26,384 ACs, 38,167 rods, 20,996 BCs, and 6553 MGs were used. Error bars represent the 95% confidence intervals from two-tailed t-tests. The Benjamini-Hochberg procedure was applied. Source data are provided as a Source Data file. Panel A was created with BioRender.com and released under a Creative Commons Attribution-NonCommercial-NoDerivs 4.0 International license (https://creativecommons.org/licenses/by-nc-nd/4.0/deed.en).
Fig. 2
Fig. 2. PRPC gene expression reveals unique modules with distinct biological processes.
A UMAP of RPCs and MGs separated by spatial location and clock time. B UMAP of RPCs and MGs with a stream plot of estimated velocity vectors on top. C UMAP of PRPCs colored with estimated latent time. Smaller latent time indicates nuclei that are at an earlier developmental stage, while larger latent time indicates nuclei that are at a later developmental state. D Box plot of estimated latent time against PCW for PRPCs. The error bars represent the maximum and minimum values. The box spans the 25th to 75th percentile, with the line inside the box indicating the median. To test if PCW and latent time are correlated, two-sided Pearson’s product-moment correlation test was applied (adjusted p-value 0.000). For each PCW group, to test if macula and peripheral have the same average latent time, a two-sided Welch two sample t-test was applied. In total, 52,479 cells were used for the tests. The Bonferroni correction was applied for the tests. E Correlation heatmap of latent-time-correlated genes (2,860 genes in total and 2,055 can be further grouped into three distinct modules). UMAPs on the right represent module-specific cell module scores. F Gene expression trends of 20 genes within each gene module, ordered by latent time. Within each module, genes were sorted by gene module score, which represents the likelihood of a gene belonging to a module. For each module, the smoothed z-scores of gene expressions against latent time were plotted on the left. The black lines in the middle are averaged expression values. G Gene Ontology analysis of gene modules. To measure the significance of a functional term, the one-sided hypergeometric test was used with the input gene list (100 genes in each module). Top 10 significant biological processes were plotted with adjusted p-values from Benjamini-Hochberg procedure. H UMAP of PRPC estimated fate probability for NRPC fate. UMAPs for gene expression of Module 1 genes. I PRPC GRN showing key regulators. UMAP was built on similarities of regulation effects on target genes. TFs were labeled by gene module information and colored by gene expression weighted time. The sizes represent normalized gene expressions.
Fig. 3
Fig. 3. NRPCs with different fates show distinct gene expression patterns.
A Diagram of the NRPCs’ fate probability inference workflow. Cell fate probabilities for each type of neuron were estimated based on velocity, and cell fate was assigned after performing cell clustering. B UMAP of NRPCs colored by inferred fate. Cells for which cell fate cannot be determined are labeled in gray. The UMAP is specifically for NRPCs, distinguishing it from the global UMAP designed for all cells. C UMAP of NRPCs colored by inferred fate separated by region and time. D The cell birth rate was estimated for each NRPC group (grouped by inferred fate), within both the peripheral and macular regions. E UMAP of NRPCs colored by fate probability for each major class (first column), with annotated NRPCs for each fate (second column), and corresponding established TFs driving that fate (third to sixth columns). F Dot plot of differentially expressed genes for each NRPC group, with a different fate inferred. To identify differentially expressed genes, the two-side overestimates variance t-test was applied to different fate groups among 21,087 cells. The Benjamini-Hochberg procedure was applied. G Gene ontology analysis of differentially expressed genes for each NRPC group. To measure the significance of a functional term, the one-side hypergeometric test was used with the input gene list (100 genes in each module). Top 10 significant biological processes were plotted with adjusted p-values from Benjamini-Hochberg procedure. H GRN visualization of NRPC regulators. TFs were colored based on gene expression weighted time. The size of each dot represents the average normalized gene expression. UMAP was constructed based on the similarities of regulation effects on target genes. K-means clustering identified three clusters of TFs, and clustering information is depicted as a dashed line. The rectangle surrounding each TF indicates its confirmed impact on cell fate decisions, validated through loss-of-function animal experiments (Supplementary Data 8). A blue rectangle signifies that the TF promotes the BC/Rod/Cone fate, and a red rectangle indicates the promotion of the RGC/AC/HC fate. A black rectangle means the TF supports a mixture of two. A was created with BioRender.com.
Fig. 4
Fig. 4. AC Subclass formed from specific groups of NRPCs at different times.
A Stream plot of velocities on the AC branch UMAP. UMAP was calculated on AC branch cells only, which is different from global UMAP. Cells were colored by subclass representing AC progenitors, AC precursors, SACs, GABAergic ACs, Glycinergic ACs, and dual ACs. B AC branch UMAP colored with subclasses separated by spatial location and time. C Proportions of AC subclasses in the macula and periphery at different time points. D GRN visualization of AC regulators. TFs were colored by gene expression weighted clock time. The size of each dot is the average gene expression value in log space. All TFs are labeled with text, while the target genes that are not TFs are left unlabeled. The UMAP was built on similarities of regulatory effects on target genes. Two modules were identified with K-Nearest Neighbors (KNN) algorithm. E GRN subgraph for ONECUT1 in the AC branch, displaying first- and second-order ONECUT1 target genes. All TFs are labeled with text, while the target genes that are not TFs are left unlabeled. The edges are colored based on the TF regulatory interaction, with orange indicating positive regulation and gray indicating negative regulation. F UMAPs of AC progenitors separated by spatial locations and colored by days post-conception. G Heatmap for gene expression and motif deviations of AC progenitors. Cells were arranged according to the pseudotime inferred from the ATAC-seq trajectory. 45 features were selected based on the Pearson correlation between gene expression and motif deviation, with a threshold set greater than 0.3. H ONECUT1 gene expression in AC progenitors over time. I Tn5 bias-adjusted TF footprints for ONECUT1 motifs. Lines are colored by sample PCW groups.
Fig. 5
Fig. 5. Different epigenome-transcriptome interaction patterns regulate development.
A Heatmap showing DARs for each major class. Marker peaks were identified using the one-side Wilcoxon rank-sum test using the Benjamini-Hochberg correction, applying a threshold of false discovery rate <0.01 and a Log2 Fold Change >1. B Heatmap illustrating the count of identified developmental retinal DARs overlapping with adult retinal DARs. DS, representing “developmental-specific” DARs that do not match with any adult DARs. C The bar plot represents a comparative analysis of two distinct categories of adult histone modification regions. Two-sided two-sample tests for equality of proportions with continuity correction were performed to compare each pair of proportions. The Benjamini-Hochberg procedure was applied. Adjusted p-values are smaller than 2.2e-16. D Upset plot comparing major-class marker peaks and linked peaks. The set size represents the number of peaks within each category. The intersection size represents the number of peaks for the corresponding combination. E OTX2 normalized gene expression violin plot by major class. F Genome browser displaying chromatin accessibility around cis-regulatory modules (identified in the mouse by Chan C. S et al.) located near OTX2. The cis-regulatory modules are denoted by red vertical bars in the “cis-regulatory modules” panel. The “Linked ORCs” section illustrates open chromatin regions linked to genes. The transparent black-box-labeled peak indicates the overlap between identified linked ORCs and reported cis-regulatory modules. G UMAPs colored by levels of chromatin openness, unspliced mRNA and spliced mRNA for CLU in PRPCs. Those levels were plotted in density plot and line chart against gene time. H Box plots summarizing the lengths of each of the four cell states across all fitted genes for PRPCs. In total, 1790 genes were fitted among 52,479 cells. The bars represent the minimum, median, and maximum and the box spans the 25th to 75th percentile. (same for (I)). I Box plot comparing the percentage of coupled-on time within gene time between PRPC modules (Fig. 2E). A two-side Welch two-sample t-test was applied to compare coupled-on time percentages between 378 module 1 genes and 140 module 3 genes. The adjusted p-value is 1.091e-07 with Benjamini-Hochberg applied. J Bar plot summarizing the percentage of the four cell states of all major classes.
Fig. 6
Fig. 6. Gene expression comparison of macular and peripheral retina.
A Marker gene expression of the RA pathway, including ALDH1A1, ALDH1A2, CYP26A1, CYP26C1, FGF8, and FGF9. For each gene, both UMAPs (Macula and Periphery information labeled in the caption) and bar charts displaying the proportion of cells with non-zero gene expressions were plotted. B Line chart showing the natural log-transformed counts per million of TBX5, VAX2, ALDH1A1, ALDH1A2, ALDH1A3, CYP26A1, CYP26B1, and CYP26C1 in macula and periphery over time. C Bar charts displaying the proportion of cells with non-zero gene expressions for previously reported macula development candidate genes. D Heatmap of top 10 PRPC DEGs identified in the macula and periphery. The first half of genes are enriched in the macula and the second half of genes are enriched in the periphery. E Heatmap showing the number of DEGs identified among all major classes. The ones on the diagonal are genes identified as DEGs exclusively in one major class, while the rest are overlapped DEGs identified in more than one major class.
Fig. 7
Fig. 7. Comparison of macular hypoplasia related gene expression in macula and periphery.
A Heatmap of genes associated with typical and atypical foveal hypoplasia. OCA (oculocutaneous albinism); OA (ocular albinism); HPS (Hermansky–Pudlak syndrome); CHS (Chediak–Higashi syndrome); FHONDA (foveal hypoplasia, optic nerve decussation defects and anterior segment dysgenesis). B Violin plot of CNGB3 and PDE6H expression in cones, colored by macula and periphery. C Line chart of CNGB3 and PDE6H log-transformed counts per million in the macular cones. D Line chart of CNGB3 and PDE6H log-transformed counts per million in the peripheral cones. E Peak accessibility around PDE6H in the macular and peripheral cones. F The subclass enrichment of 23 eye-related GWAS traits based on gene expression from snRNA-seq data. AMD (age-related macular degeneration); IS (inner segment); ONL (outer nuclear layer); OS (outer segment). To test GWAS traits enrichment, a two-sided F-test was applied to compute the p-values. The Benjamini-Hochberg procedure was applied. Significant enrichment is highlighted in red (FDR < 0.05).

References

    1. Lukowski, S. W. et al. A single‐cell transcriptome atlas of the adult human retina. EMBO J.38, e100811 (2019). 10.15252/embj.2018100811 - DOI - PMC - PubMed
    1. Li, J. et al. Integrated multi-omics single cell atlas of the human retina. Preprint at bioRxiv10.21203/2Frs.3.rs-3471275/2Fv1 (2023).
    1. Centanin, L. & Wittbrodt, J. Retinal neurogenesis. Development141, 241–244 (2014). 10.1242/dev.083642 - DOI - PubMed
    1. Turner, D. L. & Cepko, C. L. A common progenitor for neurons and glia persists in rat retina late in development. Nature328, 131–136 (1987). 10.1038/328131a0 - DOI - PubMed
    1. Holt, C. E., Bertsch, T. W., Ellis, H. M. & Harris, W. A. Cellular determination in the Xenopus retina is independent of lineage and birth date. Neuron1, 15–26 (1988). 10.1016/0896-6273(88)90205-X - DOI - PubMed

Substances