. 2024 Aug 8;15(1):6778.
doi: 10.1038/s41467-024-51074-6.

Multi-omics characterization of the monkeypox virus infection

Affiliations

Multi-omics characterization of the monkeypox virus infection

Yiqi Huang et al. Nat Commun. .

Abstract

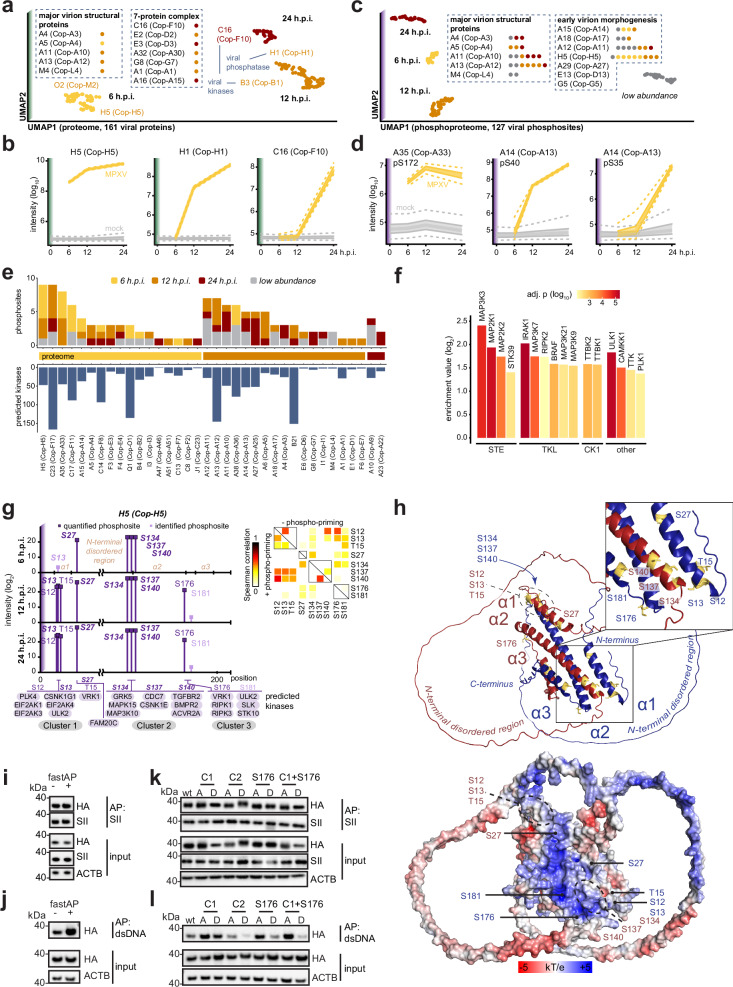
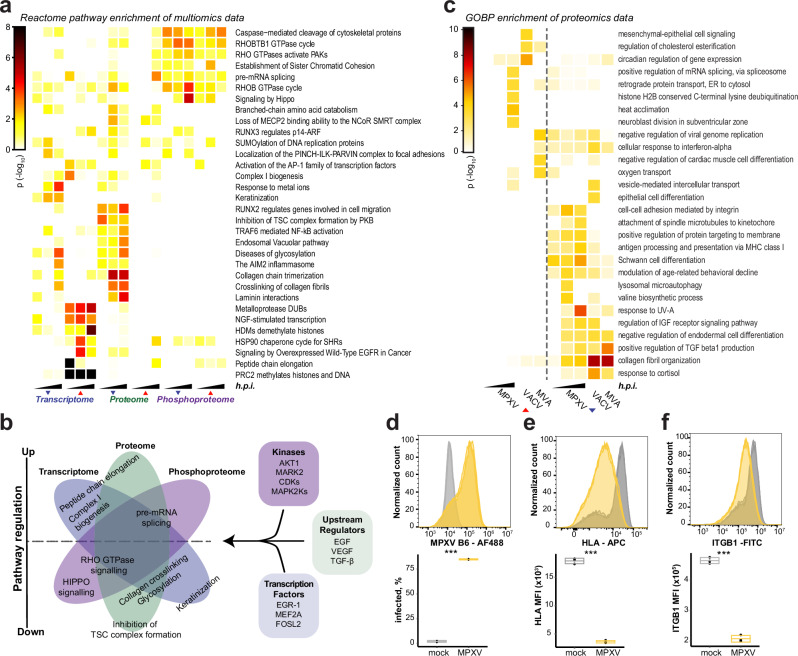
Multiple omics analyzes of Vaccinia virus (VACV) infection have defined molecular characteristics of poxvirus biology. However, little is known about the monkeypox (mpox) virus (MPXV) in humans, which has a different disease manifestation despite its high sequence similarity to VACV. Here, we perform an in-depth multi-omics analysis of the transcriptome, proteome, and phosphoproteome signatures of MPXV-infected primary human fibroblasts to gain insights into the virus-host interplay. In addition to expected perturbations of immune-related pathways, we uncover regulation of the HIPPO and TGF-β pathways. We identify dynamic phosphorylation of both host and viral proteins, which suggests that MAPKs are key regulators of differential phosphorylation in MPXV-infected cells. Among the viral proteins, we find dynamic phosphorylation of H5 that influenced the binding of H5 to dsDNA. Our extensive dataset highlights signaling events and hotspots perturbed by MPXV, extending the current knowledge on poxviruses. We use integrated pathway analysis and drug-target prediction approaches to identify potential drug targets that affect virus growth. Functionally, we exemplify the utility of this approach by identifying inhibitors of MTOR, CHUK/IKBKB, and splicing factor kinases with potent antiviral efficacy against MPXV and VACV.


Conflict of interest statement

V.G., and A. Pic. are co-inventors on a patent application related to the inhibition of intracellular pathogen uptake by ACHP. The rest of the authors have no competing interests.

Figures

Fig. 1
Fig. 1. Multi-omics analysis of MPXV-infected primary human foreskin fibroblasts.
ag Transcriptomes, proteomes, and phosphoproteomes of HFFs infected with MPXV (MOI 3) were profiled at 0, 6, 12, or 24 hours post-infection (h.p.i.). Bayesian linear modeling was used to determine the statistical significance of observed changes on distinct omics layers relative to time-matched mock controls. a Schematic representation of the multi-omics profiling of the MPXV-infected primary HFFs. b, d, f Numbers of significantly changed host transcripts b, proteins d, or phosphosites f at the indicated times after MPXV infection. In d, Euler diagram shows the number proteins significantly changed by MPXV (this study), VACV, and MVA infection. c, e, g Scatterplots depicting fold-changes of the abundance of transcripts c, proteins e, or phosphosites g between MPXV-infected HFFs and timepoint-matched mock controls. Statistically significant events are yellow (at either time point) or orange (at both time points), viral transcripts, proteins, or phosphosites are black. Histones c, collagens e, or Serine and arginine Rich Splicing Factors (SRSFs) g are crosses. Diamonds: log2 fold change was truncated to fit into the plot. h Expression levels, as measured by RT–qPCR, of MPXV G2 and host transcripts relative to RPLP0 in MPXV-infected (MOI 3) HFFs at indicated time points. Error bars: mean and standard deviation (Two-sided Welch’s t-test, unadjusted p-value, n = 4 independent experiments). i Abundances of MPXV protein C19 and human proteins as determined by proteomic analysis of MPXV-infected HFFs. j Expression of MPXV protein C19 and human proteins in MPXV-infected HFFs (n = 3 independent experiments). k Abundance of CTNNB1 phospho-S552 and MAPK14 phospho-T180/Y182 and abundance of CTNNB1 and MAPK14 proteins as determined by proteomics analysis. l Representative western blots showing abundance changes of the phosphorylated and total CTNNB1 and P38 (MAPK11-14) in MPXV-infected HFFs (n = 3 independent experiments). For i and k, the line indicated the modeled median, and the shaded region and the dotted line represented 50% and 95% credible intervals, respectively (n = 5 independent experiments). Bayesian linear model-based unadjusted two-sided p-value: *: p-value ≤ 0.05; **: p-value ≤ 0.01; ***: p-value ≤ 0.001; ****: p-value ≤ 0.0001. Source data are provided as a Source Data file.
Fig. 2
Fig. 2. Viral protein dynamics in the multi-omics analysis of MPXV-infected HFFs.
a-e Classification of the viral proteins and phosphosites according to their temporal kinetics. a Two-dimensional UMAP of the viral protein abundances in proteomes of HFFs infected with MPXV. b Examples of viral proteins. Line: modeled median, shaded region and dotted line: 50% and 95% credible intervals, respectively (n = 5 independent experiments). c Similar to (a), but phosphosite information was used. d Similar to (b) but phosphosites on viral proteins. e Viral phosphosites (top) on individual viral proteins (middle). Bottom: numbers of host kinases, motifs identified at the phosphosites of viral proteins (log2 score > 95% site percentile). f Enriched host kinases at the viral phosphosites relative to all detected phosphosites (log2 enrichment score > 0, FDR-adj. p ≤ 0.01 in Fisher’s exact tests). X-axis: groups of kinases. g Phosphosites detected on the viral protein H5 along the top host kinase motifs. Sites also identified in VACV, are in bold italics. Right: Spearman rank correlations between host kinases with recognition motifs at individual phosphosites (with or without phospho-priming). h Top: In silico predicted structure of the MPXV H5 dimer by AlphaFold. Detected phosphosites are highlighted in gold. Bottom: Electrostatic surface potential analysis of non-phosphorylated MPXV H5 dimers (top). i Cell lysates of HEK293T cells transfected with HA- and SII-tagged H5 were left untreated or treated with phosphatase (fastAP) and used for SII affinity purification (AP), followed by western blotting. j HA-H5 expressing cell lysates were treated as described in (i) and used for AP using dsDNA as bait. k, l The serines (S) or threonins (T) in cluster 1(S12, S13, T15; C1), cluster 2 (S134, S137, S140; C2), cluster 3 (S176), or cluster 1 + S176 were mutated into alanine (A) or aspartic acid (D) in HA-tagged H5, and their binding to SII-H5 k or to dsDNA l was tested. SII: StrepII tag. n = 3 independent experiments for i-l. Source data are provided as a Source Data file.
Fig. 3
Fig. 3. Systems analyzes of the MPXV multi-omics dataset.
a The significant hits from individual layers of the multi-omics dataset were used in an integrative pathway enrichment analysis. Significantly enriched Reactome pathways (Fisher’s exact tests, unadjusted p ≤ 0.05 in at least two conditions) are depicted. b Pathways that are differentially activated in MPXV infected cells in different omics layers, as well as a subset of relevant modulators, extracted from Supp. Fig. 3 (ac). c Gene set enrichment analysis of significantly changed proteins in MPXV (this study), VACV, and MVA. Graph shows GOBP terms (Fisher’s exact tests, unadjusted p < 0.001). d Intracellular FACS analysis of MPXV B6 protein in HFF cells that were left uninfected or infected with MPXV (MOI: 3) for 24 h. The histograms show fluorescence intensity, and the box plot shows the percentage of infected cells as defined by Supp. Fig. 3e. e, f As (d) but cells were analyzed for cell surface abundance of HLA (e) and ITGB1 (f). The histograms show fluorescence intensity, and the box plots show the median fluorescence intensities of the indicated protein. df The bounds of box represent lower quartile (Q1) and upper quartile (Q3), and center bar represents median (Q2). ***: p-value ≤ 0.001 (n = 3 independent experiments, unpaired two-sided student t-test). Source data are provided as a Source Data file.
Fig. 4
Fig. 4. Data-driven prediction of anti-MPXV drugs.
a-e A network diffusion-based host-directed drug repurposing pipeline was used to predict drugs and drug targets associated with the MPXV infection-elicited molecular fingerprints at individual time points of distinct omics layers. a Schematic representation of the drug and drug target prediction pipeline based on network diffusion. Multiscale interactome expanded with an additional set of drugs obtained from the drug repurposing hub was used for all graph-based analyzes and predictions (see methods). b Spearman rank correlation of drugs and drug targets, ranked according to the network diffusion-based p-values from individual time points of the measured omics layers, is depicted as a measure of predictions’ orthogonality. c, d Numbers c and the overlap d of distinct drugs (top) and drug targets (bottom) significantly associated with individual time points of the measured omics layers according to the network diffusion model. e The local biological neighborhood of Batimastat and its drug target MMP8, predicted as significantly associated with the MPXV infection-elicited molecular fingerprint on the level of proteome at 24 hours post-infection. f The predicted drug targets were used in an integrative pathway enrichment analysis (similar to (Fig. 3a)). Significantly enriched Reactome pathways (Fisher’s exact tests, unadjusted p < 0.01) are depicted. Source data are provided as a Source Data file.
Fig. 5
Fig. 5. Identification and testing of MPXV and VACV inhibitors.
a UMAP of small molecule drugs used in the proof of concept drug screens - the projection was performed using the mechanism of action data obtained from ChemicalsChecker. Densities of drugs in the expanded multiscale interactome (contour lines) and across the ChemicalsChecker database (shades of gray) are depicted for comparison. b, c Antiviral assays were performed on hTERT-HFFs, pre-treated with indicated compounds 4 hours before infection with MPXV (MOI 1) b or VACV-GFP (MOI 0.1) c for 24 hours. Scatterplots depict the drug-dependent reduction in MPXV-infection-induced CPE b or VACV-GFP reporter virus growth c versus the growth rate of cells in uninfected conditions. All values are expressed as percentages relative to vehicle controls. Dark gray/black spots represent significantly effective drugs (linear model-based unadjusted two-sided p-value < 0.05; see methods), and the yellow cross indicates the drug is cytotoxic (average relative cell growth <0.75 after drug treatment in uninfected conditions). Multiple concentrations were tested for each drug, and Supplementary data 10 indicates the plotted concentration. d, e hTERT-HFF cells treated with DMSO or ACHP (5 µM) for 4 hours and infected with MPXV (d) or VACV-GFP (e). The images were obtained 24 hours after the infection. Scale bar = 400 µm. n = 3 independent experiments. f hTERT-HFF cells were pre-treated for 4 hours with indicated compounds at increasing concentrations (see methods) and infected with MPXV (MOI 1) for 24 hours. Expression levels of MPXV G2R mRNA relative to the housekeeper control RPLP0 are depicted relative to vehicle (DMSO) controls as measured by RT–qPCR. g Infectious viral titers in the supernatants of hTERT-HFF cells from (f), which were treated with the indicated compounds at 1 µM concentration, as quantified by plaque assay. f, g Data are represented as mean +/- sd from 3 independent biological replicates. Statistical analysis was performed using a two-sided paired student t-test for (f), and two-sided unpaired student t-test for (g). h Antiviral drugs potentially targeting pathways identified in our study. The color indicates the inhibitors used (red) and the putative pathway targeted to restrict MPXV. Pfu: plaque forming unit. *: p-value ≤ 0.05; **: p-value ≤ 0.01; ***: p-value ≤ 0.001. Source data are provided as a Source Data file.

References

    1. Breman, J. G. et al. Human monkeypox, 1970-79. Bull. World Health Organ58, 165–182 (1980). - PMC - PubMed
    1. Wang, L. et al. Genomic annotation and molecular evolution of monkeypox virus outbreak in 2022. J. Med. Virol. 10.1002/jmv.28036 (2022). - PMC - PubMed
    1. Isidro, J. et al. Phylogenomic characterization and signs of microevolution in the 2022 multi-country outbreak of monkeypox virus. Nat. Med.28, 1569–1572 (2022). 10.1038/s41591-022-01907-y - DOI - PMC - PubMed
    1. Otu, A., Ebenso, B., Walley, J., Barceló, J. M. & Ochu, C. L. Global human monkeypox outbreak: atypical presentation demanding urgent public health action. Lancet Microbe3, e554–e555 (2022). 10.1016/S2666-5247(22)00153-7 - DOI - PMC - PubMed
    1. Babkin, I. V., Babkina, I. N. & Tikunova, N. V. An update of orthopoxvirus molecular evolution. Viruses14, 388 (2022). 10.3390/v14020388 - DOI - PMC - PubMed