. 2024 Aug 8;15(1):6779.
doi: 10.1038/s41467-024-51156-5.

Lineage-specific canonical and non-canonical activity of EZH2 in advanced prostate cancer subtypes

Affiliations

Lineage-specific canonical and non-canonical activity of EZH2 in advanced prostate cancer subtypes

Varadha Balaji Venkadakrishnan et al. Nat Commun. .

Abstract

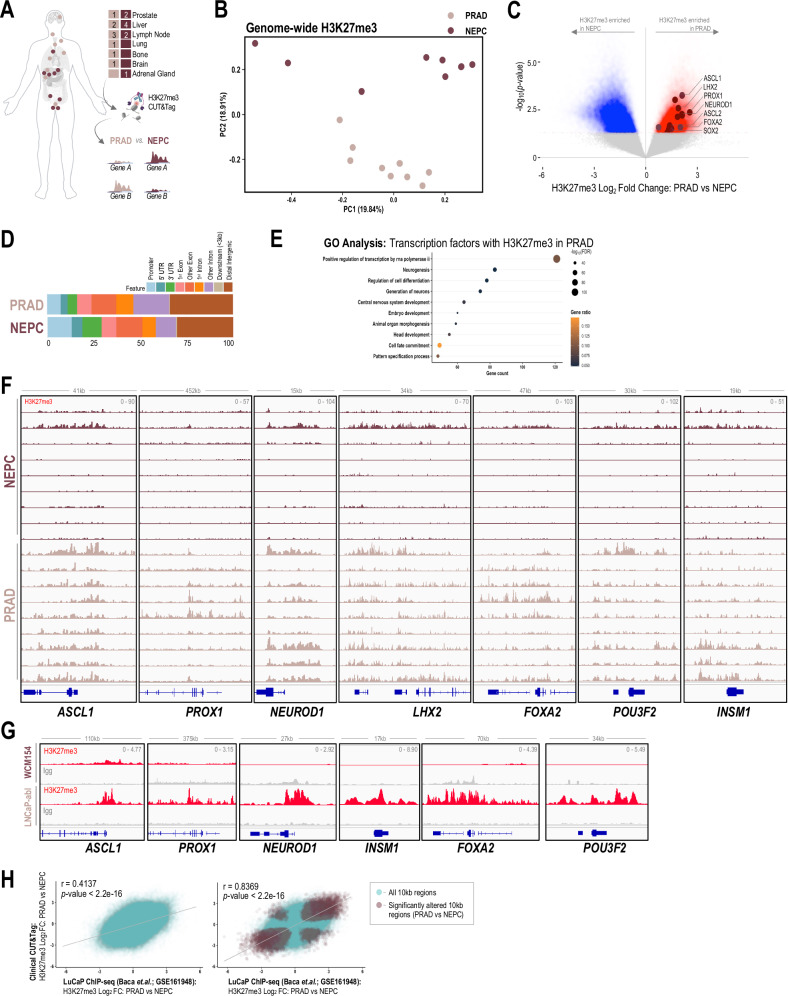
Enhancer of zeste homolog 2 (EZH2) is a histone methyltransferase and emerging therapeutic target that is overexpressed in most castration-resistant prostate cancers and implicated as a driver of disease progression and resistance to hormonal therapies. Here we define the lineage-specific action and differential activity of EZH2 in both prostate adenocarcinoma and neuroendocrine prostate cancer (NEPC) subtypes of advanced prostate cancer to better understand the role of EZH2 in modulating differentiation, lineage plasticity, and to identify mediators of response and resistance to EZH2 inhibitor therapy. Mechanistically, EZH2 modulates bivalent genes that results in upregulation of NEPC-associated transcriptional drivers (e.g., ASCL1) and neuronal gene programs in NEPC, and leads to forward differentiation after targeting EZH2 in NEPC. Subtype-specific downstream effects of EZH2 inhibition on cell cycle genes support the potential rationale for co-targeting cyclin/CDK to overcome resistance to EZH2 inhibition.


Conflict of interest statement

H.B. has served as consultant/advisory board member for Janssen, Astra Zeneca, Merck, Pfizer, Amgen, Astellas, Sanofi Genzyme, Novartis, Bayer, Daiichi Sankyo, and has received research funding (to institution) from Janssen, Bristol Myers Squibb, Circle Pharma, Daiichi Sankyo, Novartis. L.P. is an employee at Loxo Oncology@Lilly, this work was completed prior to her employment at Loxo, she is acting on her own, and these endeavors are not in any manner affiliated with Loxo Oncology@Lilly. The remaining authors declare no competing interests.

Figures

Fig. 1
Fig. 1. NEPC preclinical modes show modest response to EZH2i.
A Prostate cancer models (Top panel – AR-driven PRAD; bottom panel – AR-indifferent NEPC) were treated with vehicle (Veh; DMSO) or 5 μM of tazemetostat (Taz). CellTiter-Glo® luminescent cell viability assay was performed after 6 days of treatment. Columns, means of values (n = 5; 22Rv1, n = 4); white, vehicle treatment; red, tazemetostat treatment; bars, SEM values; –, p-value > 0.05 (not significant); *, p-value < 0.05, all statistical analyses used Wilcoxon two-sided tests. B (top) WCM12, NEPC patient-derived xenograft (PDX) model was grown subcutaneously in SCID mice. Mice were randomized into treatment groups when tumor volume reached 100 mm3. Mice were treated with vehicle (n = 4) or 250 mg/kg b.i.d. of tazmetostat (EPZ, n = 5) for 18 days. Two mice in the EPZ group were euthanized before experimental endpoint adhering to animal welfare guidelines. Connected dots, means of values obtained from independent biological replicates; gray, vehicle treatment; red, tazemetostat treatment; bars, SEM values. (bottom) MSKPCa4, NPEC organoid-derived xenograft model were grown subcutaneously in both flanks of the mice and randomized into treatment groups when tumor volume reached approximately 200 mm3. Mice were treated with vehicle (n = 5) or 150 mg/kg GSK126 (n = 5) for 6 weeks. Connected dots, means of values obtained from independent biological replicates; gray, vehicle treatment; magenta, GSK126 treatment; bars, SEM values. C Western blot analysis (Top panel – AR-driven PRAD; bottom panel – AR-indifferent NEPC) in a parallel experiment of (A) confirming the downregulation of H3K27me3 upon tazemetostat treatment in vitro. Blots were reprobed for total-histone-H3 as a loading control. Representative western blot from three independent experiments is shown. D Western blot analysis of tumor samples from (B - top) confirming the downregulation of H3K27me3 upon tazemetostat treatment in vivo. Blots were reprobed for total-histone-H3 and β-actin as loading controls. Representative western blot from two independent experiments is shown. E Immunohistochemistry of tumor samples from (B – bottom) confirming the downregulation of H3K27me3 upon GSK126 treatment in vivo. Scale bar = 100 μm.
Fig. 2
Fig. 2. PRC2 targets are distinct in PRAD and NEPC.
A Schematic of rapid autopsy sites of NEPC and castrationresistant PRAD and workflow of H3K27me3 CUT&Tag and downstream differential analysis. Figure 2/panel A Created with BioRender.com released under a Creative Commons Attribution-NonCommercial-NoDerivs 4.0 International license. B H3K27me3 fragment per million (FPM) reads were calculated genome-wide for 10 kb bins for each sample. Principal component analysis of the FPM values from PRAD and NEPC samples across two dimensions; pale pink, castration resistant PRAD; burgundy, NEPC. C Volcano plot with differentially enriched 10 kb bins of H3K27me3 FPM values in NEPC or castration resistant PRAD samples; blue, H3K27me3 regions enriched in NEPC samples; red, H3K27me3 regions enriched in castration resistant PRAD samples; burgundy, NE-lineage transcription factors with enrichment of H3K27me3 at either promoter or gene body. D Bar plot showing distribution of subtype specific H3K27me3 enriched in castration resistant PRAD or NEPC; light blue, promoter; blue, 5’ untranslated regions (UTR); green, 3’ UTR; pale pink, 1st exon; coral, other exon; orange, 1st exon; violet, other intron; gray, downstream ( < 3 kb); brown, distal intergenic. E Gene ontology analysis of transcription factors with enrichment of H3K27me3 in the promoter of gene body from in castration resistant PRAD (C) with p-value < 0.05 and Log2FoldChange > 0; size, -log10FDR; orange-black gradient, gene ratio. F Screenshots from Integrative Genomics Viewer (IGV) of CUT&Tag H3K27me3 levels in castration resistant PRAD and NEPC and the genomic loci of indicated NE-lineage genes (ASCL1, PROX1, NEUROD1, LHX2, FOXA2, POU3F2, INSM1); pale pink, castration resistant PRAD samples; burgundy, NEPC samples. G Screenshots from Integrative Genomics Viewer (IGV) of CUT&RUN H3K27me3 levels in LNCaP-abl and WCM154 and the genomic loci of indicated NE-lineage genes; gray, IgG; red, H3K27me3. H Pearson’s product-moment correlation of Log2FoldChange of H3K27me3 FPM values in PRAD (n = 9) compared to NEPC (n = 9) in Clinical CUT&Tag in this study vs LuCaP ChIP-Seq (PRAD; n = 5, NEPC; n = 5) from Baca et al. (publicly available in Gene Expression Omnibus under accession code: GSE161948); teal, genome-wide 10 kb regions; brown, all significantly altered regions (PRAD vs NEPC) common in both datasets.
Fig. 3
Fig. 3. EZH2 inhibition induces bivalent promoters in NEPC.
A Clustering analysis of RNA-seq data (n = 3/condition/model) of PRAD or NEPC models treated with vehicle (Veh; DMSO) or 5 μM of tazemetostat (Taz) for 6 days. Unsupervised k-means clustering was performed on scaled (z-score) FPKM values of genes that were upregulated upon tazemetostat treatment in both models (log2FC > 0, FDR < 0.05). Optimum number of clusters was determined using sum of squared errors (k = 7). Z-score: red, high; blue, low; turquoise, cluster 3 corresponding to genes tazemetostat-induced in WCM154; teal, cluster 6 corresponding to genes tazemetostat-induced in LNCaP-abl. B H3K27me3/H3K4me3 CUT&RUN from LNCaP-abl and WCM154 was analyzed and plots show profiles of normalized H3K27me3 and H3K4me3 peaks at ±3 kb of gene bodies or TSS of genes upregulated upon EZH2i treatment in LNCaP-abl (turquoise) or WCM154 (teal). C Screenshots from Integrative Genomics Viewer (IGV) of CUT&RUN H3K27me3 or H3K4me3 or IgG levels in LNCaP-abl and WCM154 and the genomic loci of indicated MHC class I genes with vehicle or tazemetostat treatment; gray, IgG; red, H3K27me3; blue, H3K4me3. D FPKM values of HLA-B from the RNA-Seq (Fig. 3A) in vehicle or tazemetostat treated conditions in indicated models. Columns, means of values (n = 3); white, vehicle treatment; red, tazemetostat treatment; bars, SEM values; *p-value < 0.05, all statistical analyses used Wilcoxon two-sided tests. E Scatter plot of log2FoldChange of H3K27me3 and H3K4me3 upon tazemetostat treatment as described in (B) on bivalent promoters in WCM154; light blue, bivalent promoters in vehicle condition (n = 1535); red, bivalent promoters losing H3K27me3 and corresponding genes upregulated upon tazemetostat treatment (n = 209; log2FoldChange > 0; p-value < 0.05); r value corresponding p-value calculated from Pearson’s product-moment correlation analysis; gray line, linear regression; gray band, standard error of regression. F Gene ontology of bivalent promoters losing H3K27me3 and corresponding genes upregulated upon tazemetostat treatment (n = 209, log2FoldChange > 0; p-value < 0.05;) as described in (E); size, -log10FDR; orange-black gradient, gene ratio. G HOMER analysis was performed setting the promoter region as 1 kb upstream or downstream from TSS of bivalent genes in WCM154 and significantly enriched transcription factor motifs are highlighted.
Fig. 4
Fig. 4. EZH2i in NEPC models induce NE-lineage genes bearing bivalent promoters.
A Screenshots from Integrative Genomics Viewer (IGV) of CUT&RUN H3K27me3 or H3K4me3 or IgG levels in WCM154 treated with vehicle or tazemetostat as described in Fig. 1A at the genomic loci of ASCL1 with vehicle or tazemetostat treatment; gray, IgG; red, H3K27me3; blue, H3K4me3. B WCM154 was treated as mentioned in Fig. 1A and samples were processed for qRT-PCR. Target gene (ASCL1) mRNA levels were normalized to GAPDH expression and are represented as relative expression using one of the values obtained from vehicle-treated conditions as 1. Columns, means of values (n = 3); white, vehicle; red, tazemetostat; bars, SEM values; *p-value < 0.05, all statistical analyses used Wilcoxon two-sided tests. C Volcano plot of differentially expressed genes in WCM154 RNA-Seq data as described in Fig. 3A (n = 3/condition); blue, significantly downregulated genes upon tazemetostat treatment (log2FoldChange < 0; p-value < 0.05); red, significantly upregulated genes upon tazemetostat treatment (log2FoldChange < 0; p-value < 0.05); burgundy, NE-lineage transcription factors upregulated upon tazemetostat treatment. D Western blot analysis for indicated proteins showing efficiency of knockout of EZH2 in WCM154 using two independent sgRNAs targeting EZH2. Blots were reprobed for β-actin as loading control. Representative western blot from three independent experiments is shown. E WCM154 control or EZH2 knockout lines were processed for qRT-PCR. Target gene (ASCL1) mRNA levels were normalized to GAPDH expression and are represented as a relative expression using one of the values obtained from WCM154-sgINC conditions as 1. Columns, means of values (n = 3); white, WCM154-sgINC; orange, WCM154-sgEZH2 (#1 and #2); bars, SEM values; *p-value < 0.05, all statistical analyses used Wilcoxon two-sided tests. F Volcano plot of differentially expressed genes in WCM154 RNA-Seq data as described in (D; n = 3/condition); blue, significantly downregulated genes upon EZH2 knockout treatment (log2FoldChange < 0; p-value < 0.05); red, significantly upregulated genes upon EZH2 knockout treatment (log2FoldChange < 0; p-value < 0.05); burgundy, NE-lineage transcription factors upregulated upon EZH2 knockout. G Screenshots from Integrative Genomics Viewer (IGV) of CUT&RUN H3K27me3 or H3K4me3 or IgG levels in WCM154-sgINC or sgEZH2 #1 as described in (D) at the genomic loci of ASCL1 or LHX2; gray, IgG; red, H3K27me3; blue, H3K4me3. H Schematic of the WCM154 knockout of endogenous EZH2 and rescue using a recombinant dTAG-fused EZH2 and treatment with degrader compound (dTAGv-1) for 9 days. H3K27me3 levels are lost after EZH2 knockout and rescued (partially) after re-introduction of recombinant dTAG-EZH2 and again lowered upon 9 days of dTAGv-1 mediated degradation of EZH2. Figure 4/panel H Created with BioRender.com released under a Creative Commons Attribution-NonCommercial-NoDerivs 4.0 International license. I Western blot analysis for indicated proteins showing the efficiency of knockout of EZH2 and rescue using recombinant dTAG-EZH2 in WCM154. Impact of dTAGv-1 treatment at 8 h and 9 days is shown on levels of EZH2 and H3K27me3. Blots were reprobed for β-actin as loading control. Representative western blot from two independent experiments is shown. J WCM154 models with knockout of EZH2 (sgEZH2 #1) and rescue using recombinant dTAG-EZH2 were processed for RNA-Seq (n = 3/condition). Volcano plot of differentially expressed genes; blue, significantly downregulated genes upon EZH2 knockout treatment (log2FoldChange < 0; p-value < 0.05); red, significantly upregulated genes upon EZH2 knockout treatment (log2FoldChange < 0; p-value < 0.05); orange, EZH2 levels shown as control; burgundy, NE-lineage transcription factors upregulated upon rescue of EZH2 expression. K WCM154 models with recombinant dTAG-EZH2 treated with vehicle or dTAGv-1 for 9 days were processed for RNA-Seq (n = 3/condition). Volcano plot of differentially expressed genes; blue, significantly downregulated genes upon dTAGv-1 treatment (log2FoldChange < 0; p-value < 0.05); red, significantly upregulated genes upon dTAGv-1 treatment (log2FoldChange < 0; p-value < 0.05); burgundy, NE-lineage transcription factors upregulated upon rescue of EZH2 expression.
Fig. 5
Fig. 5. Non-canonical activity of EZH2 is limited to PRAD models.
A Scatter plot of differentially expressed genes in PRAD and NEPC models in RNA-Seq data as described in Fig. 1A (n = 3/condition/model); blue, significantly downregulated genes upon tazemetostat treatment (log2FoldChange < 0.5; p-value < 0.05); red, significantly upregulated genes upon tazemetostat treatment (log2FoldChange > 0.5; p-value < 0.05). B Scatter plot of differentially expressed genes in WCM154-sgEZH2 #1-dTAG-N-EZH2 rescue model in RNA-Seq data as described in Fig. 4H upon treatment with vehicle or dTAGv-1 treatment for 8 h (n = 3/condition; log2FoldChange < 0.5; p-value < 0.05). C Box plot summary of cumulative z-score of FPKM values (from Fig. 3A; n = 3) of 56 genes co-activated by EZH2 reported in Xu et al.; white, vehicle treatment; red, tazemetostat treatment; bars, center of box represents median, the lower and upper hinges correspond to the 25th and 75th percentiles, the upper whisker extends from the hinge to the largest value no further than 1.5 times inter-quartile range (IQR), the lower whisker extends from the hinge to the smallest value at most 1.5 times IQR of the hinge, data beyond the end of the whiskers are outliers and are plotted individually; –, p-value < 0.05; *, p-value < 0.05, all statistical analyses used Wilcoxon two-sided tests. D Cells or organoids of PRAD (pink) or NEPC (burgundy) models were treated as indicated in Fig. 3A (n = 3/condition) and RNA was isolated and processed for RNA-seq. GSEA analysis was performed and normalized enrichment score are plotted for the indicated pathway; gray-black gradient, FDR values. E FPKM values of CCNA2, CCNB1, and CCNB2 from the RNA-seq (Fig. 3A; n = 3/condition) in vehicle or tazemetostat treated conditions in indicated models. Columns, means of values (n = 3/condition/model); white, vehicle treatment; red, tazemetostat treatment; bars, SEM values; –, p-value < 0.05; *, p-value < 0.05, all statistical analyses used Wilcoxon two-sided tests. F Western blot analysis of LNCaP and LNCaP-abl samples treated with vehicle (DMSO) or 5 μM tazemetostat for 6 days as described in Fig. 1A (n = 3/condition), showing downregulation of indicated cyclins along with reduced levels of H3K27me3. Blots were reprobed for β-actin and total H3 as loading controls. Representative western blot from three independent experiments is shown. G IC50 dose response curves in PRAD (pale pink) and NEPC (burgundy) using increasing dose of CIR7-2512. dots, means of values (n = 5); bars, SEM values. H NEPC (burgundy) models were treated with vehicle (Veh; DMSO) or 500 nM CIR7-2512 for indicated number of days and cell viability was performed. dots, means of values (n = 5); grey, vehicle treatment; blue, tazemetostat treatment; bars, SEM values; –, p-value < 0.05; *, p-value < 0.05, all statistical analyses used Wilcoxon two-sided tests. I Prostate cancer models (Left panel – AR-driven PRAD; right panel – AR-indifferent NEPC) were treated with vehicle (Veh; DMSO) or 5 μM of tazemetostat (Taz) or 500 nM CIR7-2512 or in combination. CellTiter-Glo® luminescent cell viability assay was performed after 6 days of treatment. Columns, means of values (n = 5; WCM155, Taz treatment; n = 4); white, vehicle treatment; red, tazemetostat treatment; blue, CIR7-2512 treatment; green, combination treatment; bars, SEM values; –, p-value > 0.05 (not significant); *, p-value < 0.05, all statistical analyses used Wilcoxon two-sided tests. J Schematic of the differences in canonical and non-canonical function of EZH2 in prostate adenocarcinoma compared to neuroendocrine prostate cancer. Figure 5/panel J Created with BioRender.com released under a Creative Commons Attribution-NonCommercial-NoDerivs 4.0 International license.

Update of

References

    1. Quintanal-Villalonga, A. et al. Lineage plasticity in cancer: a shared pathway of therapeutic resistance. Nat. Rev. Clin. Oncol.17, 360–371 (2020). 10.1038/s41571-020-0340-z - DOI - PMC - PubMed
    1. Beltran, H. et al. The role of lineage plasticity in prostate cancer therapy resistance. Clin. Cancer Res.25, 6916–6924 (2019). 10.1158/1078-0432.CCR-19-1423 - DOI - PMC - PubMed
    1. Aggarwal, R. et al. Clinical and genomic characterization of treatment-emergent small-cell neuroendocrine prostate cancer: a multi-institutional prospective study. J. Clin. Oncol.36, 2492–2503 (2018). 10.1200/JCO.2017.77.6880 - DOI - PMC - PubMed
    1. Abida W. et al. Genomic correlates of clinical outcome in advanced prostate cancer. Proc. Natl Acad. Sci. USA. 10.1073/pnas.1902651116, https://www.ncbi.nlm.nih.gov/pubmed/31061129 (2019). - PMC - PubMed
    1. Beltran, H. et al. Molecular characterization of neuroendocrine prostate cancer and identification of new drug targets. Cancer Discov.1, 487–495 (2011). 10.1158/2159-8290.CD-11-0130 - DOI - PMC - PubMed

MeSH terms

Substances