. 2024 Aug 8;15(1):6767.
doi: 10.1038/s41467-024-51089-z.

A co-ordinated transcriptional programme in the maternal liver supplies long chain polyunsaturated fatty acids to the conceptus using phospholipids

Affiliations

A co-ordinated transcriptional programme in the maternal liver supplies long chain polyunsaturated fatty acids to the conceptus using phospholipids

Risha Amarsi et al. Nat Commun. .

Abstract

The long and very long chain polyunsaturated fatty acids (LC-PUFAs) are preferentially transported by the mother to the fetus. Failure to supply LC-PUFAs is strongly linked with stillbirth, fetal growth restriction, and impaired neurodevelopmental outcomes. However, dietary supplementation during pregnancy is unable to simply reverse these outcomes, suggesting imperfectly understood interactions between dietary fatty acid intake and the molecular mechanisms of maternal supply. Here we employ a comprehensive approach combining untargeted and targeted lipidomics with transcriptional profiling of maternal and fetal tissues in mouse pregnancy. Comparison of wild-type mice with genetic models of impaired lipid metabolism allows us to describe maternal hepatic adaptations required to provide LC-PUFAs to the developing fetus. A late pregnancy-specific, selective activation of the Liver X Receptor signalling pathway dramatically increases maternal supply of LC-PUFAs within circulating phospholipids. Crucially, genetic ablation of this pathway in the mother reduces LC-PUFA accumulation by the fetus, specifically of docosahexaenoic acid (DHA), a critical nutrient for brain development.


Conflict of interest statement

The authors declare no competing interests.

Figures

Fig. 1
Fig. 1. Study design.
A We used liver and plasma samples from a previously published cohort with manipulations to the imprinted gene, Dlk1. Numbers within the boxes represent group number and previously reported maternal plasma DLK1 concentration at 15.5 dpc (italic, in ng/mL4). The study included five pregnant groups at 15.5 dpc (groups 2, 4, 5, 7 and 8) and three age and genotype-matched virgin groups (groups 1, 3, and 6). Groups 1 and 2 were genetically unmodified females with normal DLK1 expression. Groups 6, 8 and 7 inherited a silent Dlk1 deletion from their mother and so maintained a functional copy of DLK1. Group 6 virgins replicate group 1 virgins, and group 8 replicate group 2 since they have normal conceptus-derived plasma DLK1 expression. Group 7 females were crossed to a Dlk1−/− sire, thus lack conceptus-derived plasma DLK1 expression. Groups 3, 5 and 4 were Dlk1−/− females and so did not have a functional copy of DLK1. Group 5 females had normal conceptus-derived plasma DLK1 expression while group 4 females were crossed to a Dlk1−/− sire and so lacked conceptus-derived plasma DLK1. B To test the effect of normal pregnancy on liver and plasma lipids, we conducted three replicate comparisons between virgin and pregnant groups of matched maternal Dlk1 genotype. C The influence of conceptus-derived circulating DLK1 on the normal pregnant lipidome was then investigated by two replicate comparisons between pregnant groups with and without a functional fetal Dlk1 copy in matched genotype dams (“Fetal Effect”). Similarly, the influence of DLK1 derived from maternal tissues on the normal pregnant lipidome was tested by comparing DLK1+ with DLK1- dams with matched fetal DLK1 production (“Maternal Effect”).
Fig. 2
Fig. 2. Lipid classes that change in the liver or plasma of mice in normal and Dlk1-manipulated pregnancy.
AJ Grouped relative abundance of lipid classes that are significantly different in liver or plasma in pregnant mice (15.5 dpc) compared to virgin controls (AH), and in pregnant mice that lack fetal or maternal-derived DLK1 protein (IJ). Significance was only considered if identified in at least two genotype-matched replicate group comparisons. All class data are found in Supplementary Data Tables S1–2. Data is presented as boxplots (median and IQR (25th and 75th percentiles) with whiskers showing 1.5*IQR) with individual values. Two-way ANOVA with Sidak’s multiple comparisons test was performed to determine significant class shifts between experimental groups (*p-value < 0.05; **p-value < 0.01; ***p-value < 0.001; ****p-value < 0.0001). Statistical tests were performed independently per ionisation mode and per genotype-matched replicate comparison. p-values for A: 1vs2 = 1.60 × 10−05, 6vs8 = 1.00 × 10−15, 3vs5 = 8.36 × 10−10; B: 1vs2 = 1.20 × 10−07, 6vs8 = 0.0002, 3vs5 = NS; C: 1vs2 = 6.54 × 10−05, 6vs8 = 1.00 × 10−15, 3vs5 = 5.00 × 10−15; D: 1vs2 = 7.50 × 10−14, 6vs8 = 8.34 × 10−10, 3vs5 = 8.70×10⁻¹⁴; E: 1vs2 = 0.0074, 6vs8 = 2.01 × 10−12, 3vs5 = 5.82×10−05; F: 1vs2 = 7.43 × 10−06, 6vs8 = 1.00 × 10−15, 3vs5 = 1.00 × 10−15; G: 1vs2 = NS, 6vs8 = 1.54 × 10−06, 3vs5 = 0.028; H: 1vs2 = NS, 6vs8 = 1.00 × 10−15, 3vs5 = 0.0009; I: 8vs7 = 8.39 × 10−05, 5vs4 = 3.00 × 10−13; J: 8vs7 = 2.61 × 10−05, 5vs4 = 5.82 × 10−07. Plasma data: n = 6 (group 1), n = 7 (group 2), n = 7 (group 3), n = 5 (group 4; +ve mode) n = 8 (group 4; −ve mode), n = 6 (group 5), n = 5 (group 6), n = 8 (group 7), n = 6 (group 8; +ve mode), n = 7 (group 8; −ve mode); Liver data: n = 7 (group 1), n = 6 (group 2), n = 7 (group 3), n = 8 (group 4), n = 8 (group 5), n = 7 (group 6), n = 7 (group 7, +ve mode), n = 8 (group 7; −ve mode), n = 8 (group 8); mice per group. CL cardiolipin, LPC lyso-phosphatidylcholine, LPE lyso-phosphatidylethanolamine, LPS lyso-phosphatidylserine, PC phosphatidylcholine, PC-O PC plasmalogen, PE phosphatidylethanolamine, TG triglyceride. Source data are provided as a Source Data file.
Fig. 3
Fig. 3. Changes to the fatty acid composition of PC and PE lipids in normal and Dlk1-manipulated pregnancy.
A Phospholipid structure. Phospholipids contain various head groups and are commonly associated with a saturated or monounsaturated fatty acid at the sn−1 position and a monounsaturated or polyunsaturated fatty acid at the sn−2 position. B, C Grouped relative abundance of PC (B) and PE (C) lipids that contain fatty acids with a combined total of three or fewer double bonds (left) or four or more double bonds (right) in the liver and plasma of virgin and pregnant (15.5 dpc) groups. PC data in the negative ionisation mode is shown in Supplementary Fig. S2A. D Schematic of n-6 and n-3 LC-PUFA synthesis from essential fatty acid precursors. E, F Grouped relative abundance of the most common PC (E) and PE (F) lipids that specifically contain ARA (left) or DHA (right), as identified by targeted LC-MS/MS analysis. List of included lipids are found in Supplementary Data Table S7. Grouped abundance data (B, C, E, F) is presented as boxplots (median and IQR (25th and 75th percentiles) with whiskers showing 1.5*IQR) with individual values. Each genotype-matched virgin vs pregnant comparison in (B, C, E, F) was compared by two-way ANOVA with Sidak’s multiple comparisons (*p-value < 0.05; **p-value < 0.01; ***p-value < 0.001; ****p-value < 0.0001). Significance was only considered if identified in at least two genotype-matched replicate comparisons. p-values for (B) - Liver PC (0-3 Double Bonds): 1vs2 = 0.0007, 6vs8 = 1.88 × 10−06, 3vs5 = 0.002; (B) - Liver PC (4+ Double Bonds): 1vs2 = 0.0001, 6vs8 = 0.0012, 3vs5 = 6.62 × 10−06; (B) - Plasma PC (0-3 Double Bonds): 1vs2 = 2.84 × 10−06, 6vs8 = 2.58 × 1007, 3vs5 = 9.10 × 10−06; (B) - Plasma PC (4+ Double Bonds): 1vs2 = 1.04 × 10−05, 6vs8 = 2.38 × 10−05, 3vs5 = 0.0096; (C) - Liver PE (0-3 Double Bonds): 1vs2 = 0.0007, 6vs8 = 0.0059, 3vs5 = 0.0004; (C) - Liver PE (4+ Double Bonds): 1vs2 = NS, 6vs8 = 0.0001, 3vs5 = 0.0002; C - Plasma PE (0-3 Double Bonds): 1vs2 = NS, 6vs8 = NS, 3vs5 = NS; C - Plasma PE (4+ Double Bonds): 1vs2 = 0.0064, 6vs8 = 1.18 × 10−10, 3vs5 = 1.07 × 10−10. p-values for (E) - Liver ARA-PC: 1vs2 = 0.0016, 6vs8 = 0.014, 3vs5 = 1.82 × 10−05; (E) - Liver DHA-PC: 1vs2 = 6.59 × 10−06, 6vs8 = 5.99 × 10−05, 3vs5 = 5.96 × 10−08; (E) - Plasma ARA-PC: 1vs2 = 4.00 × 10−05, 6vs8 = 0.0006, 3vs5 = NS; E - Plasma DHA-PC: 1vs2 = 5.17 × 10−08, 6vs8 = 8.44 × 10−08, 3vs5 = 0.0006; (F) - Liver ARA-PE: 1vs2 = 0.011, 6vs8 = NS, 3vs5 = 0.012; F - Liver DHA-PE: 1vs2 = 7.78 × 10−05, 6vs8 = 9.98 × 10−07, 3vs5 = 1.78 × 10−08; (F) - Plasma ARA-PE: 1vs2 = NS, 6vs8 = 0.0001, 3vs5 = 0.0017; (F) - Plasma DHA-PE: 1vs2 = 0.043, 6vs8 = 4.85×10−09, 3vs5 = 2.02×10−09. Plasma data: n = 6 (group 1), n = 7 (group 2), n = 7 (group 3), n = 6 (group 5), n = 5 (group 6), n = 6 (group 8; +ve mode), n = 7 (group 8; −ve mode); Liver data: n = 7 (group 1), n = 6 (group 2), n = 7 (group 3), n = 8 (group 5), n = 7 (group 6), n = 8 (group 8); mice per group. G Relative abundance of PE38:4 which was identified as a candidate biomarker (CBM) that distinguishes the livers of pregnant dams lacking maternal-derived DLK1 from those with normal expression of maternal-derived DLK1. CBMs are classified as lipids that passed both Bonferroni-adjusted two-tailed t-tests (liver threshold, p = 0.00234) and sparse partial least squares discriminant analysis in two genotype-matched replicate comparisons (see Supplementary Data Table S5 for full list of CBMs). CBM data is shown as individual relative abundance values with ± SD error bars and sn−1/sn−2 fatty acid compositions were assigned by targeted LC-MS/MS analysis (Supplementary Data Table S6). n = 8 (group 3), n = 8 (group 4), n = 8 (group 5), n = 7 (group 6), n = 8 (group 7), n = 8 (group 8); mice per group. All statistical tests were performed independently per ionisation mode and per genotype-matched replicate comparison. ARA arachidonic acid, DHA docosahexaenoic acid, PC phosphatidylcholine, PE phosphatidylethanolamine. Source data are provided as a Source Data file.
Fig. 4
Fig. 4. Hepatic profile of PUFA metabolites in virgin and pregnant mice.
A Heatmap showing all PUFA metabolite concentrations measured in the livers of virgin and pregnant (15.5 dpc) groups. Rows are organised by synthesis pathway and further sub-divided by the precursor PUFA from which the metabolite is sourced. Red boxes indicate ARA-derived metabolites. Values are z-transformed across samples. BG PUFA metabolites identified as candidate biomarkers (CBMs) that distinguish pregnant from virgin livers. CBMs are classified as metabolites that passed both Bonferroni-adjusted two-tailed t-tests (p-value threshold = 0.00811) and sparse partial least squares discriminant analysis. CBM data is shown as individual concentration values with ± SD error bars. CBM tests were performed individually per genotype-matched virgin vs pregnant comparison. H Schematic tree diagram of all measured metabolites in the LOX and COX pathways that are derived from ARA. Metabolites identified as CBMs of pregnancy are indicated in red. n = 8 (group 1), n = 7 (group 2), n = 8 (group 3), n = 8 (group 5), n = 7 (group 6), n = 8 (group 8); mice per group. IJ Immunohistochemistry showing COX1 and endomucin co-expression in an independent cohort of virgin (I) and pregnant (J) livers. Scale bars represent 500 μm for low-magnification images and 50 μm for enlarged images. Immunohistochemistry experiments were repeated twice (n = 3 mice per condition). All metabolites are defined in the Materials and Methods. Mean concentrations of individual metabolites per group are found in Supplementary Data Table S8. ALA α-Linolenic acid, ARA arachidonic acid, BOx beta-oxidation, COX cyclooxygenase, CYP Cytochrome P450, DHA docosahexaenoic acid, ENDO endomucin, EPA eicosapentaenoic acid, LA linoleic acid, LxA4 lipoxin A4, LOX lipoxygenase, PGD2 prostaglandin D2, PGE2 prostaglandin E2, PGF, prostaglandin F, TxB2 thromboxane B2, 5-HETE 5-hydroxyeicosatetraenoic acid. Source data are provided as a Source Data file.
Fig. 5
Fig. 5. Transcriptional analysis of LC-PUFA-phospholipid biosynthetic pathways in the pregnant liver.
A Schematic depicting the re-analysis of a published whole-transcriptome microarray dataset of livers from pregnant (14.5 dpc) and virgin mice (n = 4 mice per condition. B Heatmap showing z-transformed values of 3272 differentially expressed genes (DEGs) based on a p-value (corrected for multiple hypothesis testing based on the Benjamini–Hochberg procedure) threshold of 0.05 and a fold change threshold of 1.25. Differential expression analysis was performed using limma. List of DEGs is found in Supplementary Data Table S9. C Volcano plot showing DEGs (red) annotated with biosynthetic genes of interest. D Diagrammatic summary of hepatic lipid biosynthetic pathways chosen for targeted transcriptomics analysis annotated with microarray expression data (orange box = DEG that increased in pregnant livers; blue box = DEG that decreased in pregnant livers; grey box = gene not identified as differentially expressed). Known rate-limiting steps are indicated by thick black borders. Gene symbols are defined in Supplementary Data Table S10. E Schematic depicting real-time quantitative PCR (RT-qPCR) validation of candidate gene expression in livers from two genotype-matched virgin vs pregnant group comparisons. FI RT-qPCR data is split into fatty acid import and synthetic pathway genes (F), Kennedy pathway genes (G), Land’s Cycle genes (H) and lipid export pathway genes (I). RT-qPCR data was normalised to housekeeping gene expression (Tuba1, Tbp and Hprt) and is shown as mean relative expression ± SD. Groups were called significantly different by two-tailed Mann-Whitney U tests (*p-value < 0.05; **p-value < 0.01; ***p-value < 0.001). p-values for Cd36: 1vs2 = 0.0003, 3vs5 = 0.0002; Fads1: 1vs2 = 0.0003, 3vs5 = 0.0002; Fads2: 1vs2 = 0.0006, 3vs5 = 0.0003; Elovl2: 1vs2 = 0.0041; Elovl5: 1vs2 = 0.0012, 3vs5 = 0.0006; Scd1: 1vs2 = 0.0012, 3vs5 = 0.0012; Gpam: 1vs2 = 0.0205 0.007; Agpat2: 1vs2 = 0.0003, 3vs5 = 0.0003; Agpat3: 1vs2 = 0.0003, 3vs5 = 0.0002; Pcyt1a: 1vs2 = 0.0006, 3vs5 = 0.0002; Pemt: 3vs5 = 0.0003; Lpcat3: 1vs2 = 0.0205; Pnpla3: 1vs2 = 0.0006, 3vs5 = 0.0002; Mttp: 1vs2 = 0.0035, 3vs5 = 0.0003; Apob: 1vs2 = 0.0003, 3vs5 = 0.0003; Lipc: 1vs2 = 0.0003, 3vs5 = 0.0003. n = 8 (group 1; exceptions: n = 7 for Scd1, Elovl2, Fads2, Chka, Pcyt1a, Mttp, Pnpla3), n = 7 (group 2; exceptions: n = 6 for Scd1), n = 8 (group 3; exceptions: n = 7 for Scd1, Fasn, Lipc, Elovl5, Agpat2, Lpcat2, Lpcat3), n = 8 (group 5; exceptions: n = 7 for Elovl5, Fads2, Etnk1, Pemt, Lpcat2; n = 6 for Scd1); mice per group. DG diglyceride, LPA, lyso-phosphatidic acid, LPC lyso-phosphatidylcholine, LPE lyso-phosphatidylethanolamine, PA phosphatidic acid, PC phosphatidylcholine, PE phosphatidylethanolamine, TG triglyceride. Source data are provided as a Source Data file.
Fig. 6
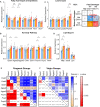
Fig. 6. Coordinated hepatic expression of LC-PUFA-phospholipid biosynthetic genes in response to Dlk1-manipulation in pregnancy.
AD Real-time quantitative PCR (RT-qPCR) analysis of LC-PUFA-phospholipid biosynthetic genes in pregnant mice (15.5 dpc) in response to Dlk1 manipulation. Genotype-matched replicate comparisons were performed to assess the effect of maternal-derived DLK1 protein or fetal-derived DLK1 protein on the expression of fatty acid import and synthetic pathway genes (A), Kennedy pathway genes (B), Land’s Cycle genes (C) and lipid export pathway genes (D). Gene symbols are defined in Supplementary Data Table S10. RT-qPCR data was normalised to housekeeping gene expression (Tuba1 and Hprt) and is shown as mean relative expression ± SD. Gene expression was compared between all four experimental groups by one-way ANOVA with Tukey’s multiple-comparison post-hoc test (*p-value < 0.05; **p-value < 0.01; *** p-value < 0.001). p-values for Fads1: 7vs4 = 0.0002, 8vs5 = 0.0226; Fads2: 7vs4 = 0.0008, 8vs5 = 0.0041; Gpam: 7vs4 = 0.0262; Agpat2: 7vs4 = 0.0292; Pcyt1a: 7vs4 = 0.0348, 8vs5 = 0.0423; Pcyt2: 7vs4 = 0.019; Pnpla3: 7vs4 = 0.0008, 8vs5 = 0.0363, Mttp: 7vs4 = 0.0474, 8vs5 = 0.0023. n = 7 (group 4; exceptions: n = 5 for Pla2g4a), n = 7 (group 5; exceptions: n = 6 for Pla2g4a; n = 5 for Lpcat2), n = 8 (group 7; exceptions: n = 7 for Elovl2), n = 7 (group 8; exceptions: n = 5 for Pcyt1a); mice per group. E, F Two-tailed multiple Pearson’s correlations between DLK1-responsive genes in pregnant (groups 2 and 5; E) and virgin (groups 1 and 3; F) livers. p-values in shaded red boxes indicate statistically significant correlations (Bonferroni-adjusted p-value threshold = 0.0045). n = 8 (group 1; exceptions: n = 7 for Fads2, Pcyt1a, Mttp, Pnpla3), n = 7 (group 2), n = 8 (group 3; exceptions: n = 7 for Agpat2), n = 8 (group 5; exceptions: n = 7 for Fads2); mice per group. Source data are provided as a Source Data file.
Fig. 7
Fig. 7. LXR-mediated activation of hepatic LC-PUFA-phospholipid biosynthesis, export and fetal transfer in late pregnancy.
A Schematic of the tissues analysed from an independent cohort of wild-type (WT) and Lxrab−/− (LXR double knockout (DKO)) mice at non-pregnant (NP) and various gestational timepoints (7.5, 14.5 and 18.5 dpc). Arrows indicate the hypothesized transfer of LC-PUFA-containing phospholipids between maternal and fetal compartments. BH RT-qPCR analysis of hepatic LC-PUFA-phospholipid biosynthetic genes in WT and LXR DKO groups. RT-qPCR data was normalised to housekeeping gene expression (Tuba1, Tbp and Hprt) and is shown as mean relative expression ± SD and were compared by two-way ANOVA with Šídák’s multiple comparison (*p-value < 0.05; **p-value < 0.01; ***p-value < 0.001; ****p-value < 0.0001). WT vs DKO p-values for Fads1: 14.5 dpc = 6.28 × 10−06, 18.5 dpc = 4.83 × 10−05; Fads2: 14.5 dpc = 2.80 × 10−05, 18.5 dpc = 0.0012; Pnpla3: 14.5 dpc = 1.50 × 10−08, 18.5 dpc = 9.54 × 10−08; Mttp: NP = 0.0056, 7.5 dpc = 0.0143, 14.5 dpc = 0.0066; Agpat3: 14.5 dpc = 0.0102. n = 8 (NP WT), n = 7 (NP DKO), n = 8 (7.5 dpc WT), n = 6 (7.5 dpc DKO), n = 7 (14.5 dpc WT), n = 7 (14.5 dpc DKO) n = 7 (18.5 dpc WT), n = 8 (18.5 dpc DKO); mice per condition. IL Grouped concentrations of ARA-containing PC, DHA-containing PC, ARA-containing PE and DHA-containing PE lipid species selected for targeted LC-MS/MS analysis in liver (I), serum (J), placenta (K) and fetal livers (L) from WT and LXR DKO groups at late-gestational timepoints. Individual lipid concentrations are found in Supplementary Data Table S12. Grouped lipid concentrations are presented as boxplots (median and IQR (25th and 75th percentiles) with whiskers showing 1.5*IQR) with individual values and Bonferroni-adjusted t-tests (p-value threshold = 0.025) were performed for each WT vs DKO comparison (*p-value < 0.05; **p-value < 0.01; ***p-value < 0.001; ****p-value < 0.0001). p-values for (J) - DHA-PC: 14.5 dpc = 0.0009; (L) - DHA-PC: 18.5 dpc = 0.0021; (L) - ARA-PE: 18.5 dpc = 0.0060. n = 7 (14.5 dpc WT), n = 7 (14.5 dpc DKO), n = 7 (18.5 dpc WT; exceptions: n = 6 for placenta), n = 8 (18.5 dpc DKO; exceptions: n = 6 for placenta; n = 7 for fetal liver); mice per condition. ARA arachidonic acid, DHA docosahexaenoic acid, PC phosphatidylcholine, PE phosphatidylethanolamine. Source data are provided as a Source Data file.

References

    1. Herrera, E. Metabolic adaptations in pregnancy and their implications for the availability of substrates to the fetus. Eur. J. Clin. Nutr.54, S47–S51 (2000). 10.1038/sj.ejcn.1600984 - DOI - PubMed
    1. Catalano, P. & deMouzon, S. Maternal obesity and metabolic risk to the offspring: why lifestyle interventions may have not achieved the desired outcomes. Int. J. Obes. (2005)39, 642–649 (2015).10.1038/ijo.2015.15 - DOI - PMC - PubMed
    1. Jawerbaum, A. & White, V. Animal Models in Diabetes and Pregnancy. Endocr. Rev.31, 680–701 (2010). 10.1210/er.2009-0038 - DOI - PubMed
    1. Cleaton, M. A. M. et al. Fetus-derived DLK1 is required for maternal metabolic adaptations to pregnancy and is associated with fetal growth restriction. Nat. Genet.48, 1473–1480 (2016). 10.1038/ng.3699 - DOI - PMC - PubMed
    1. Takada, S. et al. Delta-like and Gtl2 are reciprocally expressed differentially methylated linked imprinted genes on mouse chromosome 12. Curr. Biol.10, 1135–1138 (2000). 10.1016/S0960-9822(00)00704-1 - DOI - PubMed

LinkOut - more resources