. 2024 Aug 8;14(1):18455.
doi: 10.1038/s41598-024-68926-2.

Involvement of the splicing factor SART1 in the BRCA1-dependent homologous recombination repair of DNA double-strand breaks

Affiliations

Involvement of the splicing factor SART1 in the BRCA1-dependent homologous recombination repair of DNA double-strand breaks

Kie Ozaki et al. Sci Rep. .

Abstract

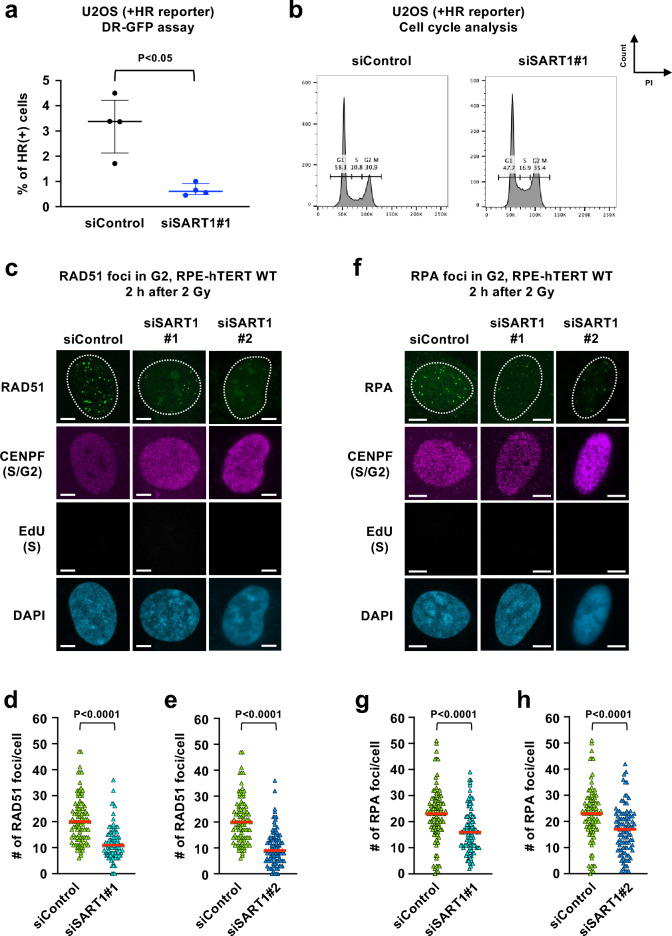
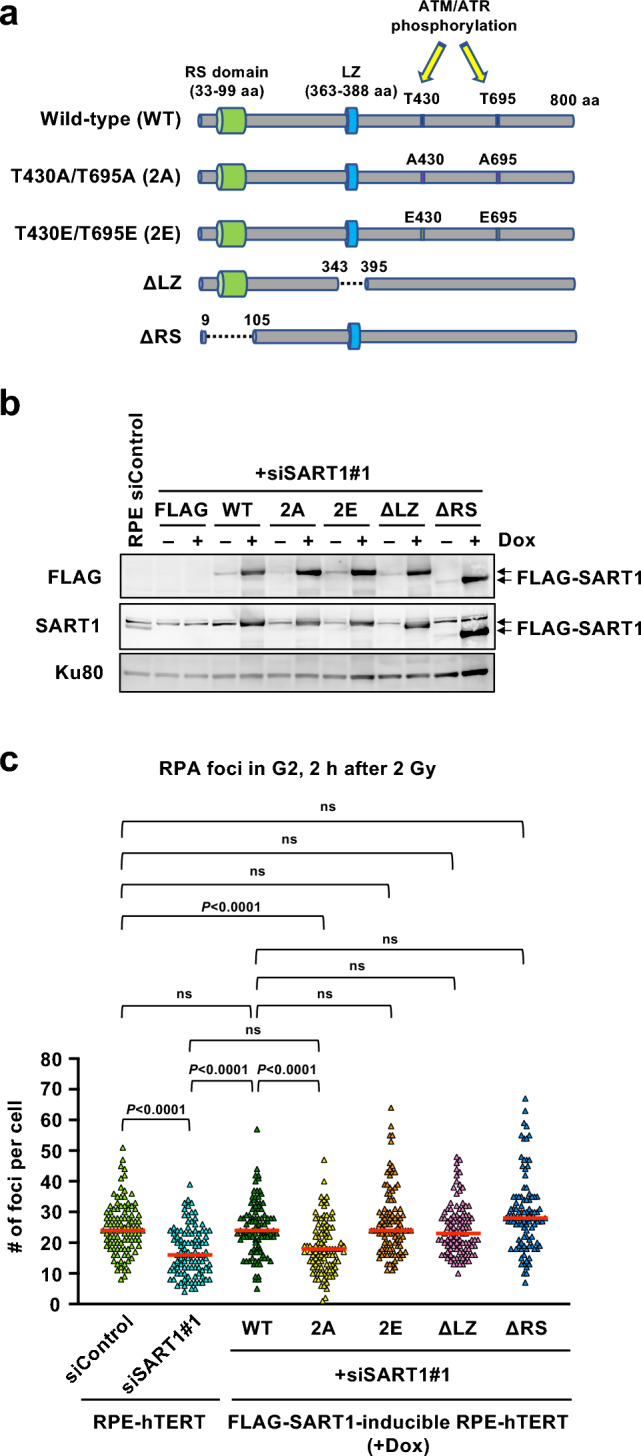
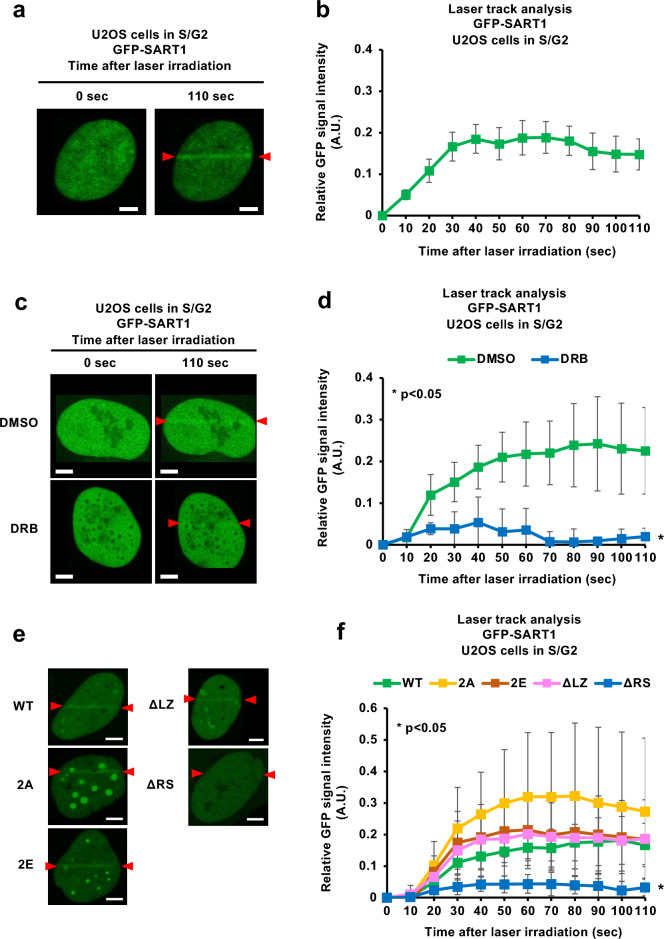
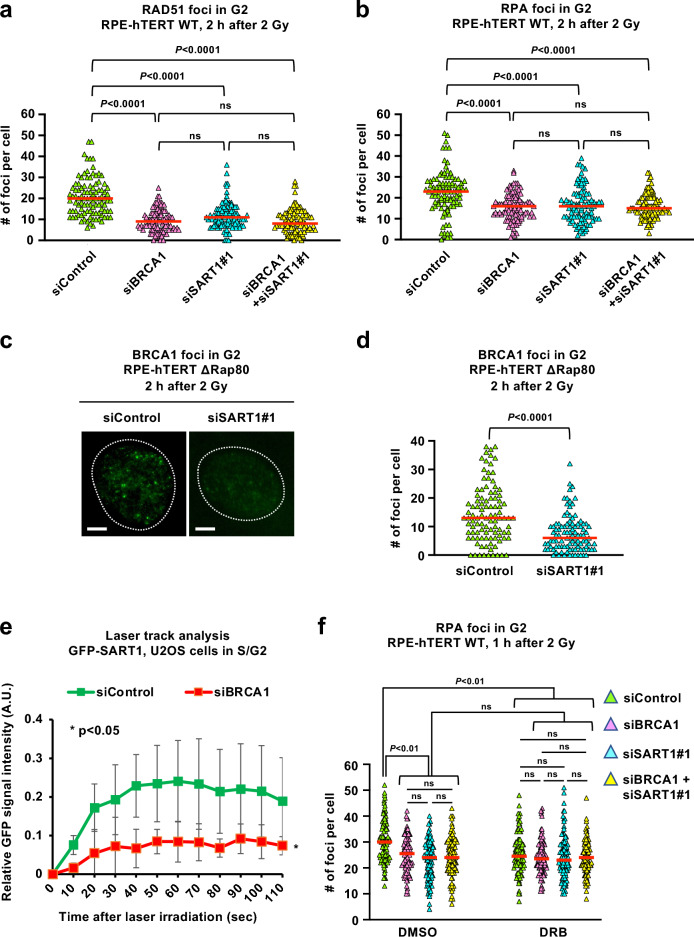
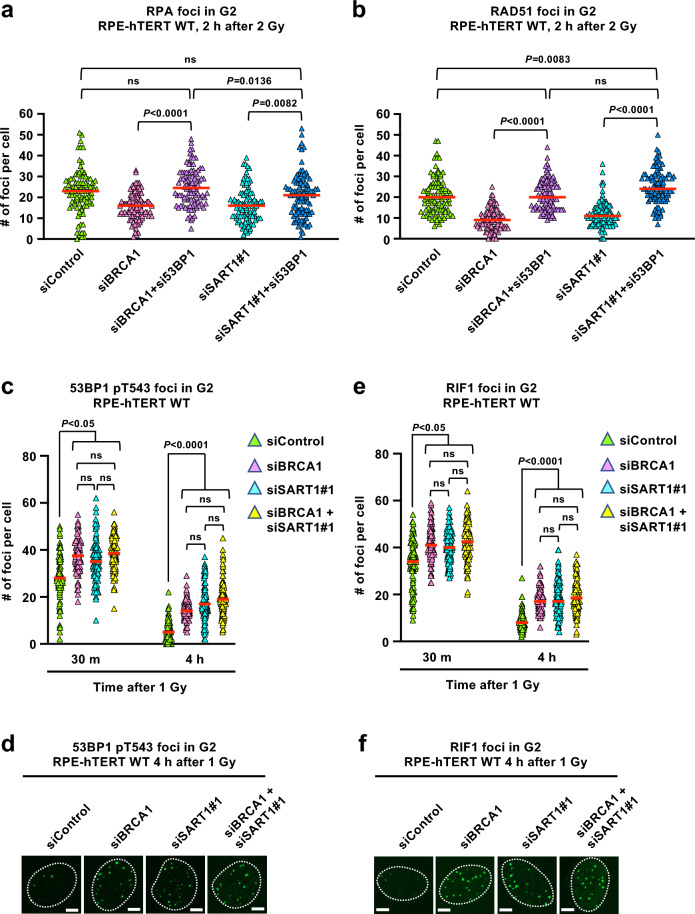
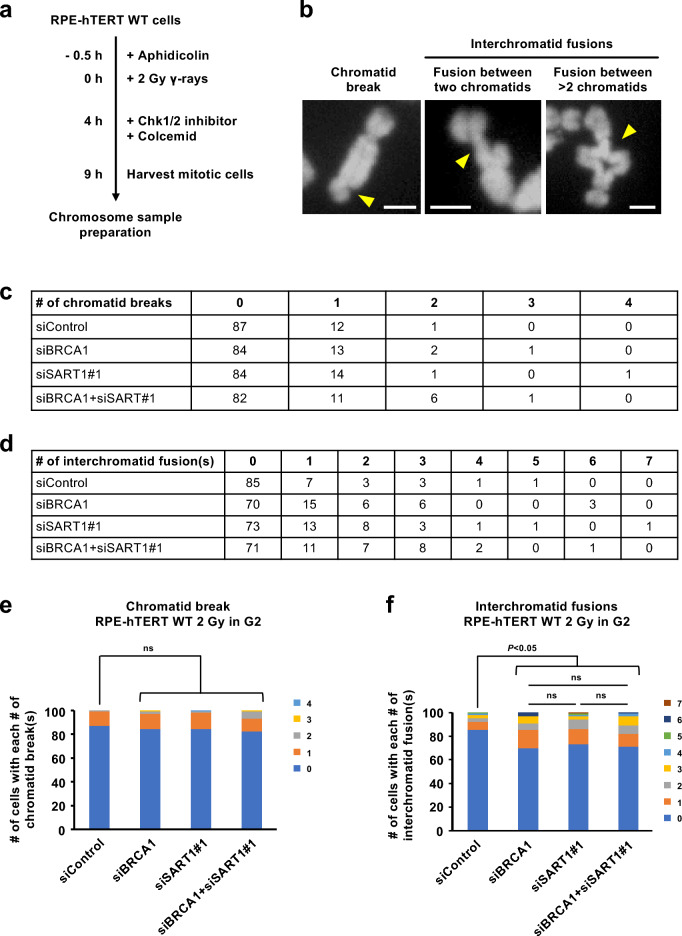
Although previous studies have reported that pre-mRNA splicing factors (SFs) are involved in the repair of DNA double-strand breaks (DSBs) via homologous recombination (HR), their exact role in promoting HR remains poorly understood. Here, we showed that SART1, an SF upregulated in several types of cancer, promotes DSB end resection, an essential first step of HR. The resection-promoting function of SART1 requires phosphorylation at threonine 430 and 695 by ATM/ATR. SART1 is recruited to DSB sites in a manner dependent on transcription and its RS domain. SART1 is epistatic with BRCA1, a major HR factor, in the promotion of resection, especially transcription-associated resection in the G2 phase. SART1 and BRCA1 accumulate at DSB sites in an interdependent manner, and epistatically counteract the resection blockade posed by 53BP1 and RIF1. Furthermore, chromosome analysis demonstrated that SART1 and BRCA1 epistatically suppressed genomic alterations caused by DSB misrepair in the G2 phase. Collectively, these results indicate that SART1 and BRCA1 cooperatively facilitate resection of DSBs arising in transcriptionally active genomic regions in the G2 phase, thereby promoting faithful repair by HR, and suppressing genome instability.


Conflict of interest statement

The authors declare no competing interests.

Figures

Figure 1
Figure 1
SART1 promotes homologous recombination (HR) by facilitating DSB end resection. (a) Effect of SART1 knockdown on HR efficiency. U2OS cells harboring the HR reporter were transfected with the indicated siRNA and subjected to the DR-GFP assay. The data are presented as median with interquartile range (N = 4). (b) Effect of SART1 knockdown on the cell cycle. U2OS cells harboring the HR reporter were transfected with the indicated siRNA. Cells were then fixed, and the nuclei were stained with propidium iodide (PI). The cell cycle status was identified by flow cytometry. (c) Immunofluorescence images of RAD51 foci in SART1 knockdown cells. Wild-type RPE-hTERT cells (RPE-hTERT WT) were transfected with indicated siRNAs. Two days after siRNA transfection, cells were irradiated with 2 Gy γ-rays and fixed 2 h later. The cells were treated with EdU 30 min before irradiation until fixation to label S-phase cells. Fixed cells were subjected to RAD51/CENPF immunofluorescence and EdU detection. RAD51 foci in CENPF( +)/EdU( −) G2 phase cells are shown. (d) Number of RAD51 foci in siSART1#1-transfected cells. Immunofluorescence samples were prepared as described in (c). (e) Number of RAD51 foci in siSART1#2-transfected cells. Immunofluorescence samples were prepared as described in (c). (f) Immunofluorescence images of RPA foci in SART1 knockdown cells. siRNA transfection, EdU treatment, irradiation, and fixation were performed, as described in (c). Fixed cells were subjected to RPA/CENPF immunofluorescence and EdU detection. RPA foci in CENPF( +)/EdU( −) G2 phase cells are shown. (g) Number of RPA foci in siSART1#1-transfected cells. Immunofluorescence samples were prepared as described in (f). (h) Number of RPA foci in siSART1#2-transfected cells. Immunofluorescence samples were prepared as described in (f). In (d), (e), (g) and (h), the number of foci in 100 G2 cells from two independent experiments (50 G2 cells/experiment/sample) is shown. Symbols and red bars in (d), (e), (g) and (h) represent the number of foci per cell and the median number of foci in each sample, respectively. Scale bars in (c) and (f), 5 µm.
Figure 2
Figure 2
ATM/ATR-dependent phosphorylation is important for the resection-promoting function of SART1. (a) Diagram of wild-type and mutant SART1 used for the add-back experiments. The domains and ATM/ATR-dependent phosphorylation sites in SART1 are shown. (b) Doxycycline (Dox)-dependent expression of FLAG-tagged WT and mutant SART1 proteins. FLAG-SART1-inducible RPE-hTERT cells were transfected with siSART1#1 and were lysed two days later. Dox was added 16–24 h before cell lysis to induce FLAG-SART1 protein. Then, the cell lysates were subjected to western blotting. (c) The resection-promoting activity of WT and mutant SART1. FLAG-SART1-inducible RPE-hTERT cells were treated with siSART1#1 and Dox for 2 days and 16–24 h, respectively. Then, the cells were irradiated with 2 Gy γ-rays and fixed 2 h later. The cells were treated with EdU from 30 min before irradiation until fixation to label S phase cells. The fixed cells were subjected to RPA/CENPF immunofluorescence and EdU detection. The number of RPA foci in the CENPF( +)/EdU( −) G2 phase cells was quantified. The number of foci in 100 G2 cells from two independent experiments (50 G2 cells/experiment/sample) is shown. Symbols and red bars represent the number of foci per cell and the median number of foci in each sample, respectively. ns, not significant.
Figure 3
Figure 3
SART1 is recruited to DSB sites in a manner dependent on transcription and its RS domain (a) SART1 is recruited to laser-induced DSBs. U2OS cells expressing mCherry-Geminin (an S/G2 phase marker) were transfected with GFP-SART1 vector. One day later, GFP( +)/mCherry( +) cells were irradiated with the 730 nm laser along the line flanked by two red arrowheads. A photosensitizer (Hoechst33342, 10 µg/mL) was added 30 min before irradiation. (b) Kinetics of SART1 recruitment to the laser track. Vector transfection and laser irradiation were performed as described in (a). The intensity of GFP-SART1 in the laser-irradiated regions of S/G2-phase U2OS cells was recorded every 10 s until 110 s after irradiation. N = 6. (c) Effect of transcription inhibition on SART1 recruitment to the laser track. Vector transfection and laser irradiation were done as described in (a). The cells were treated with DRB (100 µM) or DMSO (vehicle control) from 30 min before irradiation. (d) Transcription inhibition suppresses SART1 recruitment to the laser track. Vector transfection, chemical treatment, and laser irradiation were performed as described in (c). The intensity of GFP-SART1 was recorded as descried in (b). N = 6. (e) Live cell images of the wild-type and mutant SART1 proteins after laser irradiation. U2OS cells expressing mCherry-Geminin (an S/G2 phase marker) were transfected with wild-type or mutant GFP-SART1 vectors. One day later, GFP( +)/mCherry( +) cells were irradiated as described in (a). (f) Kinetics of recruitment of wild-type and mutant SART1 to the laser track. Vector transfection and laser irradiation were performed as described in (e). The intensity of GFP-SART1 was recorded as descried in (b). N = 8. Scale bars in (a), (c), and (e), 5 µm. Error bars in (b), (d), and (f) represent standard deviation.
Figure 4
Figure 4
Epistatic relationship between SART1 and BRCA1 in HR and resection in the G2 phase. (a) Number of RAD51 foci in BRCA1 and/or SART1 knockdown cells. RPE-hTERT WT cells were transfected with indicated siRNA(s). Two days after siRNA transfection, the cells were irradiated with 2 Gy γ-rays and fixed 2 h later. The cells were treated with EdU from 30 min before irradiation until fixation to label S phase cells. The fixed cells were subjected to RAD51/CENPF immunofluorescence and EdU detection. The number of RAD51 foci in the CENPF( +)/EdU( −) G2 phase cells was quantified. (b) Number of RPA foci in BRCA1 and/or SART1 knockdown cells. siRNA transfection, EdU treatment, irradiation, and fixation were performed as described in (a). The fixed cells were subjected to RPA/CENPF immunofluorescence and EdU detection. The number of RPA foci in the CENPF( +)/EdU(−) G2 phase cells was quantified. (c) Immunofluorescence images of BRCA1 foci in Rap80-knockout cells. Rap80-knockout RPE-hTERT cells (RPE-hTERT ΔRap80) were transfected with indicated siRNAs. EdU treatment, irradiation, and fixation were performed as described in (a). Fixed cells were subjected to BRCA1/CENPF immunofluorescence and EdU detection. BRCA1 foci in CENPF( +)/EdU( −) G2 phase cells are shown. (d) Effect of SART1 knockdown on the number of BRCA1 foci in Rap80-knockout cells. The immunofluorescence samples were prepared as described in (c). The number of BRCA1 foci in the CENPF( +)/EdU( −) G2 phase cells was quantified. (e) SART1 recruitment to DSB sites is BRCA1-dependent. The laser irradiation was performed as described in Methods. The intensity of GFP-SART1 in the laser-irradiated regions was recorded every 10 s until 110 s after irradiation. (f) SART1 promotes transcription-associated resection in an epistatic manner with BRCA1. RPA immunofluorescence samples were prepared as described in (b). Cells were treated with DRB (100 µM) or DMSO from 30 min before irradiation until fixation. In (a), (b), (d) and (f), the number of foci in 100 G2 cells from two independent experiments (50 G2 cells/experiment/sample) is shown. Symbols and red bars in (a), (b), (d) and (f) represent the number of foci per cell and the median number of foci in each sample, respectively. Scale bars in (c), 5 µm.
Figure 5
Figure 5
SART1 and BRCA1 epistatically counteract the 53BP1/RIF1-mediated resection blockade. (a) Effect of 53BP1 knockdown on the number of RPA foci in BRCA1 or SART1 knockdown cells. RPE-hTERT WT cells were transfected with the indicated siRNA(s). Two days after siRNA transfection, the cells were irradiated and fixed as indicated. The cells were treated with EdU from 30 m before irradiation until fixation to label S phase cells. The fixed cells were subjected to RPA/CENPF immunofluorescence and EdU detection. Foci number in CENPF(+)/EdU(−) G2 phase was quantified. (b) Effect of 53BP1 knockdown on the number of RAD51 foci in BRCA1 or SART1 knockdown cells. The experiment and foci number quantification were performed as described in (a) except for immunofluorescence of RAD51. (c) Effect of BRCA1 and/or SART1 knockdown on 53BP1 phosphorylation at DSBs. RPE-hTERT WT cells were transfected with the indicated siRNA(s). The experiment and foci number quantification were performed as described in (a) except for immunofluorescence of phosphorylated 53BP1 at threonine 543 (53BP1 pT543). (d) Immunofluorescence images of 53BP1 pT543 foci 4 h after irradiation. Samples were prepared as described in (c). 53BP1 pT543 foci in G2 cells are shown. (e) Effect of BRCA1 and/or SART1 knockdown on RIF1 foci formation at DSBs. The experiment and foci number quantification were performed as described in (a) except for immunofluorescence of RIF1. (f) Immunofluorescence images of RIF1 foci 4 h after irradiation. The samples were prepared as described in (e). RIF1 foci in G2 cells are shown. In (ac) and (e), the foci number in 100 G2 cells from two independent experiments (50 G2 cells/experiment/sample) is shown. Symbols and red bars in (ac) and (e) represent the number of foci per cell and the median number of foci in each sample, respectively. Scale bars in (d) and (f), 5 µm.
Figure 6
Figure 6
SART1 and BRCA1 epistatically suppress genomic alterations in the G2 phase. (a) Scheme of chromosome experiments in (cf). (b) Representative images of the detected chromosomal aberrations. Yellow arrowheads indicate aberrations. The chromosomes were stained with DAPI. Scale bars, 2 µm. (c) Frequency of chromatid break in BRCA1 and/or SART1 knockdown cells. RPE-hTERT WT cells were transfected with the indicated siRNA(s). Two days after siRNA transfection, the cells were treated, and chromosome samples were prepared as shown in (a). In total, one-hundred metaphase cells from two independent experiments (50 metaphases/experiment/sample) were analyzed for each sample. The numbers of cells with each number of chromatid break(s) are shown. (d) Frequency of interchromatid fusion in BRCA1 and/or SART1 knockdown cells. Chromosome samples were prepared and analyzed as described in (c). The numbers of cells with each number of interchromatid fusion(s) are shown. (e) BRCA1 and/or SART1 knockdown does not affect the frequency of chromatid break. Chromosome samples were prepared and analyzed as described in (c). The numbers of cells with each number of chromatid break(s) are shown. (f) SART1 and BRCA1 epistatically suppress interchromatid fusion. Chromosome samples were prepared and analyzed as described in (c). The numbers of cells with each number of interchromatid fusion(s) are shown.

References

    1. Bradley, R. K. & Anczuków, O. RNA splicing dysregulation and the hallmarks of cancer. Nat. Rev. Cancer23, 135–155 (2023). 10.1038/s41568-022-00541-7 - DOI - PMC - PubMed
    1. Hanahan, D. Hallmarks of cancer: new dimensions. Cancer Discov.12, 31–46 (2022). 10.1158/2159-8290.CD-21-1059 - DOI - PubMed
    1. Paulsen, R. D. et al. A genome-wide siRNA screen reveals diverse cellular processes and pathways that mediate genome stability. Mol. Cell35, 228–239 (2009). 10.1016/j.molcel.2009.06.021 - DOI - PMC - PubMed
    1. Adamson, B., Smogorzewska, A., Sigoillot, F. D., King, R. W. & Elledge, S. J. A genome-wide homologous recombination screen identifies the RNA-binding protein RBMX as a component of the DNA-damage response. Nat. Cell Biol.14, 318–328 (2012). 10.1038/ncb2426 - DOI - PMC - PubMed
    1. Herr, P. et al. A genome-wide IR-induced RAD51 foci RNAi screen identifies CDC73 involved in chromatin remodeling for DNA repair. Cell Discov.1, (2015). - PMC - PubMed

MeSH terms